Open Journal of Biophysics
Vol.2 No.3(2012), Article ID:21423,7 pages DOI:10.4236/ojbiphy.2012.23013
Analysis of Freely Swimming C. elegans Using Laser Diffraction
1Physics and Astronomy Department, Vassar College, Poughkeepsie, USA
2Department of Biology, Vassar College, Poughkeepsie, USA
3Department of Physics and Pre-Engineering, Delaware State University, Dover, USA
Email: *jemagnes@vassar.edu
Received May 22, 2012; revised June 28, 2012; accepted July 8, 2012
Keywords: Diffraction; C. elegans; Fourier Transform; Fourier Analysis; Mechanosensation
ABSTRACT
Soil and aquatic multicellular microorganisms play a critical role in the nutrient-cycling and organismal ecology of soil and aquatic ecosystems. These organisms live and behave in a complex three-dimensional environment. Most studies of microorganismal behavior, in contrast, have been conducted using microscope-based approaches, which limit the movement and behavior to a narrow, nearly two-dimensional focal field. We report on a novel analytical approach that provides real-time analysis of freely swimming C. elegans without dependence on microscope-based equipment. This approach consists of tracking the temporal periodicity of diffraction patterns generated by directing laser light onto nematodes in a cuvette. We measured oscillation frequencies for freely swimming nematodes in cuvettes of different sizes to provide different physical constraints on their swimming. We compared these frequencies with those obtained for nematodes swimming within a small droplet of water on a microscope slide, a strategy used by microscope-based locomotion analysis systems. We collected data from diffraction patterns using two methods: video analysis and real time data acquisition using a fast photodiode. Swimming frequencies of nematodes in a droplet of ionic solution on a microscope slide was confirmed to be 2.00 Hz with a variance of 0.05 Hz for the video analysis method and 0.03 Hz for the real time data acquisition using a photodiode; this result agrees with previously published estimates using microscope-based analytical techniques. We find the swimming frequency of unconstrained worms within larger cuvettes to be 2.37 Hz with a variance of 0.02 Hz. As the cuvette size decreased, so did the oscillation frequency, indicating a change in locomotion when physical constraints are introduced.
1. Introduction
C. elegans are free-living soil-dwelling nematodes that navigate in three dimensions. They move both on a solid matrix like soil or agar in a sinusoidal locomotory pattern called “crawling” and in liquid in a different pattern called “swimming” [1]. While the underlying muscularture and nervous innervation are well described, the changes in circuitry and the behavioral mechanisms underlying the switch between these locomotory patterns are much less understood. In addition, the roles played by sensory information provided by mechanosensory, chemosensory, and thermosensory cells that govern plastic changes in locomotory patterns and switches in patterns are only starting to be elucidated [2].
Because of the small size of the organisms, ~1 mm × 0.1 mm, these studies have thus far been limited to video imaging of nematodes on a microscope slide [3]. On a smooth agar surface, nematodes crawl in a sinusoidal pattern on their sides, using repetitive dorsal-ventral waves initiated by the head and propagated by muscles under the control of a central pattern generator neural circuit [4]. The speed of locomotion is equal to the body length (about 1 mm) times the oscillation frequency of the head (about 0.8 Hz) [1 ]. Genetic analysis of this rather restricted movement has led to the elucidation of the neuromuscular circuitry and the cellular mechanisms of the generation of the movement [5]. More recently, studies of C. elegans locomotion in liquid, usually within small drops on a microscope slide, have revealed aspects of the plasticity of locomotion in the nematode, in particular the ability to switch locomotory styles upon encountering a different medium [1]. The soil environment of nematodes in their native environment is much more complex than either an agar or a liquid medium. In addition, nematodes move within a three-dimensional space, responding not only to changes in medium (soil particles, water, colloidal mixtures, other organisms), but also moving within three dimensions, presumably altering locomotory patterns in response to gravity, temperature, humidity, and other environmental cues. Because of the nearly exclusive reliance on microscope analysis of locomotion, many of the three-dimensional aspects of locomotion and its plasticity have not been examined. Recent work has attempted to model the more complex real-world environment of soil nematodes by placing worms in microfluidic chambers, made of agar or an elastomeric substance, filled with water [6]. The worms navigate the environment with novel locomotory patterns, so-called “enhanced swimming” that relies on mechanosensory neuron signal transduction [7]. However, the contribution or influence of the gravitational field and the movement of the worm within three-dimensional space cannot be studied with these microscope-based approaches.
There have been other recent studies of real-time analysis of locomotory behavior of single-celled micro-organisms [8-10], but all of those techniques required high-powered microscopy and were limited to unicellular behavior. We were interested in developing an analytical technique that was not dependent on the use of a microscope and was able to measure locomotory behavior of a multicellular microorganism while it moves freely in real time. Such an analytical technique would enable realtime dynamic analysis for applications not limited to the focal lengths of microscope objectives. Very recently, microscope-based optomechanical analysis has enabled the real-time tracking of nematodes (Faumont et al., 2011) without relying on time-consuming image-acquisition for the tracking of the animals, but this technique required not only a microscope, but multiple cameras and computerized stages for tracking, components that are expensive and essentially tailored for a highly specific set of conditions. The approach we report here does not require a microscope, uses a single camera and so is considerably less expensive. Further, this approach is not limited to nematodes, but could be utilized to assess real-time three-dimensional behavior of many different organisms, from single-celled microorganisms to larger multicellular organisms. This approach can be automated and adapted for use in high-throughput genetic screens for behavioral mutants. The goal of this work was to develop this analytical approach and to explore locomotory behavior of nematodes while they swim in freely unconstrained conditions and compare that behavior with locomotion under conditions usually required for microscope-based techniques. This type of diffraction analysis provides a simple, inexpensive diagnostic tool to microscopists and will also provide the community with a deeper understanding of the physical and biological processes underlying locomotion. Noever et al., for example, have used diffraction patterns directly to track microbial growth [11]. The studies do not depend on living species remaining in a limited image plane and, as a result, the dynamics of living physical systems can be studied in three dimensions. This method is flexible in exposure times, wide-field observation, and wavelength.
Many modern imaging methods such as photothermal microscopy [12,13] and 4Pi-STED Microscopy [14,15] require species to be constrained to two-dimensional focal planes with a typical depth of field, DoF, on the order of micrometers [16] since the DoF is inversely related to the magnification m. In addition, the f-number N has a reciprocal relationship with the circle of confusion (c) so that a short focal length is associated with a large c [17,18]:
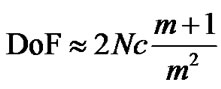 . (1)
. (1)
Typical multiphoton fluorescence microscopes compensate for the depth of field on the order of hundreds of microns [19]. Light Field Microscopy (LFM) [20] corrects optical aberrations digitally [21] and is still limited to the DoF indicated in Equation (1). This work presents microscopic methods for (a) measuring periodic motion that extends past the DoF in real time and (b) tracking dynamic structural changes of the unconstrained species in three dimensions, as is the case in microscopic studies. Diffraction analysis can provide ways to analyze microscopic organism behavior without requiring the animal to remain within a focal plane. In addition, the photo-diode allows for real-time observations of animal behavior.
We demonstrate in this study that physical constraints do alter swimming frequencies in C. elegans. We also demonstrate the feasibility of this analytical technique for exploring the influence of environmental conditions on C. elegans behavior.
2. Experimental Setup
We constructed a table-top experimental apparatus to record diffraction patterns of living micrometer sized organisms (Figure 1) with a modification for an alternate scheme to record real time intensity fluctuations (Figure 2). The adult wildtype C. elegans were washed to remove any adhering light-scattering substances and then placed in solution-filled quartz cuvettes of varying dimensions. Even though C. elegans perform swimming motions (called thrashing or swimming) they slowly sank to the bottom of the cuvette at a rate of ~0.4 mm/s. The worms crossed a laser beam with a diameter of ~1.3 mm. The average nematode completed about 3 locomotory cycles as it traversed the laser beam. We are able to tell for each data set, i.e., for each worm, how much time each worm
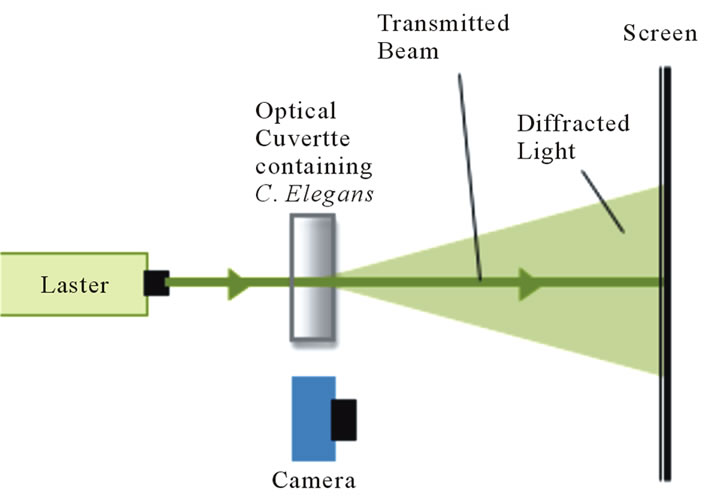
Figure 1. A green HeNe laser was used to create a dynamic diffraction pattern using live C. elegans. The diffraction pattern was filmed at 120 fps.
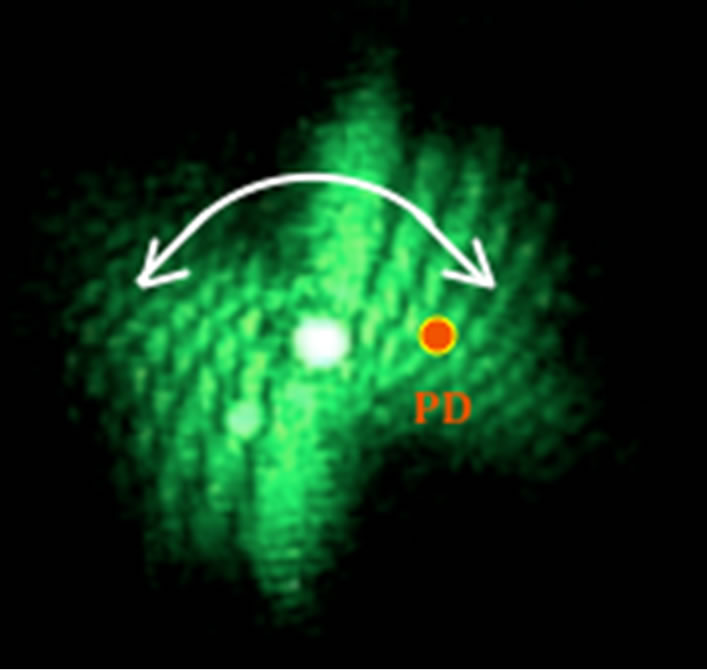
Figure 2. A photodiode with 1ns rise time is placed off center in the oscillating diffraction pattern. The image shows the diffraction pattern at one instant in time. The curved arrow indicates the oscillation.
spent in the laser beam by itself as shown by the sample data presented in Figures 3 and 4. These figures reveal that the worms showed 6 - 8 thrashing cycles. The light that passed by the worms was terminated at a screen several feet after the cuvette. The un-diffracted (transmitted) light passed through a hole in the screen so that only the diffracted light appeared on the screen (Figure 3). The diffraction patterns were filmed at a rate of 120 frames per second (fps) using the Casio High Speed Exilim camera. The dynamic diffraction patterns were analyzed using Logger Pro video analysis software. The laser beam used in this experiment had an average power of ~2 mW.
For this experiment we used a green HeNe laser
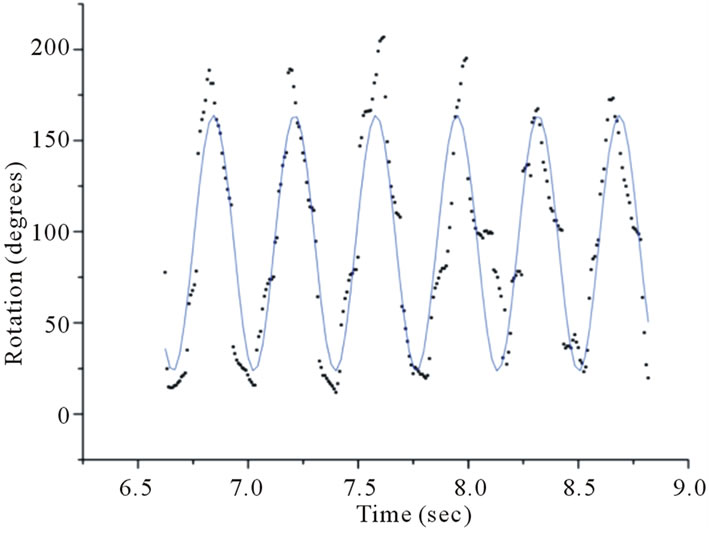
Figure 3. Fitting a sinusoidal function to data obtained using video analysis reveals a thrashing frequency of ~2.7 Hz for one wildtype (WT) C. elegans in a 2 mm thick cuvette.
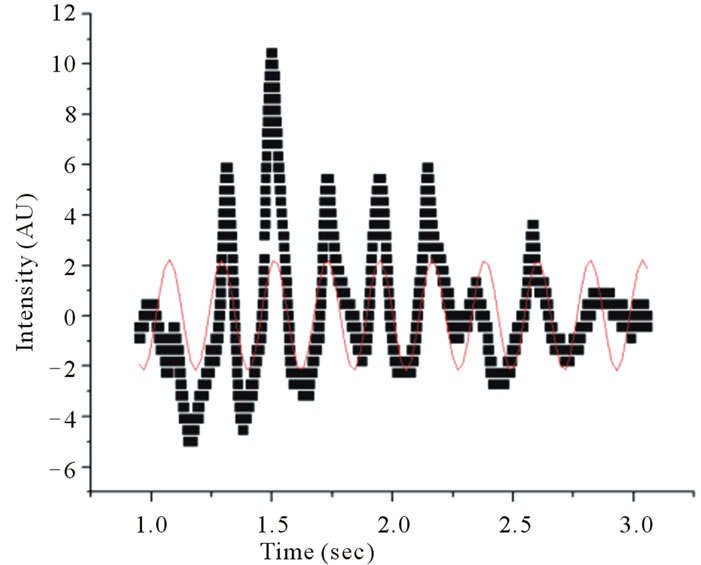
Figure 4. Fitting a sinusoidal function to data obtained using the automated technique reveals a thrashing frequency of ~2.4 Hz for one of wildtype (WT) C. elegans in a 5 mm wide cuvette.
(Melles Griot) operating at a wavelength of 543 nm. The temperature in the cuvette was stable within 0.1˚C for the duration of the experiment. The temperature of the cuvette was measured using a Stainless Steel Temperature Probe (TMP-BTA) made by Vernier.
In addition to recording the diffraction patterns, we used an automated method to record locomotion in real time. Using this method, a fast photodiode with a rise time of 1 ns and an area of 1 mm2 was placed in the diffraction pattern in an off center position (Figure 2). As the diffraction pattern oscillated about the central maximum, the signal from the photodiode was fed into a computer-interfaced oscilloscope (PicoScope) and recorded. This signal corresponds to the nematode swimming frequencies and the time spent in the laser beam since the diffraction pattern changes at the same rate as the diffracting worm as discussed in the following section. Equation (2) relates the worm shape to the diffraction pattern.
3. Data Analysis and Discussion
After investigated temporal aspects of diffraction structures, such as waveforms and dimensions, as well as temporal intensity fluctuations of interference spots of unconstrained C. elegans. We define unconstrained as a worm fully immersed in the ionic solution without gravity forcing contact with a solid material, i.e., the bottom of the cuvette. The diffraction structures of the swimming C. elegans varied periodically. Tracking angular variations of the diffraction patterns using video analysis revealed distinct and measurable periodicities (Figure 3). The angular displacement as a function of time is shown in Figure 3. Data runs revealed distinct behavior for varying physical constraints. All cuvettes were 1 cm wide and 4 cm tall and varied in thickness. Using video analysis, 17 worms were observed in a 1 mm thick cuvette, 28 worms were observed in a 2 mm cuvette and 32 worms were observed in a 5 mm thick cuvette.
For the 1 mm cuvette, the worm swimming frequencies were distinctly different from the swimming frequencies of the worms measured in the larger cuvettes. Tables 1 and 2 show the swimming frequencies in the 2 mm and 5 mm thick cuvettes are consistent with unconstrained motion; the swimming frequencies for unconstrained nematodes (2 mm and 5 mm) were significantly faster than for nematodes constrained by the 1 mm cuvette. As an example, measuring the peak-to-peak time interval in Figures 3 and 4 reveals time periods of about 0.37 s and 0.42 s respectively. Taking the inverse renders thrashing frequencies of about 2.7 Hz and 2.4 Hz for the 2 mm and 5 mm thick cuvettes respectively.
To verify the validity of our method, we compared the swimming frequency of a nematode in a water droplet on a microscope slide, which was determined using the same video analysis of diffraction patterns to previously published data [1]. The swimming frequencies on the microscope slide matched those obtained with other methods confirming that the 544 nm light and 2 mW power did not affect worm locomotion.
A worm on a water droplet was constrained to similar dimensions as a worm in a 1 mm cuvette which was apparent in the matching swimming frequencies of ~2.0 Hz. The worm swims at a similar frequency in the 1 mm cuvette and in the water droplet. While the constraints are similar for a worm moving in a water droplet and a worm moving in a 1 mm cuvette, they are not exactly the same physical situation. This work is providing the community with an experimental tool to explore questions about the fluid dynamics combined with gravitational and Van der Waals effects.
To enhance the data collection process, we monitored swimming frequencies in real time using a modified setup (Figure 2). This setup used a photodiode linked to a digital oscilloscope. A sinusoidal curve was then fitted to the intensity fluctuations from the photodiode (Figure 4). The swimming frequencies, which are also shown in Table 2, were consistent with those using video analysis. Freely swimming worms in 2 mm and 5 mm cuvettes showed an increased frequency of about ~2.4 Hz. A crawling C. elegans typically undulates at 0.8 Hz. An increased undulation frequency of a crawling worm results in increased speed.
The spatial structure of diffraction patterns contains information about the worm’s shape or body position at any instant in time. Given a mathematical description of a diffracting object, the Fourier Transforms (FT) can be used to model the far-field (Fraunhofer) diffraction pattern. The intensity distribution I(x,y) of a far-field diffraction pattern is proportional to
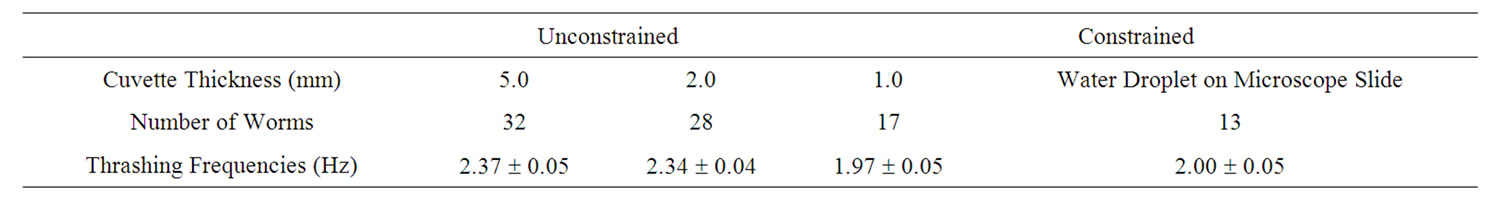
Table 1. Swimming frequencies of worms under different physical constraints using video analysis. The errors represent the variance of the statistical sample.
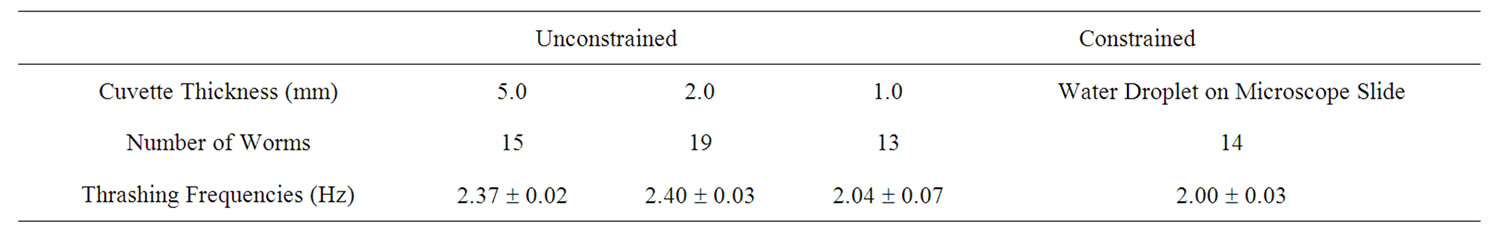
Table 2. Swimming frequencies of worms under different physical constraints using real time diffraction tracking. The errors represent the variance of the statistical sample.
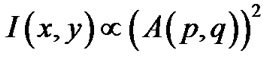 , (2)
, (2)
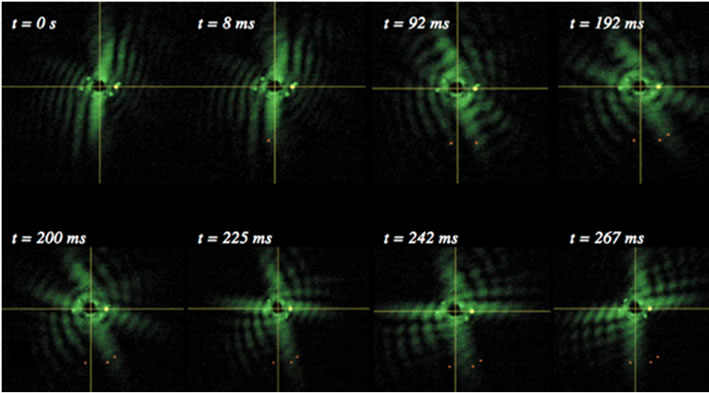
where A(p,q) is the modulus of the Fourier transform [22]. This relationship introduces symmetrical properties in all diffraction patterns. As a worm changes its shape, the symmetries of the worm itself and the corresponding diffraction pattern contain information about the worm’s spatial structure at any time. Diffraction symmetries (Figure 5) are results of changing structures as a worm goes through a swim cycle (Figure 6). Images of actual nematodes shown in Figure 6 were used to model previously recorded diffraction patterns (Figure 5(a)). In accordance with Equation (2), the phase information gets lost in the diffraction pattern when the magnitude of the modulus is squared so that a direct calculation of the actual worm shape from a diffraction pattern is not possible. It should be noted that comparison of the modeled and recorded diffraction patterns give clues about the worm symmetries of freely moving (unconstrained) worms. The modeled diffraction patterns have been matched with the actual diffraction patterns to indicate the original worm shapes. The original worm shapes correspond to the actual diffraction patterns. The diffraction patterns in
 (a)
(a)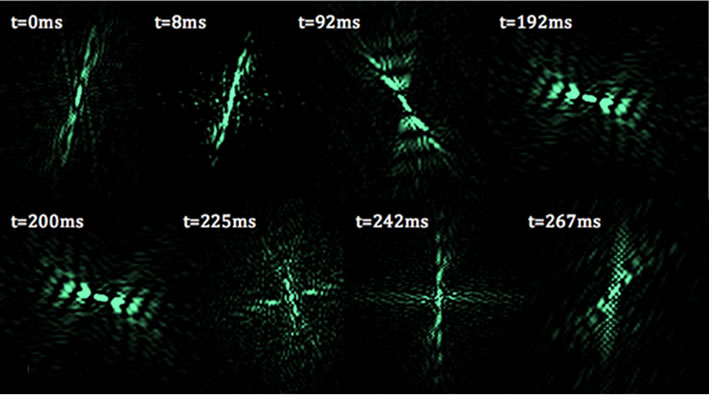 (b)
(b)
Figure 5. Worm diffraction patterns: (a) About half of a recorded swimming cycle is shown above. The times correspond to the different stages of a swim cycle that starts at time t = 0 ms. Angular changes in the diffraction patterns are traced. The diffraction pattern does not rotate rigidly but changes its symmetries; (b) Modeled diffraction patterns using images of actual worms shown in Figure 6.
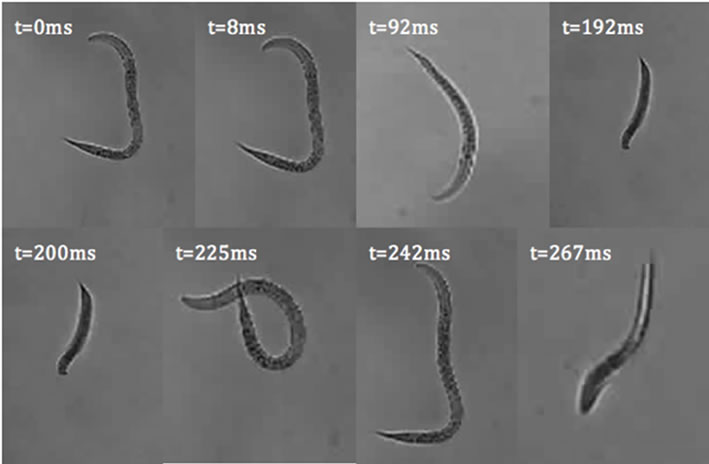
Figure 6. C. elegans images used to model diffraction patterns in Figure 5(b). The orientation of the worms has been arranged to align the worms to fit the image panels.
Figure 5(b) were obtained by converting the worm images in Figure 6 to binary matrices. The matrix was then fast Fourier transformed and the modulus of the matrix was squared. The resulting matrix is then converted in to an image and represents the intensity distribution of the diffraction pattern.
We used two different methods to analyze diffraction patterns of freely swimming C. elegans. This diffraction method is not meant to serve as a replacement for all microscopic techniques. Rather, it serves as a complimentary technique. The user will not be able to obtain a real time image of the nematodes. Video analysis was the first method and served as a proof of concept showing that the oscillation of the diffraction pattern does correspond to the thrashing frequency of the C. elegans. The diffraction patterns were filmed and the periodic motion was analyzed using Logger Pro. This method is time consuming, however, the entire diffraction pattern is recorded and is therefore available for additional analysis later on. The second method involves placing a photodiode off-center in the oscillating diffraction pattern. The intensity fluctuations are then recorded through a digital oscilloscope. In this case, the oscillations appear on the computer screen in real time. The errors in undulation frequencies for the real time automated data acquisition using a photodiode is more precise than for the video analysis. The results in Tables 1 and 2 show that minimal constraints can result into swimming frequencies of up to 2.37 Hz for wildtype C. elegans.
4. Conclusion
We demonstrated that swimming behavior of freely swimming microorganisms can be quantitatively determined using diffraction analysis without relying on a microscope or multiple cameras. The automated diffraction analysis shows swimming patterns in real time so that swimming frequencies can be read off the computer screen instantly, making this approach highly useful for high throughput genetic screen analysis of mutant behavioral phenotypes. Our results suggest that nematode swimming behavior is modified in the presence of physical constraints. Thus, nematodes reduce the frequency of swimming cycles in more confined locations. Physical constraints like the water content in soil and the presence of other nematodes might influence nematode locomotion in their more natural environment. This analytical approach will enable researchers to explore the sensitivity of sensory processes like mechanosensation governing these changes in locomotory behavior and the influence of other stimuli like gravity (Kim et al., 2007) [23].
5. Acknowledgements
We thank Julie Park, Tzlil Rozenblat, Karl Spuhler and Rahul Khakurel for technical assistance. This work was supported by the Vassar College Undergraduate Research Summer Institute (URSI), Lucy Maynard Salmon Research Fund and the NASA award # NX09AU90A, National Science Foundation Center for Research Excellence in Science and Technology (NSF-CREST) award # 0630388 and the NSF award # 1058385.
REFERENCES
- J. T. Pierce-Shimomura, B. L. Chen, J. J. Mun, R. Ho, R. Sarkis and S. L. McIntire, “Genetic Analysis of Crawling and Swimming Locomotory Patterns in C. elegans,” Proceedings of National Academy of Sciences of the USA, Vol. 105, No. 52, 2008, pp. 20982-20987. doi:10.1073/pnas.0810359105
- W. Li, Z. Feng, P. W. Sternbert and X. Z. S. Xu, “A C. elegans Stretch Receptor Neuron Revealed by a Mechanosensitive TRP Channel Homologue,” Nature, Vol. 440, No. 7084, 2006, pp. 684-687. doi:10.1038/nature04538
- J. Korta, D. A. Clark, C. V. Gabel, L. Mahadevan and A. D. T. Samuel, “Mechanosensation and Mechanical Load Modulate the Locomotory Gait of Swimming C. elegans,” Journal of Experimental Biology, Vol. 210, No. 13, 2007, pp. 2383-2389.
- D. L. Riddle, T. Blumenthal, B. J. Meyer and J. R. Priess, “C. elegans II,” Cold Spring Harbor Laboratory Press, New York, 1997.
- M. Chalfie, J. E. Sulston, J. G. White, E. Southgate, J. N. Thomson and S. Brenner, “The Neural Circuit for Touch Sensitivity in Caenorhabditis elegans,” Journal of Neuroscience, Vol. 5, No. 4, 1985, pp. 956-964.
- S. R. Lockery, K. J. Lawton, J. C. Doll, S. Faumont, S. M. Coulthard, T. R. Thiele, N. Chronis, K. E. McCormick, M. B. Goodman and B. L. Pruitt, “Artificial Dirt: Microfluidic Substrates for Nematode Neurobiology and Behavior,” Journal of Neurophysiology, Vol. 99, No. 6, 2008, pp. 3136-3143. doi:10.1152/jn.91327.2007
- S. Park, H. Hwang, S.-W. Nam, F. Martinez, R. H. Austin and W. S. Ryu, “Enhanced Caenorhabditis elegans Locomotion in a Structured Microfluidic Environment,” Plos One, Vol. 3, No. 6, 2008, p. e2550. doi:10.1371/journal.pone.0002550
- J. Sheng, E. Malkiel, J. Katz, J. Adolf, R. Belas and A. R. Place, “Digital Holographic Microscopy Reveals PreyInduced Changes in Swimming Behavior of Predatory Dinoflagellates,” Proceedings of National Academy of Sciences of the USA, Vol. 104, No. 44, 2007, pp. 17512- 17517. doi:10.1073/pnas.0704658104
- R. Thar, N. Blackburn and M. Kühl, “A New System for Three-Dimensional Tracking of Motile Microorganisms,” Applied and Environmental Microbiology, Vol. 66, No. 5, 2000, pp. 2238-2242.
- G. Corkidi, B. Taboada, C. D. Wood, A. Guerrero and A. Darszon, “Tracking Sperm in Three-Dimensions,” Biochemical and Biophysical Research Communications, Vol. 373, No. 1, 2008, pp. 125-129. doi:10.1016/j.bbrc.2008.05.189
- D. Noever, H. Matsos, A. Brittain, D. Obenhuber, R. Cronise and S. Armstrong, “Microbial Diffraction Gratings as Optical Detectors for Heavy Metal Pollutants,” Review of Scientific Instruments, Vol. 67, No. 3, 1996, pp. 828-832. doi:10.1063/1.1146817
- H. Kimura, F. Nagao, A. Kitamura, K. Sekiguchi, T. Kitamori and T. Sawada, “Detection and Measurement of a Single Blood Cell Surface Antigen by Thermal Lens Microscopy,” Analytical Biochemistry, Vol. 283, No. 1, 2000, pp. 27-32. doi:10.1006/abio.2000.4614
- D. Lapotko and V. Zharov, “Photothermal Images of Live Cells in Prescence of a Drug,” Journal of Biomedical Optics, Vol. 7, No. 3, 2002, pp. 425-434. doi:10.1117/1.1481902
- S. W. Hell, “Increasing the Resolution of Far-Field Fluorescence Microscopy by Point-Spread-Function Engineering,” In: J. Lakowicz, Ed., Topics in Fluorescence Spectroscopy. Vol. 2: Nonlinear and Two-Photon-Induced Fluorescence, Plenum Press, New York, 1997.
- M. Dyba and S. W. Hell, “Focal Spots of Size λ/23 Open up Far-Field Fluorescence Microscopy at 33 nm Axial Resolution,” Physical Review Letters, Vol. 88, No. 16, 2002, Article ID: 163901. doi:10.1103/PhysRevLett.88.163901
- H. E. Keller, “Objective Lenses for Confocal Microscopy,” In: J. B. Pawley, Ed., Handbook of Biological Confocal Microscopy, 3rd Edition, Springer, New York, 2006. doi:10.1007/978-0-387-45524-2_7
- J. Conrad, “Depth of Field in Depth,” 2011. www.largeformatphotography.info/articles/DoFinDepth.pdf
- L. C. Martin, “Technical Optics, Vol. II,” Pitman Publishing Corporation, London, 1950.
- M. Kaatz, A. Sturm, P. Elsner, K. König, R. Bückle and M. J. Koehler, “Depth-Resolved Measurement of the Dermal Matrix Composition by Multiphoton Laser Tomography,” Skin Research and Technology, Vol. 16, No. 2, 2010, pp. 131-136.
- M. Levoy, R. Ng, A. Adams, M. Footer and M. Horowitz, “Light Field Microscopy,” ACM Transactions on Graphics, Vol. 25, No. 3, 2006, pp. 924-934. doi:10.1145/1141911.1141976
- M. Levoy, Z. Zhang and I. McDowall, “Recording and Controlling the 4D Light Field in a Microscope Using Microlens Arrays,” Journal of Microscopy, Vol. 235, No. 2, 2009, pp. 144-162. doi:10.1111/j.1365-2818.2009.03195.x
- J. F. James, “A Student’s Guide to Fourier Transforms with Applications in Physics and Engineering,” Cambridge University Press, Cambridge, 1995.
- N. Kim, C. M. Dempsey, C.-J. Kuan, J. Zoval, E. O’Rourke, G. Ruvkun, M. J. Madou and J. Y. Sze, “Gravity Force Transduced by the MEC-4/MEC-10 DEG/ENaC Channel Modulates DAF-16/FoxO Activity in Caenorhabditis elegans,” Genetics, Vol. 177, No. 2, 2007, pp. 835-845. doi:10.1534/genetics.107.076901
NOTES
*Corresponding author.