Journal of Power and Energy Engineering
Vol.05 No.12(2017), Article ID:81356,9 pages
10.4236/jpee.2017.512012
Efficiency of Energy Utilisation in a Nigeria Sausage Producing Factory
Mufutau Adekojo Waheed1, Peter Olaitan Aiyedun1, Wasiu Oyediran Adedeji2*, Adekunle Adedapo Obisanya3, Semiu Taiwo Amosun2, Adeniyi Oluwole Adesina2
1Department of Mechanical Engineering, Federal University of Technology, Abeokuta, Nigeria
2Department of Mechanical Engineering, Yaba College of Technology, Lagos, Nigeria
3Department of Chemical Engineering, Yaba College of Technology, Lagos, Nigeria

Copyright © 2017 by authors and Scientific Research Publishing Inc.
This work is licensed under the Creative Commons Attribution International License (CC BY 4.0).
http://creativecommons.org/licenses/by/4.0/


Received: July 11, 2017; Accepted: December 25, 2017; Published: December 28, 2017
ABSTRACT
In this study, a five-year (2010-2014) production and energy utilisation data in a sausage producing company in Nigeria was analysed for energy consumption, energy intensity, energy productivity, cost of energy per unit product and Normalized Performance Indicator (NPI). The average annual energy consumption was 15,853.22 GJ. The energy consumption mix was 27.66% PHCN main, 32.06% diesel generators and 40.28% oven gas. Main electricity supply from utility company contributed to 25.04% of the total energy cost while diesel was 44.24% and oven gas was 30.71% of the total cost. The average production output from the factory was 595,700 tonnes and the average cost of energy input was 6.71 kobo/kg for the five-year period. The values of cost of energy input per unit product showed a decreasing trend for the five years. The energy intensity also increased through the study years with an average of 1.67 GJ/m2 while the energy productivity decreased throughout the years with an average of 28.3 kJ/kg. The Normalized Performance Indicator (NPI) values calculated for the five years showed steady increment with an average of 1.61 GJ/m2. This indicated a “very poor” range which implies an excessive energy usage, immediate action should be taken to investigate and remedy this.
Keywords:
Energy Utilisation, Energy Intensity, Energy Productivity, Cost of Energy Input, Normalized Performance Indicator

1. Introduction
The driving force of any industrial and economic sector of a country depends on energy security. Energy security and environmental constraints are some of the main challenges of industrialisation in this 21st century. Improving the energy efficiency of processes and systems has been identified as one of the ways of reducing emissions of health-damaging, climate-altering air pollutants [1] . In attaining sustainable development, increasing the energy efficiency of processes, utilizing sustainable energy resources that are cost-efficient, reliable, and environmentally friendly plays an important role.
Energy efficiency has become the key driver of sustainable development in many economies in the world. It helps companies to boost their profits, lower cost and cut carbon emission, improve performance from a lower level of energy use [2] . The efficiency of energy utilization in a manufacturing industry requires the knowledge of energy performance of machines, plants and all the parameters directly associated with the production process [3] . Also, the cost of energy is of great interest to policy makers and it is closely monitored to reduce the operating and maintenance costs to the minimum [4] [5] .
Energy utilisation of different industrial sector in Nigeria has been analysed in recent years [6] - [11] However, not much activity is evident in the area of energy utilization in a sausage making food industry. This paper assesses efficiency of energy utilisation in sausage production line.
The Production Process of Sausage
The sausage is produced by mixing the flour with water, sugar, salt and spices together in the mixing machine for about 30 mins to form a dough. The dough is passed through a conveyor into the rondo machine. It has different sections which start with the extruder that compresses the dough to the required normal size (90 g) before it is passed through the make-up table where it sliced into the specific size. It is then passed into another section where the mixed meat is poured into the sliced dough and passed to the folding section where the dough is folded. The folded dough is moved to the guillotine where it is now cut into equal length and to the milk wash section. Here, the milk is poured on the sausage, pass to the conveyor that carries it to the discharge unit and those set of sausage enters the tray for baking.
The already prepared sausage is taken into the oven for baking and is allowed to bake at about 180˚C. The baked Sausage is moved to the cooling chamber for it to cool to a temperature between (−3˚C to −5˚C). The baked Sausage is sent to packaging section for wrapping, batching and storage. The flow sheet of the production process is shown in Figure 1.
2. Methodology
The sausage manufacturing company has two 1500 KVA and one 1300 KVA

Figure 1. Sausage production flow diagram.
electricity generating set, 40 ovens and three 200 tons chiller for HVAC system. A water treatment plant of 10,000 litres/min is also available to cater for manufacturing of the snacks. In order to examine the energy efficiency of the company, a five-year data (2010-2014) was collected, the data collected cover the following:
1) Energy value (computed from volume) of fuel consumed for running the generators (electricity) on monthly basis (GJ).
2) Naira value of fuel consumed for running the generator (electricity on monthly basis).
3) Electricity bill (PHCN)―KWh/₦ values
4) Production (output) values in Naira on monthly basis. This is collected on the basis that all energy consumed is computed as part of product cost. The energy productivity is therefore seen as partial productivity of the company's overall productivity.
5) Total floor area.
The electricity generators are used as alternative source of electricity when there is power outage from the national grid (PHCN) and so running hours varies accordingly. The running hours is about 52% of total. To access the energy performance of the company, parameters such as Energy intensity, Energy productivity and Normalized performance indicator (NPI) were estimated.
Total Energy Consumed
This is the energy consumed using electricity (kWh), oven fuel (GJ) and generators fuel (GJ). To estimate the total cost of energy, 1 KWh of energy produced from diesel generator is equivalent to ₦71.7 and ₦23 is equivalent to 1 KWh of energy utilised from electrical mains (PHCN). This measure is important in view of the unstable price of fuel, expected adjustments to production and energy tariffs and the expected adjustment to production processes to ameliorate the impact of such instability. The objective is minimizing the cost of input into kg of product [12] .
Intensity of Energy
This is the ratio of total energy consumed per year in GJ to the total factory floor area in square meters [10] .
where TE = total energy consumed and FA = total floor area
Energy Productivity
This is the total energy consumed per kg of production
Cost of Energy Input into a Unit Production
This is the cost of energy to produce a unit product [3] [10] and is represented mathematically by;
CEI (₦/kg) =
Normalized Performance Indicator (NPI)
The Normalised Performance Indicator (NPI) is used to assess the energy performance of a building [9] . The NPI is estimated by
・ Computing the total energy from oven gas, electricity (PHCN and Diesel generator)
・ Correct for space heating by multiplying with space heating factor. In Nigeria, the weather is reasonably favourable, there is no space heating.
・ Adjust the space heating energy to account for weather. Since there is no space heating, the weather correction is also neglected [7] .
・ Adjust the space heating energy to account for exposure. This is also neglected in this study.
・ Find the normalised annual energy use. This equals annual non-space heating plus adjusted space heating energy. For this study, this equals the total energy
・ Correct for hours of use of building.
. The standard working hour (dou-
ble shift) is 16 hrs in 300 days = 4800 hrs/yr [9] . The estimated working hour for the factory is 16 hrs/day, 6 days/week = 4992 hrs/yr
・ Find the floor area
Finally, the NPI estimation is computed by:
The total floor area of the factory is 9478 m2.
The estimated NPI value obtained is compared to the standard NPI values by Chartered Institution of Building Services Engineers CIBSE Energy code (part 4) [13] presented in Table 1.
The interpretation of performance classification value in Table 1 is explained in Table 2.

Table 1. Performance indicator for some common building types.
Note: Single shift occupancy implies normal daily use of about 8 - 10 hours including allowances for after-hours clearing; Source: CIBSE Building Energy Code, Part 4 (1982) [13] .
Table 2. Energy performance classification.
Source: CIBSE Building Energy Code, Part 4 (1982).
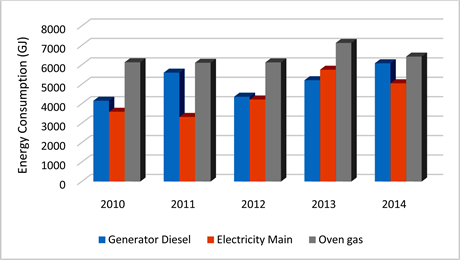
Figure 2. Energy consumption mix.
3. Results and Discussion
Energy Consumption
The energy consumption in the food industry in shown in Figure 2. The average annual energy consumption for the five-year period was 15,853.216 GJ with the highest energy consumption in 2013.
The average energy consumption was made up of 59.76% Electricity (PHCN main and Diesel Generators) and 40.24% Oven gas. Energy supplied by the generator was closely related to power outage since the generators serve as standby energy providers.
Energy Intensity
The energy intensity for a period of 5 years was estimated and the result is shown in Figure 3. The intensity varies from 1.46 to 1.91 GJ/m2 with an average of 1.67 GJ/m2.
The highest energy intensity was in 2013 which was as a result of high energy consumption in that year.
Energy Productivity
The amount of energy consume per cost of production for the years under study is shown in Figure 4. The annual average energy productivities for year

Figure 3. Energy Intensity for the 5 years’ period (2010-2014).
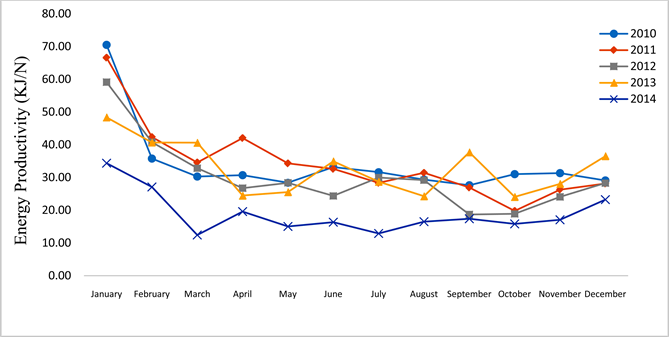
Figure 4. Energy productivity for period of 5 years (2010-2014).
2010, 2011, 2012, 2013 and 2014 are 32.30 KJ/kg, 32.03 KJ/kg, 27.75 KJ/kg, 31.37 KJ/kg, 18.05 KJ/kg respectively with an average of 28.30 KJ/kg. Figure 3 shows that energy productivity was usually high in January and fluctuate throughout the year. The higher energy productivity in January could be due to lower production level usually experienced in January which might be due to the beginning of new production year.
Cost of Energy
The cost of energy in the 5 years period is shown in Figure 5. The total cost of energy and production output shows an increasing trend over the period. Electricity supply from PHCN contributed to 25.04%, diesel 44.24% and oven gas is 30.71% of the total energy cost.
The total energy cost was calculated for the different energy sources (PHCN Main, Diesel Generator and Oven gas) based on their respective rates and summed up. As evident in Figure 5, the total production output variation depends but on the electricity and diesel usage but not on oven gas. This scenario could only have been due to underutilisation of installed capacity of the 40 ovens.
Energy Parameters
The summary of energy parameters is shown in Table 3. The Normalized Performance Indicator (NPI) values calculated for the five years gave an average of 1.61 GJ/m2. This indicated a “very poor” range (from Table 1, for NPI values > 1.2) which implied an excessive energy usage, immediate action should be taken to investigate and remedy this.
The values of Cost of Energy input showed a decreasing trend for the five years. This was as a result of the decrease in energy productivity over the years which also resulted from better production output. The average Cost of Energy input/Product was 6.71 kobo/kg for the five-year period.

Figure 5. Energy cost for the period of 5 years (2010-2014).
Table 3. Summary of energy parameters for the 5 years’ study.
4. Conclusions
The following conclusion can be made based on the five-year period energy utilisation evaluated for a sausage manufacturing industry in Lagos, Nigeria:
1) For a treated floor area of 9478 m2 over a five-year period (2010-2014), average annual energy consumption was 15853.216 GJ. The energy consumption mix was 59.76% electricity (PHCN main and diesel generators) and 40.24% oven gas.
2) In terms of energy cost, electricity supply from PHCN contributed to 25.04% of the total energy cost, diesel 44.24% and oven gas 30.71%.
3) The production output from the factory increased throughout the year. The average annual production output for the five years studied was 0.5957 Mt.
4) The Normalized Performance Indicator (NPI) values calculated for the five years showed steady increment with an average of 1.61 GJ/m2. This indicated a “very poor” range which implies an excessive energy usage, immediate action should be taken to investigate and remedy.
5) The energy intensity also increased through the study years with an average of 1.67 GJ/m2 while the energy productivity decreases throughout the years with an average of 28.3 KJ/kg.
5. Recommendations
It is very important to develop a solid program to plan, evaluate, and implement various energy saving ideas. The implementation plan should be looked into in the following areas.
1) Energy conservation should be taken serious, the plant, machineries etc when not in use should be shut down
2) The number of oven fired per time should be proportional to the level of production.
3) More capital spending on the energy consumption conservative to improve the conservation of energy without conflict with economic pre-set goals of the company.
4) Maintenance control chart should be engaged to improve the energy performance of the factory and rating.
5) Energy monitoring equipment should be used in the industry to detect and have proper record of wastages.
6) The company should support the project on energy efficiency improvements, thereby, involve in feasibility studies for energy innovation and efficiency practices.
7) The management should constitute a monitoring team to manage the energy conservation process backed up with adequate incentives to achieve effective functioning of the team
8) Most of the energy consuming equipment should have time clock facilities to turn them off when not in use.
9) Re-using of energy rather than allowing it to escape will help in saving energy.
10) An overseeing body must be constituted by the company to manage the energy conservation process and this must be back up with appropriate incentives to achieve a genuine record and seriousness of the people.
Acknowledgements
Oludegun M.O. is hereby acknowledged as a research assistant that helped in data collection.
Cite this paper
Waheed, M.A., Aiyedun, P.O., Adedeji, W.O., Obisanya, A.A., Amosun, S.T. and Adesina, A.O. (2017) Efficiency of Energy Utilisation in a Nigeria Sausage Producing Factory. Journal of Power and Energy Engineering, 5, 100- 108. https://doi.org/10.4236/jpee.2017.512012
References
- 1. IPCC (2014) Climate Change 2014: Synthesis Report. In: Pachauri, R.K. and Meyer, L.A., Eds., Core Writing Team, Contribution of Working Groups I, II and III to the Fifth Assessment Report of the Intergovernmental Panel on Climate Change, IPCC, Geneva, 151 p.
- 2. Garba, B. (1999) Mechanisms and Biochemistry of Methanogenesis in Biogas Production. Nigerian Journal of Renewable Energy, 7, 12-16.
- 3. Aiyedun, P.O., Adeyemi, O.A. and Bolaji, B.O. (2008) Energy Efficiency of a Manufac-turing Industry?: A Case Study of Nigeria Eagle Flour. ASSET, 7, 91-103.
- 4. Wang, L.J. (2009) Energy Efficiency and Management in Food Processing Facilities. CRC Press & Francis Group, LEG, Boca Raton.
- 5. Smith, T.E. (1999) Industrial Energy Management for Cost Reduction. Ann Arbor Science Publishers, Inc, Ann Arbor, Michigan.
- 6. Aderemi, A.O., Ilori, M.O., Aderemi, H.O. and Akinbami, J.F.K. (2009) Assessment of Electrical Energy Use Efficiency in Nigeria Food Industry. African Journal of Food Science, 3, 206-216. http://www.academicjournals.org/ajfs
- 7. Aiyedun, P.O. and Onakoya, B.A. (2000). Energy Efficiency in a Private Sector—A. Paper Presented at the National Conference of Nigeria Institute of Industrial Engineers, Ibadan, 9th-11th November 2000.
- 8. Goshwe, N.Y. and Kureve, T.D. (2012) Industrial Energy Management Opportunities in Nigeria?: A Case Study of Energy Audit of VIK Industries Nigeria, Ltd. The Pacific Journal of Science and Technology, 13, 152-158.
- 9. Jekayinfa, S.O. (2006) Energy Consumption Pattern of Selected Mechanized Farms in Southwestern Nigeria. International Commission of Agricultural Engineering (CIGR), VIII, 1-11.
- 10. Noah, O.O., Obanor, A.I. and Audu, M.L. (2012) Energy Audit of a Brewery—A Case Study of Vitamalt Nig. Plc, Agbara. Energy and Power Engineeering, 4, 137-143. https://doi.org/10.4236/epe.2012.43019
- 11. Olayinka, S. and Oladele, A.T. (2013) Energy Audit of Manufacturing and Processing Industries in Nigeria?: A Case Study of Food Processing Industry and Distillation & Bottling Company. American Journal of Energy Research, 1, 36-44. https://doi.org/10.12691/ajer-1-3-1
- 12. Fashade, O.A (1997) Science Data and General Information for Engineering Studies and Professionals. Fast Corp Publishers, Lagos.
- 13. CIBSE Building Energy Code (1982) Measurement of Energy Consumption and Comparison with Target for Existing Building and Services, Part 4.