Journal of Materials Science and Chemical Engineering
Vol.05 No.12(2017), Article ID:81360,16 pages
10.4236/msce.2017.512006
From Hydration to Strength Properties of Fly Ash Based Mortar
Massoud Sofi, Elisa Lumantarna, Zhiyuan Zhou, Rackel San Nicolas, Priyan Mendis
Department of Infrastructure Engineering, Melbourne University, Melbourne, Australia

Copyright © 2017 by authors and Scientific Research Publishing Inc.
This work is licensed under the Creative Commons Attribution International License (CC BY 4.0).
http://creativecommons.org/licenses/by/4.0/


Received: November 24, 2017; Accepted: December 25, 2017; Published: December 28, 2017
ABSTRACT
Fly ash (FA) is important alternative or supplement to cement to reduce the environmental impact of concrete industry. However, early age strength development of FA is a concern due to the slower reaction rate of FA compared to cement. This paper examines the early age hydration properties of cement paste containing typical Australian FA and establishes correlations between the degree of hydration and the early-age strength development properties of mortar mixes. All mixes have the same mixture proportion of water to binder (w:b) ratio. FA sourced from different power plants are used for the tests. Cement replacement levels of 0%, 10%, 30% and 40% by mass are considered. The degree of hydration was established from the heat production of the mixes by using isothermal calorimetry. The hydration properties were characterized by hydration curve parameters obtained from curve fitting. The results show that both hydration rate and strength of the binder materials (FA and cement) were reduced with higher replacement levels of FA contributing to a reduced hydration rate at early ages. Linear relationship could be obtained between degree of hydration and strength at early ages for all the fly ash binders.
Keywords:
Fly Ash, Early Age Strength, Isothermal Calorimetry, Degree of Hydration

1. Introduction
Production of concrete is a large contributor to the increasing levels of carbon dioxide emissions in the atmosphere. According to the United States Environmental Protection Agency, the cement industry contributes about 3.8% of all carbon dioxide emissions on a global scale, where the production of 1000 kg of Portland cement emits approximately 900 to 1100 kg of carbon dioxide [1] . Incorporation of supplementary cementitious materials (SCMs) as part replacement of cement is considered effective in reducing the use of Portland cement [2] . Fly ash (FA) is one of the most commonly used SCMs. It is also a by-product of the combustion of coal in power plants [2] . FA is typically composed of silicon and aluminum oxides. The chemical composition of FA however varies greatly between power plants due to the processing method and type of coal that is burnt [3] . Currently, the replacement percentage of cement by FA for typical application is approximately 15% - 20% by the mass of total binder (including Portland cement and SCMs) [4] . The use of higher FA replacement levels in concrete is mainly limited because of the reduced rate of reaction resulting in lower early age concrete strength development. This problem can be more prominent for e.g. in building applications such as removal of formwork or post-tensioning of elements which require early age strength to a specified level for prestressing [5] . Replacement of a portion of cement by FA is equally known to reduce the later age strength properties.
The early age strength development of concrete (i.e., 1 - 7 days after casting concrete) is closely associated with the hydration of the binder since hardening is understood to take place as a result of an exothermic chemical reaction commonly known as hydration reaction [6] . Therefore, numerous studies have been conducted to investigate the strength development of concrete containing FA to facilitate wider use of this environmentally-friendly material in the concrete industry [5] [7] . To improve the early age strength development properties and uptake of FA based concrete, it is important to know the reactivity of the binder material used in the concrete. The variability in the chemical composition of both cement and FA makes this difficult. Even then, lately use of chemical additives to hasten the chemical reaction of the binder is a proposed solution [8] .
Modelling the hydration of FA and cement combined is more complex compared with that of cement alone FA is known to react at a lower rate when compared to cement [9] . Isothermal calorimetry test is commonly used to directly measure the heat production rate which is proportional to the rate of reaction [10] . The advantage of isothermal calorimetry is its ability for monitoring multiple cement samples continuously from the onset of reaction [10] . However, it is only suitable for the investigation of cement hydration at early phase where the heat rate is high enough for the calorimetry to follow.
Previous studies also show efforts made in investigating the correlation between hydration and strength development for FA based concrete [11] . Bentz et al. [12] experimented on a variety of mortar mixtures demonstrated that the compressive strength and cumulative heat of hydration have a linear relationship. Tanesi and Ardani [13] also indicated that the heat of hydration evaluated by isothermal calorimetry turns out to have good correlation with compressive strength at early ages for FA mortar specimens. Statically a valid correlation between degree of hydration and compressive strength of normal and blended cement FA are equally found by Shafiq [14] .
Given that heat production provides a good indication of the strength development [12] [13] [14] , it can be used as a tool to predict the strength development of FA based concrete. It should suffice to rely on the w:b ratio of the paste sample to experimentally determine the degree of hydration of concrete. The method will be handy and should provide an indication of the effect of the variability in composition of the binder materials. There are currently no literature reporting on the correlation between the hydration of a binder including FA and the strength development properties of the corresponding mortar and concrete having similar w:b proportions. Aggregates are normally thermally stable particularly at low temperatures of up to 100˚C [15] and the material suppliers can easily establish the thermo-physical properties for the aggregates they use [16] .
This paper reports the analysis of hydration of OPC and early age strength of corresponding mortars incorporating FA sourced from various locations in Australia namely Gladstone, Bayswater and Port Augusta. The broader aim of the research is to generalize the evaluation of hydration of the binder made with different SCMs and relate those to strength development properties of concrete. This paper presents interim results of the results. Compressive strength test was conducted to investigate the correlation between the hydration of binder and the early age strength of corresponding mortars.
2. Experimental Methods
2.1. Materials
Materials used for analysis of hydration of the binder and the strength properties of the corresponding mortar include cement and the types of FA sourced from Gladstone, Bayswater and Port Augusta. According to ASTM C618 [17] , all the tree types of FA used in this experiment are Class F FA (SiO2 + Al2O3 + Fe2O3 ≥ 70% and CaO < 10%). The mineral composition of the Portland cement used is detailed in Table 1. The chemical compositions and properties of the three FA used are provided in Table 2. The compositions are based on datasheets from Fly Ash Australia and Cement Australia with due acknowledgements [18] [19] . The mix design of the paste for isothermal calorimetry is in Table 3.

Table 1. Mineral composition of portland cement.
Table 2. Mineral composition of FA.
Table 3. Paste composition.
It is noted that for the evaluation of the compressive strength test, mortar pastes are made with the addition of sand to the paste. The particle size distribution of the sand is plotted in Figure 1. The details of the mortar mix composition are reported in Section 2.5.
2.2. Isothermal Calorimetry Test
TAM Air 8-Channel Standard Volume Calorimeter was used to measure the heat of hydration at 23˚C which was the room temperature. The paste was made with a w:b ratio of 0.44 and no additional aggregate referring to Table 3.
Prior to mixing the paste, the cement, FA and water were all kept at the room temperature. These preparations were done in order to achieve a constant room temperature of 23˚C for all materials. Wooden stick was used to mix the samples manually. The samples were injected into 20 ml glass ampoules which were then placed in the calorimeter for 72 hours. The recorded data from isothermal calorimetry are heat flow and cumulative heat over time. It is worth noting that the data for each sample should be normalised with respect to the total mass of its cementitious material so that different samples can be compared with each other.
2.3. Determination of the Degree of Hydration
It has been found that the total heat released during hydration of Portland cement is determined by the composition of cementitious materials with each of the cement constituents having a unique heat of hydration [20] [21] . This can be quantified as presented in Equation (1). The effect of supplementary cementitious material like slag or FA on the total heat of hydration of cement can be taken into account by using Equation (2) which is proposed based on several modelling results in previous literature [20] .

Figure 1. Particle size distribution for silica sand.
(1)
(2)
where:
Hcem = the total heat of cement hydration (J/g)
pi = the weight ratio of i-th compound in terms of total cement content
Hu = the total heat of hydration of cementitious materials at 100% hydration (J/g)
pcem, pSLAG, pFA are the weight ratios in terms of total cementitious content for cement, GGBF slag and FA respectively.
hFA = the heat of hydration of FA (taken as 1800pFACaO J/g, where, pFACaO is the ratio of FA CaO weight to the total weight of the FA [22] )
The degree of hydration at a certain time can be calculated by the heat of hydration at time (t) divided by the ultimate heat of hydration generated from the cementitious reaction [23] , as shown in Equation (3).
The degree of hydration at a certain time can be calculated by the heat of hydration at time t divided by the ultimate heat of hydration (Hu) generated from the cementitious reaction [23] , as shown in Equation (3).
(3)
where:
H(t) is the accumulated heat of hydration of total cementitious material at time t which is determined by isothermal calorimetry in this experiment.
2.4. Determination of the Hydration Curve Parameters
The degree of hydration determined from isothermal calorimetry test could be represented by a best-fit formula as shown in Equation (4) which is similar to strength-age formulation initially proposed by Freiesleben Hansen and Pedersen (1985) [24] :
(4)
where:
is the degree of hydration at equivalent age
is the equivalent age at the reference temperature 21.1˚C (hrs)
is the hydration time parameter (hrs) which indicate the delay of hydration (larger values of represent a greater delay in hydration)
is the hydration shape parameter, representing the slope of major linear part of the hydration curve. Larger values of represent higher hydration rates
is the ultimate degree of hydration
Once the degree of hydration development of the mixes over time was determined from the isothermal calorimetry tests, the curve fitting procedure was performed to obtain the hydration parameters , and . These hydration parameters could be instrumental in characterizing the hydration properties of pastes regarding the ultimate degree of hydration, delay of hydration and hydration rate.
2.5. Compressive Strength Tests
The compressive strength tests were conducted to validate the hydration properties obtained from isothermal calorimetry tests. The composition of the mortar mixtures used for the strength testing is shown in Table 4.
Compressive strength tests were undertaken on 500 mm mortar cubes for all samples. The making and curing of samples was conducted in accordance with AS 1012.8.1:2014 [25] . The samples were cured in lime saturated water baths at room temperature about 24 hours after initial pouring. Tests were undertaken at 3, 7 and 28 days of age with two samples being tested for each stage to account for variations. Three specimens were tested for each mix. The test results are presented in Section 3.
3. Results and Discussions
3.1. Heat Evolution Measurement at Early Ages
The isothermal calorimetry results of heat generation rates for all the ten samples are shown in Figure 2. It demonstrated a fairly typical heat profile of
Table 4. Composition of the mortar mixes.
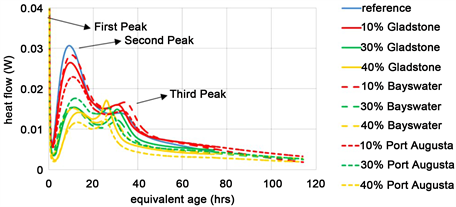
Figure 2. Isothermal calorimetry results presented in heat flow.
isothermal calorimetry with three peaks. The first peak occurs early and is associated with the dissolution of cement particles largely involving C3A (Tri-calcium aluminate, 3CaO∙Al2O3) in the system [22] [26] . The second peak is governed by the hydration of C3S which triggers the setting of cement [13] [26] . Referring to Figure 2, the reference sample only containing Portland cement has the greatest value of the second peak and it is the first one to reach its second peak among all the samples. It is also shown that the addition of FA reduces the heat values and delays the occurrence of the second peak. This indicates that the setting of cement can be retarded by the incorporation of FA.
The occurring of the third peak features a renewal reaction of C3A with the depletion of gypsum. From the heat profile (Figure 2), samples with higher FA content appear to have larger third peak compared to their own second peak. For samples containing 30% and 40% FA, the third peaks appear to be of similar magnitude or greater than the second peaks. On the contrary, reference samples and samples with low FA replacements show a relatively much smaller third peak compared with their previous peak of heat. Cement blended with FA results in lower peak and less variation of heat evolution compared to Portland cement. Smoother heat flow profile can be achieved by increasing the FA replacement level up to 40%.
3.2. Degree of Hydration
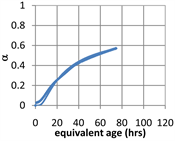
The evolution of degree of hydration with time for all the samples calculated from isothermal calorimetry results are presented in Figure 3. It can be seen that as the incorporated FA percentage is increased, the degree of hydration for all types of FA cement generally become lower during the initial three days. This is expected as mixes containing FA have slower reaction rates compared to Portland cement paste, due to the delayed reaction of FA in cement. The reason for the delay is that the breakdown of glass material of FA occurs only when cement hydration has taken place for a while to produce enough Ca(OH)2 and reach a pH about 13.2 [26] .
For class F FA, it has been found that this can take up to one week or more [10] .
 (a)
(a) (b)
(b) (c)
(c)
Figure 3. Comparison of degree of hydration between different FA replacement levels.
Therefore, the FA could be considered to be dormant filler during the isothermal calorimetry test lasting for 72 hours (3 days).
The degree of hydration at the age of 3 days is presented in Table 5 with the released heat from calorimetry results and ultimate heat of hydration. It can be seen that despite the use of fly ash sourced from different places, pastes containing the same FA dosage could have similar degree of hydration in general. It is not surprising since class F FA is inert at early ages of 3 days. Thus the small difference in chemical compositions for FA from different power plants would not
Table 5. Thermal properties at 3 days age.
affect the degree of hydration at very early age. However, small variances observed are due to some inevitable but acceptable experimental errors in calorimetry testing. Some recent researches have proposed methods of determining the degree of hydration of blended cement like using thermogravimetric analysis in [1] . It could also be developed for FA binders as further validation for the methods of determining degree of hydration using isothermal calorimetry.
3.3. Hydration Curve Parameters
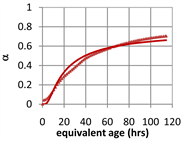
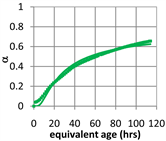
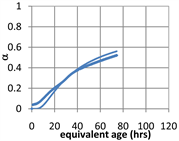
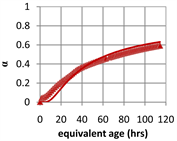
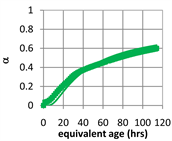
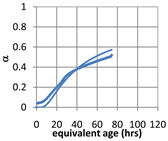
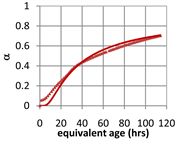
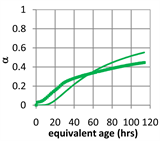
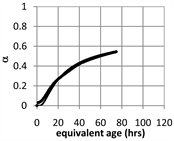
The comparison between degree of hydration curves from calorimetry results and best fitted theoretical hydration curves are presented in Figure 4. The thin lines represent the theoretical predictions. Hydration parameters αu, τ, β were calculated from curve fitting and are listed in Table 6. The ultimate degree of hydration αu is highly affected by the w/c ratio [27] [28] and theoretically could be the same for the pastes with the same mix design in infinite time [29] . In this experimental program, the w:b ratio is kept constant and the variables are FA types and their dosage. It can be seen from Table 5 that αu increases with the incorporation of FA. Higher FA content gives a higher ultimate degree of hydration. Similar results were obtained by Schindler and Folliard who obtained hydration parameters from semi-adiabatic tests [22] . This is probably attributed to the pozzolanic reaction of FA at later age contributing to denser hydration products [30] . However, Xu et al. found decreased αu with the increase of FA percentage [29] .
As expected, the hydration time parameter τ is significantly increased by the adding of FA. Higher cement replacement ratio by FA gives rise to a higher τ which means a larger delay of hydration. The hydration shape parameter β generally decreases with the incorporation of FA compared to Portland cement, but there is not a strong correlation between β and the replacement level of FA.
It is worth mentioning that there is some limitation for the isothermal calorimetry test. The isothermal calorimetry could not continue until the end of hydration and thus could affect the curve fitting results. This may lead to some degree of inaccuracy of the determined hydration curve parameters.
 (a)
(a)
 (b)
(b)
 (c)
(c)
 (d)
(d)
 (e)
(e)
 (f)
(f)
 (g)
(g)
 (h)
(h)
 (i)
(i)
 (j)
(j)
Figure 4. Comparison between the experiment and curve fit. (a) 10% Gladstone; (b) 10% Bayswater; (c) 10% Port Augusta; (d) 30% Gladstone; (e) 30% Bayswater; (f) 30% Port Augusta; (g) 40% Gladstone; (h) 40% Bayswater; (i) 40% Port Augusta; (j) Reference.
Table 6. Mineral composition of Portland cement.
3.4. Compressive Strength
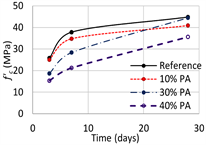
The strength development of the mortar mixes for all samples which were tested at the age of 3, 7 and 28 days is presented in Figure 5. The strength development for all samples appears to be consistent with strength increasing quicker from 3 to 7 day and slower from 7 to 28 days. However, the increase of FA percentage flattens out the strength development curves with less gradient change, meaning slower strength development especially at early age (3 to 7 days). Additionally, the increase of fly ash content decreases the compressive strength for all the samples at early age from 3 to 7 days.
It is worth noting that when tested at 28 days, some samples with larger amount of FA shows higher compressive strength compared with those with less FA. It can be seen that the mortar paste containing 10% Gladstone FA has a compressive strength slightly exceeding the strength of OPC mortar at 28 days. The strength of mortar with 30% FA is higher than that of mortar with 10% FA for both Port Augusta FA samples and Bayswater FA samples at 28 days. This beneficial effect of FA on the mortar strength could happen due to the pozzolanic reaction of FA as well as the unreacted FA particles acting as “micro-aggregates” which improve the density of paste according to the reference [26] . Other researchers have also indicated that the improvement of cement strength by the use of FA can be more prominent in the long term but does not extend for cement with FA content beyond 20% to 30% [26] .
Figure 6 is provided to present a clearer comparison of the strength development of mortar with different type of FA. The three types of FA mortars show similar compressive strength (less than 10 MPa difference) at any point with the same FA content and at the same age, meaning that they demonstrate similar early age strength development. This is not surprising as the OPC still dominates the blended systems during early age [9] and considering that all of the FAs used are Class F. The error bars in the figure shows the variation of strength for a certain paste. The variance could not be avoided even though the same mix design and casting process is followed. It is because each sample could be
 (a)
(a)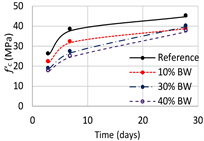 (b)
(b)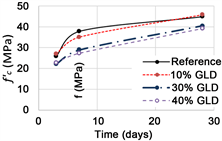 (c)
(c)
Figure 5. Evolution of compressive strength. (a) Port Augusta FA; (b) Baywswater FA; (c) Gladstone FA.

Figure 6. Comparison of compressive strength for different types of fly ash at different replacement levels.
unique in density distribution and thus result in different strength distribution compared to another sample with the same mixture compositions. However, the error bars here in Figure 6 indicates that the variation is within an acceptable range.
3.5. Relation between Degree of Hydration and Early Age Strength
Figure 7 illustrates the relation between compressive strength of mortar samples and degree of hydration of cement samples. The mortar samples and the cement samples are made with the same w:b ratio and the same cementitious
 (a)
(a)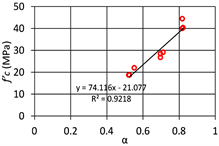 (b)
(b)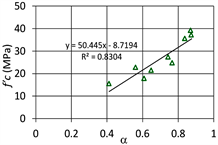 (c)
(c)
Figure 7. Relationship between f’c (mortar) and α (cement paste). (a) 10% Replacement; (b) 30% Replacement; (c) 40% Replacement.
proportions (ratio between cement and FA). The only difference between the mortar and the cement samples is that the mortar contains sand which is not included in cement. It can be seen from Figure 7 that good correlations are obtained between degree of hydration of cement paste and compressive strength of mortar for FA replacement level of 10%, 30% and 40%, respectively. It is noted that FA particles are smaller than the cement in size which then can generate a denser matrices and also involve nucleation site for a better reactivity of the cement especially in small quantities, e.g. 10%. Beyond the 10% then the binder is too diluted, e.g. less cement which explain the retardation of the reaction.
Although the linear relations in Figure 7 need to be further verified with tests on mortars with different amount of sand, the results in this experiment show that for a certain mix containing FA, the degree of hydration of cement calculated from isothermal calorimetry test is a good indicator of compressive strength of mortar with the same w:b ratio and cementitious proportions.
As the strength of a cementitious system is gained from the formation of hydration products, it is reasonable to expect a linear correlation between degree of hydration and compressive strength. Although the degree of hydration is calculated based on pure cement and the compressive strength is obtained by testing on samples with sand in this experiment. The assumption is that sand would not participate in the hydration reaction and is present in the system in a chemically dormant in the cementitious system and the particle sizes of sand are not small enough to stimulate cement hydration.
4. Concluding Remarks
This research has made use of three different types of commonly used Australian FA namely Galdstone, Bayswater and Port Augusta to evaluate the early age strength development of FA based concrete. It reported the correlation between degree of hydration of binder and the compressive strength of mortar assuming sand as an inert material. The degree of hydration of cement at early ages (up to 3 days) was investigated by isothermal calorimetry test. The following conclusions can be made from this study:
- The reaction rate of cement hydration decreases with the increase of FA content. The increase in FA replacement level in cement generally decreases the degree of hydration during the initial 3 days.
- The compressive strength of mortar decreases with the increase of FA content at early ages of 3 and 7 days. At 28 days, some mortar with larger amount of FA can show higher compressive strength compared with those control samples.
- Mortars containing Gladstone, Bayswater and Port Augusta FA (All class F FA) respectively demonstrate similar early age strength development.
- The results presented in this paper show that there is linear relationship between the degree of hydration of binder and the compressive strength of corresponding mortars which have the same mixture proportions at early ages.
The paper presents interim results and the research will be extended to include other types of FA (e.g. Class C FA and those sourced from elsewhere).
Acknowledgements
The financial supports from the Australian Research Council’s Discovery Early Career Researcher Grant (DE170100165, DE 2017 R1), Australian Postgraduate Award and The University of Melbourne are acknowledged. The authors duly acknowledge Laura Jukes for her assistance with laboratory tests.
Cite this paper
Sofi, M., Lumantarna, E., Zhou, Z., San Nicolas, R. and Mendis, P. (2017) From Hydration to Strength Properties of Fly Ash Based Mortar. Journal of Materials Science and Chemical Engineering, 5, 63-78. https://doi.org/10.4236/msce.2017.512006
References
- 1. EPA (2010) U.S. Available and Emerging Technologies for Reducing Greenhouse Gas Emissions from the Portland Cement Industry. [Cited 2017 20/04]; Available from:
https://www.epa.gov/sites/production/files/2015-12/documents/cement.pdf - 2. Mamlouk, M.S. and Zaniewski, J.P. (2011) Materials for Civil and Construction Engineers. Prentice Hall, Upper Saddle River, NJ.
- 3. Thomas, M.D.A. (2007) Optimizing the Use of Fly Ash in Concrete. Portland Cement Association, Skokie, IL, Vol. 5420.
- 4. Hemalatha, T. and Ramaswamy, A. (2017) A Review on Fly Ash Characteristics towards Promoting High Volume Utilization in Developing Sustainable Concrete. Journal of Cleaner Production, 147, 546-559.
https://doi.org/10.1016/j.jclepro.2017.01.114 - 5. Sofi, M., Mendis, P.A. and Baweja, D. (2012) Estimating Early-Age In Situ Strength Development of Concrete Slabs. Construction and Building Materials, 29, 659-666.
https://doi.org/10.1016/j.conbuildmat.2011.10.019 - 6. Goto, S. (2009) Hydration of Hydraulic Materials—A Discussion on Heat Liberation and Strength Development. Advances in Cement Research, 21(3), 113-117.
https://doi.org/10.1680/adcr.8.00041 - 7. Mehta, P.K. (2004) High-Performance, High-Volume Fly Ash Concrete for Sustainable Development. In Proceedings of the International Workshop on Sustainable Development and Concrete Technology, Iowa State University, Ames, IA, USA, May 2004, 3-14.
- 8. Bentz, D.P., Zunino, F. and Lootens, D. (2016) Chemical vs. Physical Acceleration of Cement Hydration. Concrete International: Design & Construction, 38(11), 37-44.
- 9. Pane, I. and Hansen, W. (2005) Investigation of Blended Cement Hydration by Isothermal Calorimetry and Thermal Analysis. Cement and Concrete Research, 35(6), 1155-1164.
https://doi.org/10.1016/j.cemconres.2004.10.027 - 10. Center, N.C.P.T. (2011) Isothermal Calorimetry of Cement. [Cited 2017 15/04]; Available from:
http://www.cptechcenter.org/ncc/TTCC-NCC-documents/F2008-F2011/09IsothermalCalorimetry_000.pdf - 11. De Schutter, G. and Taerwe, L. (1996) Degree of Hydration-Based Description of Mechanical Properties of Early Age Concrete. Materials and Structures, 29(6), 335.
https://doi.org/10.1007/BF02486341 - 12. Bentz, D.P., Barrett, T., De la Varga, I. and Weiss, W.J. (2012) Relating Compressive Strength to Heat Release in Mortars. Advances in Civil Engineering Materials, 1, 1-16.
https://doi.org/10.1520/ACEM20120002 - 13. Tanesi, J. and Ardani, A. (2013) Isothermal Calorimetry as a Tool to Evaluate Early-Age Performance of FA Mixtures. Journal of the Transportation Research Board, 2342, 42-53.
https://doi.org/10.3141/2342-06 - 14. Shafiq, N. (2011) Degree of Hydration and Compressive Strength of Conditioned Samples Made of Normal and Blended Cement System. KSCE Journal of Civil Engineering, 15(7), 1253.
https://doi.org/10.1007/s12205-011-1193-x - 15. Khoury, G.A., Grainger, B.N. and Sullivan, P.J. (1985) Transient Thermal Strain of Concrete: Literature Review, Conditions within Specimen and Behaviour of Individual Constituents. Magazine of Concrete Research, 37(132), 131-144.
https://doi.org/10.1680/macr.1985.37.132.131 - 16. Bentz, D.P. and Weiss, W.J. (2011) Internal Curing: A 2010 State-of-the-Art Review. US Department of Commerce, National Institute of Standards and Technology, Gaithersburg, Maryland.
https://doi.org/10.6028/NIST.IR.7765 - 17. ASTM C618-05, American Society of Testing and Materials (2005) Standard Specification for Coal Fly Ash and Raw or Calcined Natural Pozzolan for Use in Concrete. West Conshohocken.
- 18. Limited, C.A.P. (2017) Bulk Products. Fly Ash.
http://www.cementaustralia.com.au/wps/wcm/connect/website/bulk/Bulk-Home/our-products/flyash/ - 19. Australia, F. (2010) Sustainable Solutions for the Construction Industry.
http://www.flyashaustralia.com.au/WhatIsFlyash.aspx - 20. Schindler, A.K. and Folliard, K.J. (2003) Influence of Supplementary Cementing Materials on the Heat of Hydration of Concrete. In Advances in Cement and Concrete IX Conference, Copper Mountain Conference Resort, Colorado, 10-14 August 2003.
- 21. Bogue, R.H. (1947) The Chemistry of Portland Cement. Reinhold Publishing Corporation, New York.
- 22. Schindler, A.K. and Folliard, K.J. (2005) Heat of Hydration Models for Cementitious Materials. ACI Materials Journal, 102, 24-33.
- 23. Kwan, A.K.H., Fung, W.W.S., Chen, J.J. and Ng, P.L. (2011) Heat Generation of Curing Fly Ash Concrete at Different w/cm. ACI Materials Journal, 108(3), 307-315.
- 24. Freiesleben Hansen, P. and Pedersen, E.J. (1985) Curing of Concrete 1, Comité Euro-International du Béton, Switzerland. Structures. Draft DEB—Guide to Durable Concrete Structures.
- 25. Australian Standard (2014) 1012.8.1: Methods of Testing Concrete-Method for Making and Curing Concrete-Compression and Indirect Tensile Test Specimens. Standards Australia, Sydney.
- 26. Neville, A.M. (2011) Properties of Concrete. 5th Edition, Pearson Education Limited.
- 27. Mills, R.H. (1966) Factors Influencing Cessation of Hydration in Water Cured Cement Pastes. Highway Research Board Special Report, 90.
- 28. Taplin, J.H. (1959) A Method for Following the Hydration Reaction in Portland Cement Paste.
- 29. Xu, Q., Hu, J., Ruiz, J.M., Wang, K. and Ge, Z. (2010) Isothermal Calorimetry Tests and Modeling of Cement Hydration Parameters. Thermochimica Acta, 499(1-2), 91-99.
https://doi.org/10.1016/j.tca.2009.11.007 - 30. Deschner, F., Winnefeld, F., Lothenbach, B., Seufert, S., Schwesig, P., Dittrich, S., Goetz-Neunhoeffer, F. and Neubauer, J. (2012) Hydration of Portland Cement with High Replacement by Siliceous Fly Ash. Cement and Concrete Research, 42(10), 1389-1400.
https://doi.org/10.1016/j.cemconres.2012.06.009