Advances in Materials Physics and Chemistry
Vol.2 No.4(2012), Article ID:26013,7 pages DOI:10.4236/ampc.2012.24035
Effect of Concentration on the Optical and Solid State Properties of CoO Thin Films Deposited Using the Aqueous Chemical Growth (ACG) Method
1Department of Science Laboratory Technology, School of Applied Sciences, Rivers State Polytechnic, Bori, Nigeria
2Department of Physics, Faculty of Science, Rivers State University of Science and Technology, Port Harcourt, Nigeria
3Department of Physics and Astronomy, University of Nigeria, Nsukka, Nigeria
4Department of Physics and Astronomy, Western University, Canada
Email: sylvestermammah@yahoo.com, erfopara2002@yahoo.com, fiezema@yahoo.com, sezugwu@uwo.ca
Received August 8, 2012; revised September 10, 2012; accepted September 18, 2012
Keywords: CoO Thin Film; Aqueous Chemical Growth; RBS; XRD; Optical Properties
ABSTRACT
Thin films of Cobalt(II) Oxide were deposited from equimolar concentrations of Cobalt Chloride, and Hexamethylenetetramine on clean glass substrates using the Aqueous Chemical Growth method in order to determine the effect of precursor concentration on their optical and solid state properties. The analytical tools used for the study include, Rutherford Back Scattering (RBS) spectroscopy for elemental analysis and determination of film thickness, X-Ray Difftraction (XRD) for crystallographic structure, a UV-VIS spectrophotometer for optical and other solid state properties and a photomicroscope for photomicrographs. The results indicate that an increase in the concentration of precursor materials makes ACG CoO thin film a better absorber of ultraviolet radiation, a better transmitter of infra-red radiation, a reflector of visible radiation and a material having an increased band gap. The ACG CoO thin film deposited from 0.1 M precursor concentration was found to be a suitable material for the construction of thermographic devices, poultry houses etc. It can also serve as window layer in solar cells among other optoelectronic applications.
1. Introduction
Crystalline cobalt monoxide may appear in any colour between green and red in the visible spectrum and in powder form, it may appear greyish or black [1].
Cobalt monoxide is commonly used in the ceramic and chemical industries as additive (colouring agent) and for the manufacture of Cobalt(II) salts respectively. It has other industrial applications such as in gas and humidity sensors, electrochemical and super capacitors [2-5]. solar cell [6], magnetic nanostructures and magnetic storage systems [7], corrosion and protective coatings, catalyst in hydro cracking process of crude fuel [8].
Cobalt monoxide is antiferromagnetic below 16˚C [9] and has a cubic (rocksalt structure) with a lattice constant of 4.2615 Å [10].
Even though, Cobalt(III) oxide decomposes to Cobalt(II) oxide at 950˚C, it is usually produced in the laboratory through the electrolyzation of a solution of Cobalt(II) chloride or the precipitation of the hydroxide followed by thermal decomposition.
Cobalt monoxide, an odourless and electrochromic material has a bulk direct band gap of about 2.4 eV and a melting point of 2.206 k [1].
Several deposition methods have been used in preparing cobalt monoxide thin films among which are sol-gel dip-coating technique [11], chemical vapour deposition [12], electron beam evaporation [13], spray pyrolysis [14], sputtering [15], γ-irradiation [16], and sonication assisted methods [17].
This paper reports the influence of precursor concentration on the solid state and optical properties of CoO thin films deposited using the Aqueous Chemical Growth method with CoCl2 and C2H12N4 as precursors. This relatively novel method have several advantages over the other methods of depositing CoO thin films such as non toxicity, high purity due to the non requirement of surfactants and or complexing agents, availability of materials, low temperature requirement, etc. [18,19].
A Unico UV-2102PC spectrophotometer was used to obtain the spectral analysis of the optical and solid state properties at room temperature condition.
2. Experimental Procedure
The Aqueous Chemical Growth method already described by Lionel Vayssieres [19] was used in depositing thin films of CoO on clean glass slides from equimolar concentrations of cobalt chloride and hexamethylenetetramine in 80 ml of water.
Both chemicals were manufactured at BDH laboratories, Poole, England. There purity level is at least 99%.
Two samples having different concentrations of the precursors were prepared. This is shown in Table 1.
A laboratory analytical microbalance was used in measuring the appropriate masses of the samples. Each sample was put into a 100 ml pyrex bottle.
Thereafter, 80 ml of distil water was poured into each of the pyrex bottles containing the samples and their contents were mixed using a magnetic stirrer.
The tightly corked pyrex bottles containing the samples were then placed in a DHG-9101 elecrically heated thermostatic Blast Dry Box (SANFA) and the temperature of the oven was adjusted by rotating the temperature indicating knob on the case of the oven in the clockwise direction until the pointer settled on 95˚C.
The thin films of CoO were deposited on the substrates within a period of about ten hours.
We propose the following reaction as having resulted in the crystallization of CoO
 .
.
3. Results and Discussion
The chemical composition of sample 400A was determined using Rutherford Backscattering (RBS) at the Centre for Energy Research and Development, Obafemi Awolowo University, Ile-Ife, Nigeria.
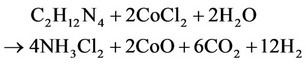
The result is as indicated in Figure 1. As shown in Table 2, the chemical composition of sample 400A is

Table 1. showing the component masses and concentrations in each sample.
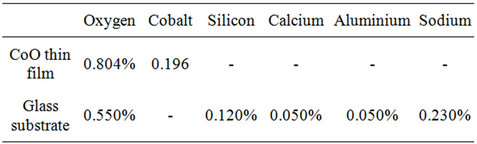
Table 2. Chemical composition of CoO thin film and substrate from RBS analysis.

Figure 1. Showing the chemical composition of sample 400A.
Co (0.196%) and O (0.804%) and that of the glass substrate is O (0.550%), Si (0.120%), Ca (0.050%), Al (0.050%) and Na (0.230%). The film thickness is given as 110.00 nm.
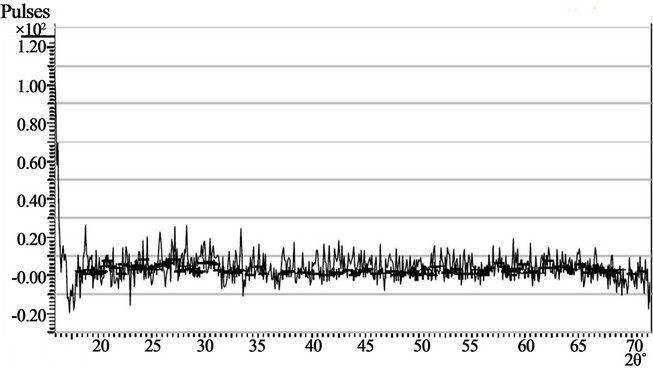
Figures 2(a) and 2(b) show the X-Ray Diffractogram of samples 400A and 400B ACG CoO thin films respectively.
The diffractograms indicate that the active phonon modes of the ACG CoO thin films are generally broad. Indeed the peaks at 33.5˚, 38.5˚, 28.5˚ and 46.5˚ in sample 400A are not properly defined. This may be due to poor scattering response which occurred in the films.
The diffractograms also suggest that the concentration of the precursors used do not significantly affect the structural properties of the deposited thin films.
The absorbance of the ACG CoO thin films decreases with concentration of precursors as shown in Figure 3. The absorbance of the thin film with 0.02 M precursor concentration increased from 0.896 (≈0.90) at 400 nm to a maximum value of 0.976 (≈1.00) at about 512 nm. Thereafter it decreases to 0.896 (≈0.90) at 600 nm and continually decreased as the wavelength increases in the infra red region.
However, the absorbance of the CoO thin film with 0.10 M precursor concentration decreased continually throughout the visible range with increasing wavelength from 0.6 at 400 nm to 0.48 at 600 nm.
The transmittance of the ACG CoO thin films increases with concentration of precursors as shown in Figure 4.
The transmittance of the thin film having precursor concentration of 0.02 M decreased from 12.93% at 400 nm to 10.99% at 512 nm. From 512 nm the transmittance increased to 12.93% at 600 nm. The transmittance of the thin film having precursor concentration of 0.1 M
 (a)
(a) (b)
(b)
Figure 2. (a) Showing the X-Ray diffraction pattern of sample 400A, (b) Showing the X-Ray diffraction pattern of sample 400B.
increased continually from 25.73% at 400 nm to 35.85% at 600 nm.
Both samples however indicate increases in transmittance with wavelength in the infra-red region.
Reflectance of the deposited thin films increases with concentration of precursors as shown in Figure 5. The reflectance of the sample with 0.1 M concentration of precursors increased from 14.55% at 400 nm to 19.09% at 600 nm.
However, the reflectance of the sample with 0.02 M concentration of precursors is negative in the visible range indicating that radiation within the visible range is either completely absorbed, or completely transmitted or absorbed and transmitted partially.
While the reflectance of the sample with 0.02 M concentration of precursors increases with wavelength in the infra-red region, the reflectance of the sample with 0.1 M concentration is fairly constant in the infra-red region.
The absorption coefficient of ACG CoO thin films decreases as the concentration of the precursors increases as shown in Figure 6. While the absorption coefficient of the sample obtained from 0.02 M concentration of precursors increased from 1.96 × 10⁻¹ m−1 at 600 nm to maximum value of 2.22 × 10⁻¹ m−1 at 4.8 × 10⁻⁷ m and decreased to 2.06 × 10⁻¹ m−1 at 4 × 10⁻⁷ m, the absorption coefficient of the sample obtained from 0.1 M concentration of precursors increased from 1.06 × 10⁻¹ m−1 at 600 nm to 1.65 × 10⁻¹ m−1 at 400 nm.
The refractive index of the ACG CoO thin film with 0.02 M precursor concentration decreased from 0.91 at 600 nm to a lowest value of 0.74 at 4.8 × 10⁻⁷ m and increased again to 0.92 at 400 nm while that of the thin film with 0.1 M precursor concentration decreased from 2.19 at 600 nm to 0.9 at 400 nm. Thus, refractive index

Figure 3. Absorbance vs. wavelength for ACG CoO thin films.
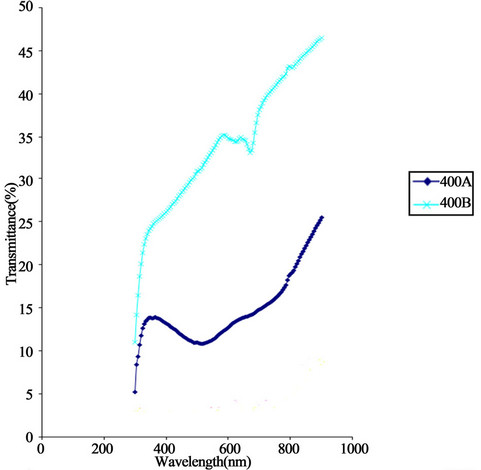
Figure 4. Transmittance vs. wavelength for ACG CoO thin films.
increases with concentration of precursors. This is as shown in Figure 7.
Figure 8 shows the variation extinction coefficient of ACG CoO thin films with photon energy.
Extinction coefficient decreases with concentration of precursors. The extinction coefficient of the sample with

Figure 5. Reflectance vs. wavelength for ACG CoO thin films.

Figure 6. Absorption coefficient vs. photon energy for ACG CoO thin films.
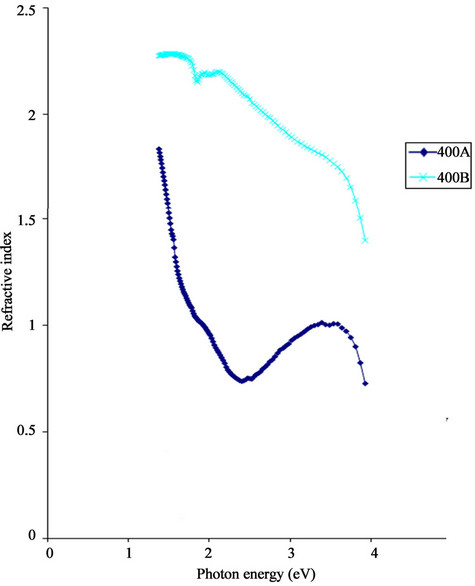
Figure 7. Refractive index vs. photon energy for ACG CoO thin energy.
0.02 M precursor concentration decreased from 52.5 at 600 nm to 45.0 at 400 nm. Hence, it increases with wavelength in the visible range.
Also, the extinction coefficient of the sample with 0.1 M precursor concentration decreased from 103.75 at 600 nm to 70.00 at 400 nm.
The relationship between direct band gap of ACG CoO thin films and photon energy is as shown in Figure 9.
The direct band gap of the ACG CoO thin films increases with increasing precursor concentration. While sample 400A has a direct band gap of 1.27 eV, sample 400B has a direct band gap of 2.1 eV.
This shows that sample 400A is suitable for use as absorber layer in solar cells while sample 400B can serve as window layer in solar cells.
The real dielectric constant of ACG CoO thin films increases with increase in precursor concentration. This is shown in Figure 10.
The real dielectric constant of sample 400A reduced from 0.93 at 6 × 10⁻⁷ m to a minimum of 0.5 at 4.96 × 10⁻⁷ m. Thereafter, the real dielectric constant increased with decreasing wavelength to 0.93 at 4 × 10⁻⁷ m.
In the infra-red range, the real dielectric constant decreased from a peak value of 3.33 at 8.5 × 10⁻⁷ m to a minimum value of 0.93 at 6 × 10⁻⁷ m.
In the ultra-violet range, the real dielectric constant
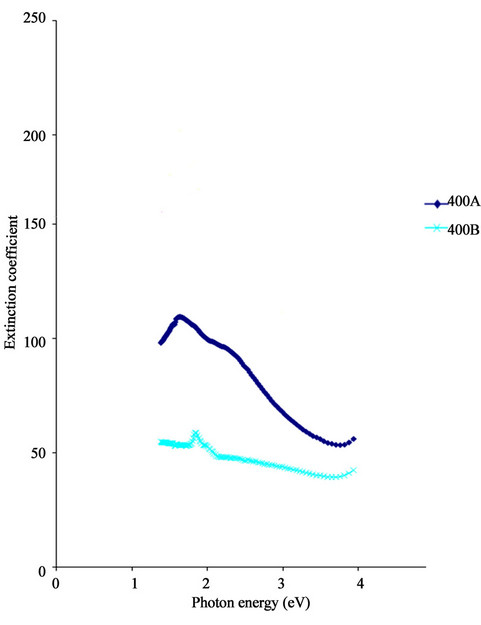
Figure 8. Extinction coefficient vs. photon energy for ACG CoO thin films.

Figure 9. Direct band gap plot for ACG CoO thin films.
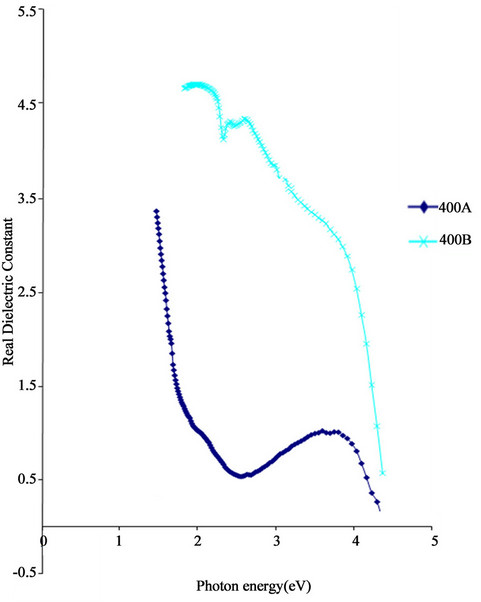
Figure 10. Real dielectric constant vs. energy for ACG CoO thin films.
reached a maximum value of 1.07 at 3.38 × 10⁻⁷ m from 0.93 at 4 × 10⁻⁷ m. Thereafter, it decreased with decrease in wavelength until it attained a zero real dielectric constant value at 2.9 × 10⁻⁷ m. On the other hand, the real dielectric constant of sample 400B decreased steadily from 4.7 at 6 × 10⁻⁷ m to 3.64 at 4 × 10⁻⁷ m. In the ultra violet range, its value decreased steeply with decrease in wavelength.
The imaginary dielectric constant of ACG CoO thin films increases with decrease in precursor concentration as shown in Figure 11.
The complex dielectric constant of sample 400A decreased sharply over a short wavelength range in the infra-red region from a maximum value of 362 at 8.5 × 10⁻⁷ m to 198 at 6 × 10⁻⁷ m.
In the visible range, the complex dielectric constant reduced from 198 at 6 × 10⁻⁷ m to 126 at 4 × 10⁻⁷ m. Also, in the ultra violet range the complex dielectric constant decreased parabolically from 126 at 4 × 10⁻⁷ m to 82 at 3.04 × 10⁻⁷ m. The complex dielectric constant of sample 400B reduced from 216 at 6 × 10⁻⁷ m to 172 at 4 × 10⁻⁷ m. In the ultra violet range, the complex dielectric constant of the sample reduced steadily with decreasing wavelength.
Figure 12 shows the micrograph of the samples. The photomicrographs were obtained using a KPL-W10X/18 Zeiss standard 14 photomicroscope with M35 4760+2-
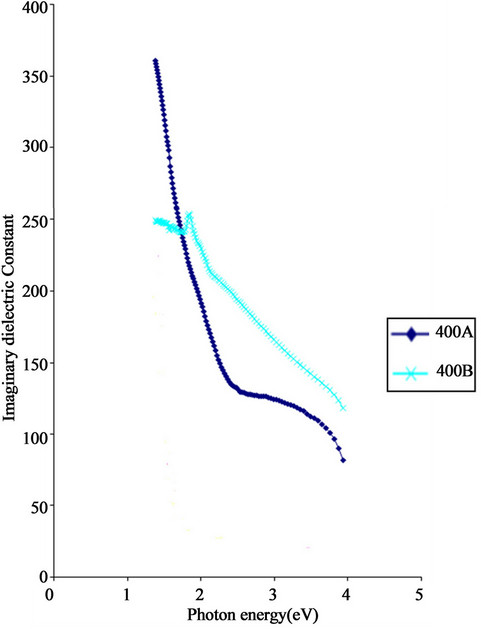
Figure 11. Imaginary dielectric constant vs. photon energy for ACG CoO thin films.
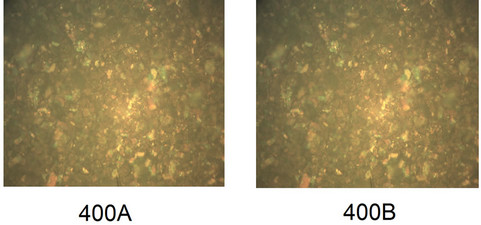
Figure 12. Photomicrographs of ACG CoO thin films.
9901 camera. It shows the uniformity of the samples deposited, which show the uniformly distributed particles on the substrates.
4. Conclusions
Thin films of CoO have been successfully deposited on glass substrates using the Aqueous Chemical Growth method after Lionel Vayssieres.
The films were successfully analysed to determine the effect of precursor (CoCl2 and C2H12N4) concentration on their optical and solid state properties.
The result of the analysis indicate that while the absorbance, absorption and extinction coefficients decreases with increasing precursor concentration, the transmittance, reflectance, refractive index, direct band gap, real and imaginary dielectric constants increase with increasing precursor concentration.
The CoO thin film deposited from 0.1 M precursor concentration was found to be a suitable material for use in the construction of poultry houses for the rearing of day old chicks and for use as window layer in solar cells.
REFERENCES
- C. G. Greanqvist, “Handbook of Inorganic Electrochemical Materials,” Elsevier, Amsterdam, 1995.
- M. Ando, T. Kobayashi and M. Haruta, “Combined Effects of Small Gold Particles on the Optical Gas Sensing by Transition Metal Oxide Films,” Catalysis Today, Vol. 36, No. 1, 1997, pp. 135-141. doi:10.1016/S0920-5861(96)00206-4
- M. Ando, T. Kobayashi, S. Iijima and M. Haruta, “High Impact Applications, Properties and Synthesis of Axciting New Materials,” Journal of Materials Chemistry, Vol. 7, No. 9, 1997, pp. 1779-1783. doi:10.1039/a700125h
- D. Barreca, C. Massignan, S. Daolio, M. Fabrizio, C. Piccirillo, L. Armelao and E. Tondello, “Composition and Microstructure of Cobalt Oxide Thin Films Obtained from a Novel Cobalt(II) Precursor by Chemical Vapor Deposition,” Chemistry of Materials, Vol. 13, No. 2, 2001, pp. 588-593. doi:10.1021/cm001041x
- E. Hosono, S. Fujihara, I. Honma, M. Ichihara and H. Zhou, “Corrigendum to Synthesis of the CoOOH Fine Nanoflake Film with the High Rate Capacitance Property,” Journal of Power Sources, Vol. 158, No 1, 2006, pp. 779-783. doi:10.1016/j.jpowsour.2005.09.052
- E. Barrera, I. González and T. Viveros, “A New Cobalt Oxide Electrodeposit Bath for Solar Absorbers,” Solar Energy Materials and Solar Cells, Vol. 51, No. 1, 1998, pp. 69-82. doi:10.1016/S0927-0248(97)00209-2
- D. Phase, R. J. Choudhary, V. Ganesan, V. R. Reddy, A. Gupta, N. Selvi, S. Kulkarni and S. Ogale, “Manipulation of Magnetic Nanostructures through Low Temperature Metal-Oxygen Chemistry: Co/CoO Exchange Based Nanodonuts and Co Nanotips,” Solid State Communications, Vol. 149, No. 7-8, 2009, pp. 277-280. doi:10.1016/j.ssc.2008.12.019
- I. G. Casella and M. R. Guascito, “Electrochemical Preparation of a Composite Gold-Cobalt Electrode and Its Electrocatalytic Activity in Alkaline Medium,” Electrochimica Acta, Vol. 45, No. 7, 1999, pp. 1113-1120.
- P. S. Silinsky and M. S. Seehra, “Principal Magnetic Susceptibilities and Uniaxial Stress Experiments in CoO,” Physical Review B, Vol. 24, No. 1, 1981, pp. 419-423. doi:10.1103/PhysRevB.24.419
- R. Kannan and M. S. Seehra, “Percolation Effects and Magnetic Properties of the Randomly Diluted fcc System CopMg1−pO,” Physical Review B, Vol. 35, No. 13, 1987, pp. 6847-6853.
- R. Drasovean and S. Condurache-Bota, “Structural Characterization and Optical Properties of Co3O4 and CoO Films,” Journal of Optoelectronics and Advanced Materials, Vol. 11, No. 12, 2009, pp. 2141-2144.
- T. Maruyama and S. Arai, “Electrochromic Properties of Cobalt Oxide Thin Films prepared by Chemical Vapour-Deposition,” Journal of the Electrochemical Society, Vol. 143, No. 4, 1996, pp. 1383-1386. doi:10.1149/1.1836646
- P. S. Patil, L. D. Kadam and C. D. Lokhande, “Preparation and Characterization of Sprayed Cobalt Oxide Thin Films,” Thin Solid Films, Vol. 272, No. 1, 1996, pp. 29- 32. doi:10.1016/0040-6090(95)06907-0
- P. Nkeng, J. F. Koening, J. L. Gautier, P. Chartier and G. Poillesat, “Enhancement of Surface Areas of Co3O4 and NiCo2O4 Electrocatalysts Prepared by Spray Pyrolysis,” Journal of the Electrochemical Society, Vol. 402, No. 1, 1996, pp. 81-89.
- L. C. Schumacher, I. B. Holzhueter, I. R. Hill and K. J. Dignam, “Semiconducting and Electrocatalytic Properties of Sputtered Cobalt Oxide Films,” Electrochimica Acta, Vol. 35, No. 6, 1990, pp. 975-984. doi:10.1016/0013-4686(90)90030-4
- Y. Ni, X. Ge, Z. Zhang, H. Liu, Z. Zho and Q. Ye, “A Simple Reduction-Oxidation Route to Prepare Co3O4 Nanocrystals,” Materials Research Bulletin, Vol. 36, No. 13-14, 2001, pp. 2383-2387. doi:10.1016/S0025-5408(01)00739-5
- Y. Zhu, H. Li, Y. Koltypin and A. Gedanken, “Preparation of Nanosized Cobalt Hydroxides and Oxyhydroxide Assisted by Sonication,” Journal of Materials Chemistry, Vol. 12, No. 3, 2002, pp. 729-733. doi:10.1039/b107750c
- M. Guo, P. Diao and S. M. Cal, “Photoelectrochemical Properties of Highly Oriented ZnO Nanotube Array Films on ITO Substrates,” Chinese Chemical Letter, Vol. 15, No. 9, 2004, pp. 1113-1116.
- L. Vayssieres, “On the Design of Advanced Metal Oxide Nanomaterials,” International Journal of Nanotechnology, Vol. 1, No. 1-2, 2004, pp. 1-41.