Open Journal of Nursing
Vol.3 No.8A(2013), Article ID:41428,10 pages DOI:10.4236/ojn.2013.38A006
Swedish Hospital Survey on Patient Safety Culture— Psychometric properties and health care staff’s perception
![]()
1Faculty of Health, Science and Technology, Karlstad University, Karlstad, Sweden
2Faculty of Public Health, Hedmark University College, Elverum, Norway
3Primary Care Research Department, County Council of Värmland, Karlstad, Sweden
Email: *anna.nordin@kau.se
Copyright © 2013 Anna Nordin et al. This is an open access article distributed under the Creative Commons Attribution License, which permits unrestricted use, distribution, and reproduction in any medium, provided the original work is properly cited.
Received 22 October 2013; revised 23 November 2013; accepted 4 December 2013
Keywords: HSOPSC; Patient Safety Culture; Psychometrics; Questionnaire
ABSTRACT
This study examined the psychometric properties of the Swedish and the original version of the Hospital Survey on Patient Safety Culture within a Swedish hospital setting and described health care staff’s perceptions of patient safety culture. A web-survey was used to obtain data from registered nurses, enrolled nurses and physicians (N = 1023). Psychometric properties were tested using Confirmatory Factor Analysis and internal consistency using Cronbach’s alpha coefficient. Root mean square error of approximation and other fit indices indicated psychometric properties for both versions to be acceptable. Internal consistency for the dimensions varied between 0.60 and 0.87. Staff scored the dimension “Teamwork Within Units” highest and the dimension “Hospital Management Support” the lowest. The safety was graded as very good or excellent by 58.9% of the respondents and one third had reported more than one event in the past 12 months. The questionnaire is considered to be useful for measuring patient safety culture in Swedish hospital settings. Managers have a great responsibility to work with improving patient safety culture.
1. INTRODUCTION
Reports have shown that between three and 17% of all patients experience one or more adverse events during hospital stay [1-3]. Ever since the report “To err is Human” [4] was published, creating a culture that strives towards and supports patient safety has become a matter of growing interest and increasing priority for health care managers [5]. A culture of safety is defined by the European Society for Quality in Healthcare as “An integrated pattern of individual and organizational behavior, based upon shared beliefs and values that continuously seeks to minimize patient harm, which may result from the processes of care delivery” [6, p. 4]. Important components of safety culture are managers identifying safety as a core principle, managers involving in everyday operations, employees having a substantial voice in safety decisions, and systems for reinforcing safe behavior and for reporting negative events [7]. Health care manager’s crucial role in nurturing a culture of safety was also shown by Zohar [8]. Patient safety culture, a specific aspect of a health organisation’s general culture, refers to management and staff values, beliefs, and norms concerning what is important in a health system, how health care staff are expected to behave, what attitudes and actions are appropriate and inappropriate, and what processes and procedures are rewarded and punished with regard to patient safety [9]. The increased interest in patient safety among researchers, health care managers and health care staff has generated development of questionnaires able to measure aspects of safety culture that influence patient safety in clinical areas [10]. Several questionnaires, mainly from the US, are available today [11], but only a few have distinct reported underlying theory and analysis concerning the psychometrical properties. One questionnaire is the Hospital Survey on Patient Safety Culture (HSOPSC), developed in the US [12]. The HSOPSC consists of 44 patient safety culture items forming 12 dimensions. Unit-level patient safety culture is measured with 24 items forming seven dimensions. Hospital level patient safety culture is measured using eleven items forming three dimensions. Seven items form two dimensions, one regarding overall perception of safety, and one regarding frequency of event reporting. Furthermore, two items measure patient safety grade and number of events reported. The HSOPSC showed sound psychometric properties by means of exploratory factor analysis (EFA) and confirmatory factor analysis (CFA) [12]. The psychometric properties of the HSOPSC were further tested in several studies in the US [13] and in European countries e.g. Belgium [14], the Netherlands [15], Norway [16], Switzerland [17], Turkey [18], the UK [19] and Scotland [20]. In these studies, the number of dimensions varied between eight and 15 and included 27 to 50 items and internal consistency for the different dimensions measured by Cronbach’s alpha varied between 0.44 and 0.86. Patient safety culture measured by means of HSOPSC describes strong areas of patient safety and areas in need of improvement. Studies have shown that the dimensions “Teamwork Within Hospital Units” [14, 21-25], “Manager Promoting Safety” [14,21,22,26], “Hospital Management Support” [23,25,26] and “Organisational Learning” [22,23,25] were highly scored indicating patient safety strengths concerning these aspects. On the contrary, “Hospital Handoffs & Transitions” [14, 22-26], “Nonpunitive Response To Error” [14,22,23,25], and “Staffing” [22,23,25,26] were scored lowest, indicating that these areas were in need of improvement. As patient safety is crucial for quality of care, it is important that the questionnaire is valid, reliable and adapted to the culture where it is intended to be used. The HSOPSC has been translated into Swedish and further modified for Swedish conditions. This version, the Swedish Hospital Survey on Patient Safety Culture (S-HSOPSC) has to our knowledge been tested concerning content validity [27] and no reports on psychometric properties of this version have been found. Measuring patient safety culture is crucial when managers in health care aim at improving safety by handling adverse events and benchmark towards other health care organizations. Since staff teamwork, organisational learning and manager’s actions are important components in patient safety culture, it is important to gain knowledge about staff perception of patient safety culture.
Study Aim
The aim of this study was to examine the psychometric properties of the S-HSOPSC and the HSOPSC within a Swedish hospital setting and to describe health care staff’s perceptions of patient safety culture.
2. METHODS
2.1. Setting, Sample and Procedures
This cross-sectional study was conducted in late 2009 at three out of nine hospital health care divisions in a county council in central Sweden. The inclusion criteria were to be a registered nurse (RN), enrolled nurse (EN) or physician. The sample consisted of 2120 health care staff, (RNs n = 1225, ENs n = 633 and physicians n = 262) employed at a medical (n = 999), surgical (n = 821) or mixed medical-surgical (n = 300) health care division. The medical and the surgical divisions, including upper managerial board span over two hospitals. The mixed medical-surgical division constitutes of staff employed at a third hospital led by a hospital manager and upper managers. To be able to perceive patient safety culture the respondents had to have a serving time for three months or more in the actual workplace, having a serving grade of 50 percent or more and not being on extended sick or parental leave. Name and e-mail addresses of the staff eligible for the study were obtained from nurse managers and personnel officers. To ensure that the questionnaires were sent out to the correct recipients, nurse managers and personnel officers were asked to review the address lists thoroughly and if necessary adjust them.
Survey aim, information about voluntary participation and confidentiality was emphasized in open information meetings held at the health divisions. The questionnaire was disseminated by an external operator as a web-survey to all selected staff via an e-mail message to their personal mail address received at employment. The e-mail message contained a digitally coded link to the questionnaire, unique for each respondent, and information about the study, its background and aim, voluntary participation, informed consent and that data was to be handled confidentially. The first reminder to all nonrespondents was sent digitally after 2 weeks and the second reminder was sent 9 days thereafter. A flow diagram of participants through the sample-process is shown in Figure 1, and Table 1 shows a description of respondent characteristics. The project has undergone ethical review by the local committee for Research Ethics at Karlstad University (Dnr. C 2009/304).
2.2. Questionnaire
A Swedish steering-group consisting of RNs and physicians with solid experience of patient safety issues representing six county councils and The National Board of Health and Welfare was commissioned to adapt the HSOPSC (44 items, 12 dimensions) for use in Sweden. The HSOPSC was translated into Swedish using backtranslation [27]. Face validity was examined and seven items of importance for patient safety culture within a Swedish health care context was added [28]. Six of the added items form two dimensions concerning information and support to patients, relatives and staff in connection with adverse events and one item deals with reporting risks. Thus, the S-HSOPSC consists of 51 patient safety culture items forming 14 dimensions. Content validity of the S-HSOPSC was tested on 100 persons and
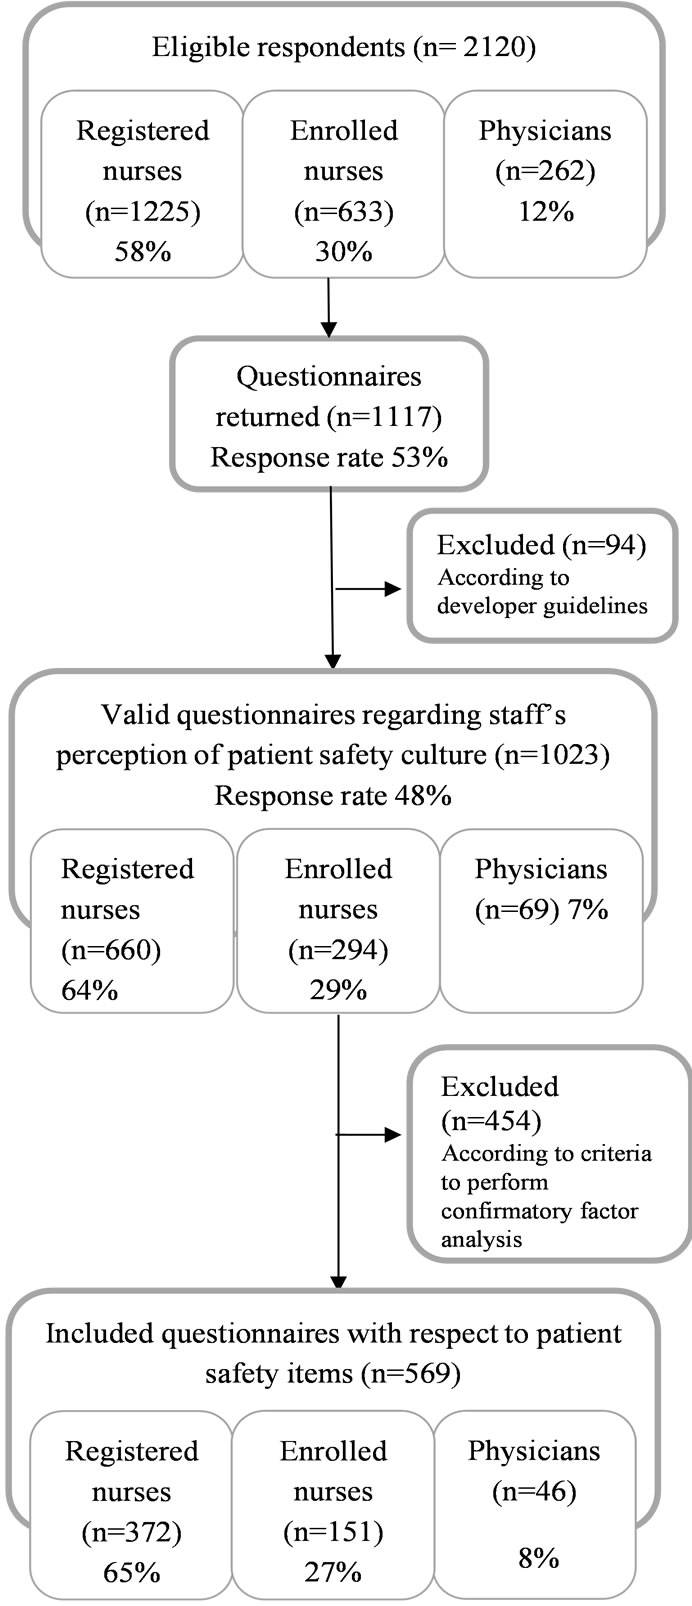
Figure 1. Flow of respondents through each stage in the sample process.
found to be good. Furthermore, this version was tested in a pilot study with 3100 employees including outpatient, inpatient, day and homecare services (response rate 60%).
After the pilot study, minor changes in wording were made, e.g. in addition to “hospital management” the wording “or equivalent” was added [27]. Table 2 shows the HSOPSC and S-HSOPSC including level of measurement, dimensions, items, response alternatives and internal consistency for the present study.
2.3. Statistics and Data Analysis
A confirmatory factor analysis (CFA) was used to examine the psychometric properties of the S-HSOPSC and the HSOPSC. In order to fulfil the criteria for CFA used
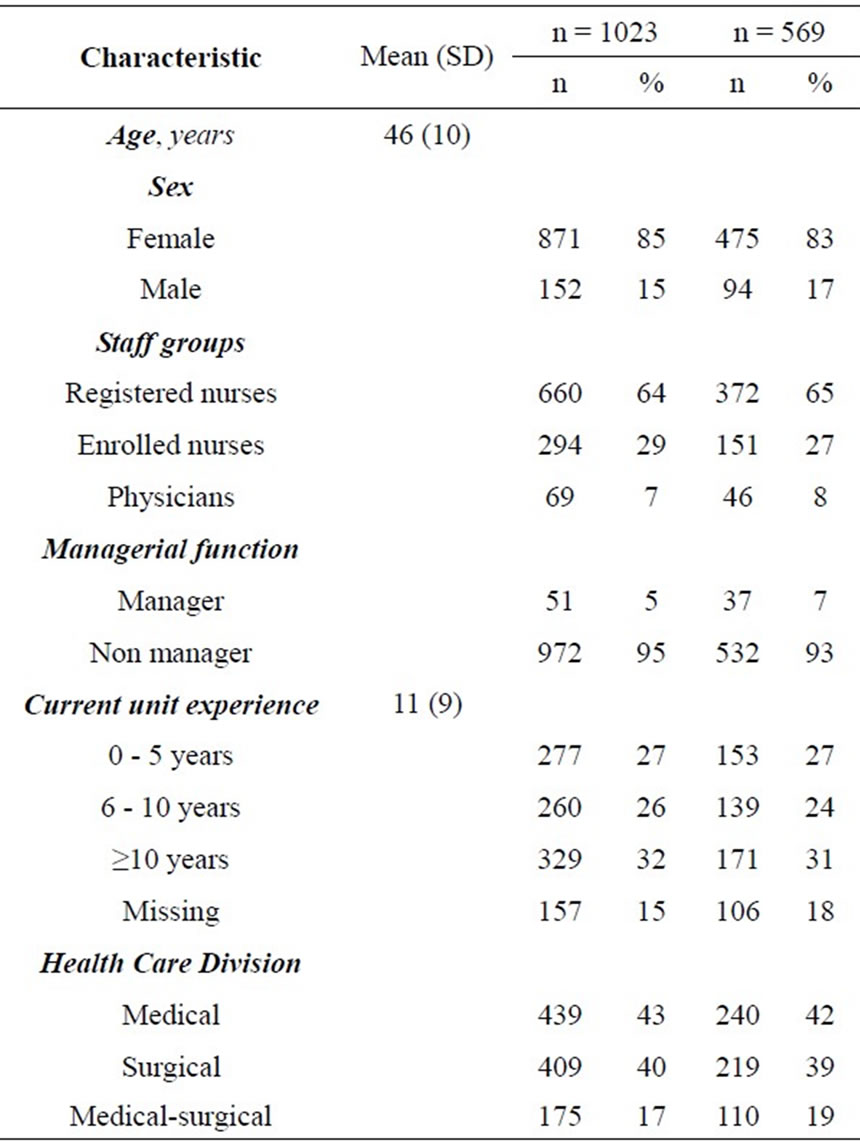
Table 1. Respondent characteristics.
in this study, respondents who had answered all patient safety culture items in the S-HSOPSC, i.e. 569 respondents were included for these analyses. Listwise deletion of missing data was used and parameters were estimated using the maximum likelihood method. Primarily Root Mean Square Error of Approximation (RMSEA) was used as model fit index although different fit indices are also reported. RMSEA represents how well a model fits a population, not just a sample used for estimation and RMSEA tries to correct for both model complexity and sample size. Values ranging from 0.05 to 0.08 are considered as acceptable [29]. χ2 statistic, which is the most fundamental absolute fit index, provides a statistical test of the resulting difference between the models. Degrees of freedom (df) represent the amount of information available to estimate model parameters, just as with other statistical procedures. The Goodness-of-Fit Index (GFI) produces a fit statistic less sensitive to sample size. Comparative Fit Index (CFI) is among the most widely used indices because it’s relative insensitivity to model complexity. The Tucker Lewis Index (TLI) is conceptually similar to CFI and involves a mathematical comparison of a specified measurement model and a baseline model. GFI and CFI values range between 0 and 1. TLI can show values below 0 or exceed 1. A model with higher GFI, CFI and TLI values suggest a better fit than a
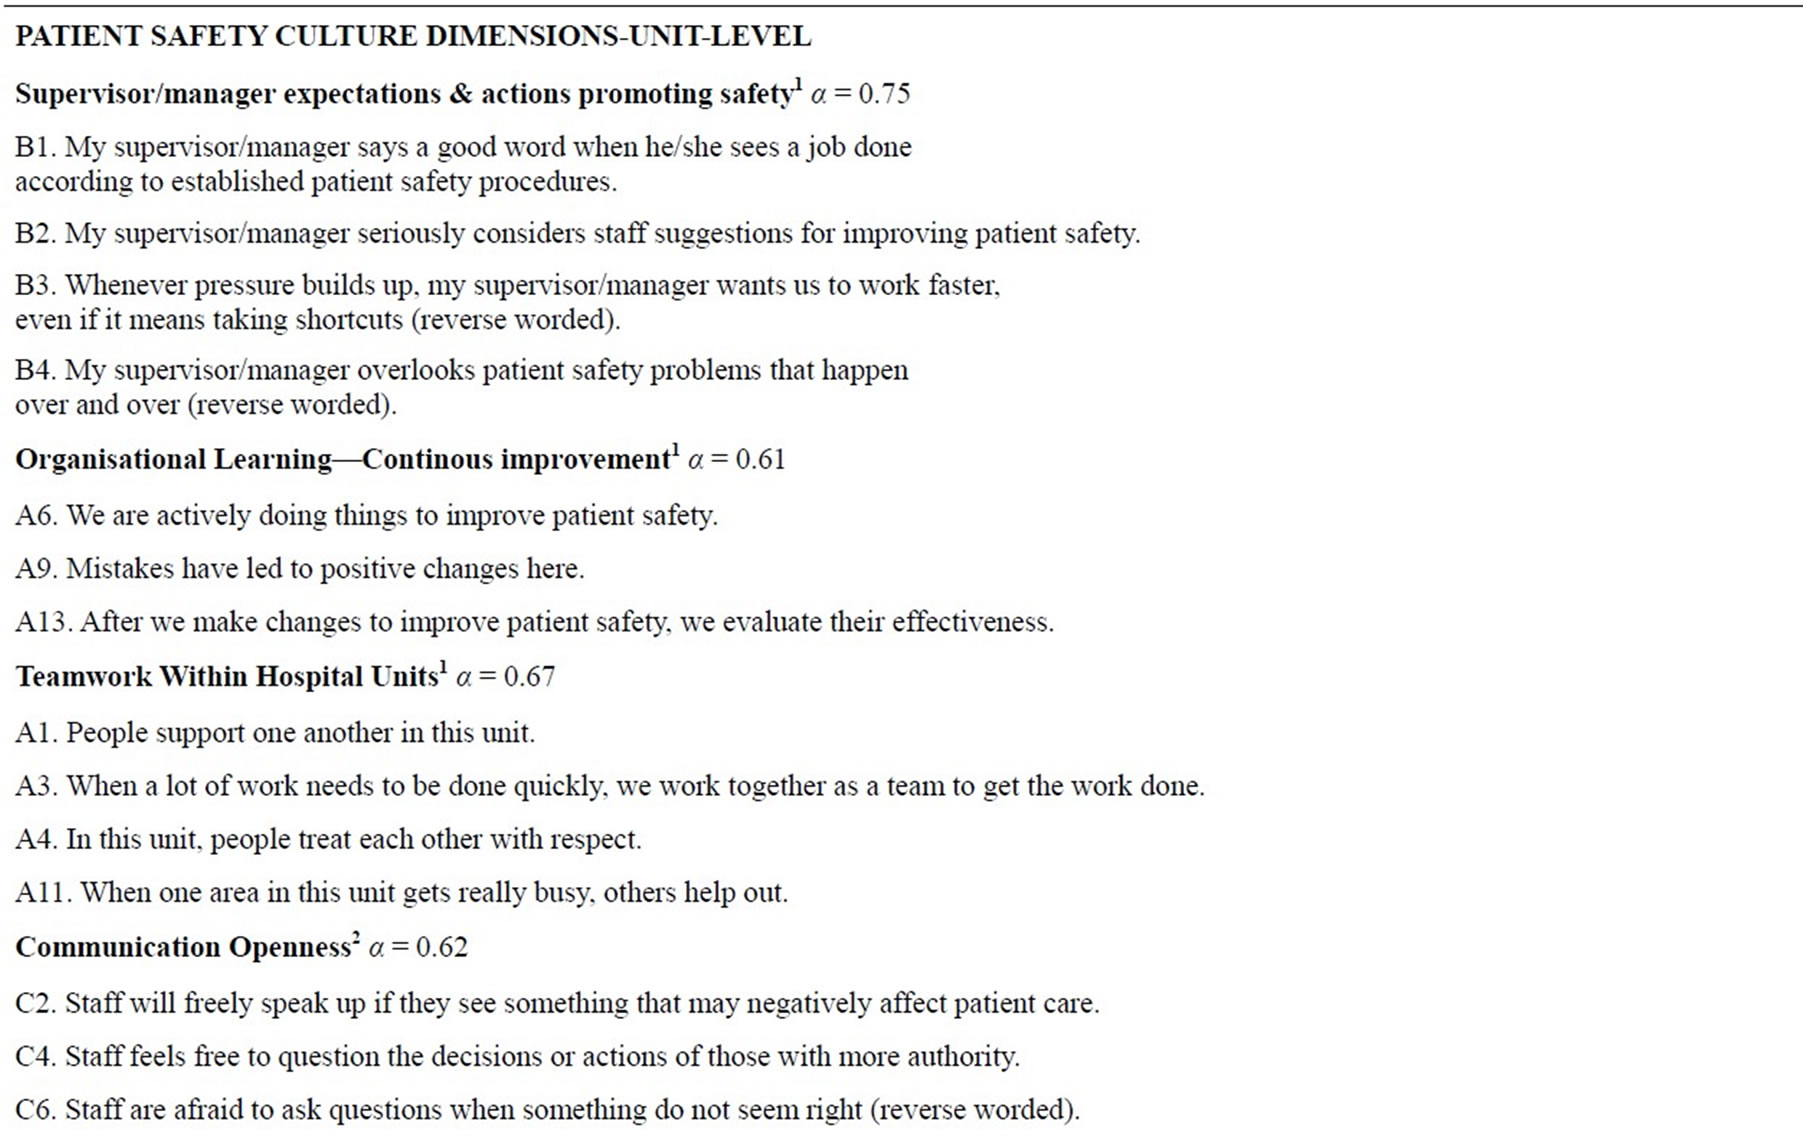
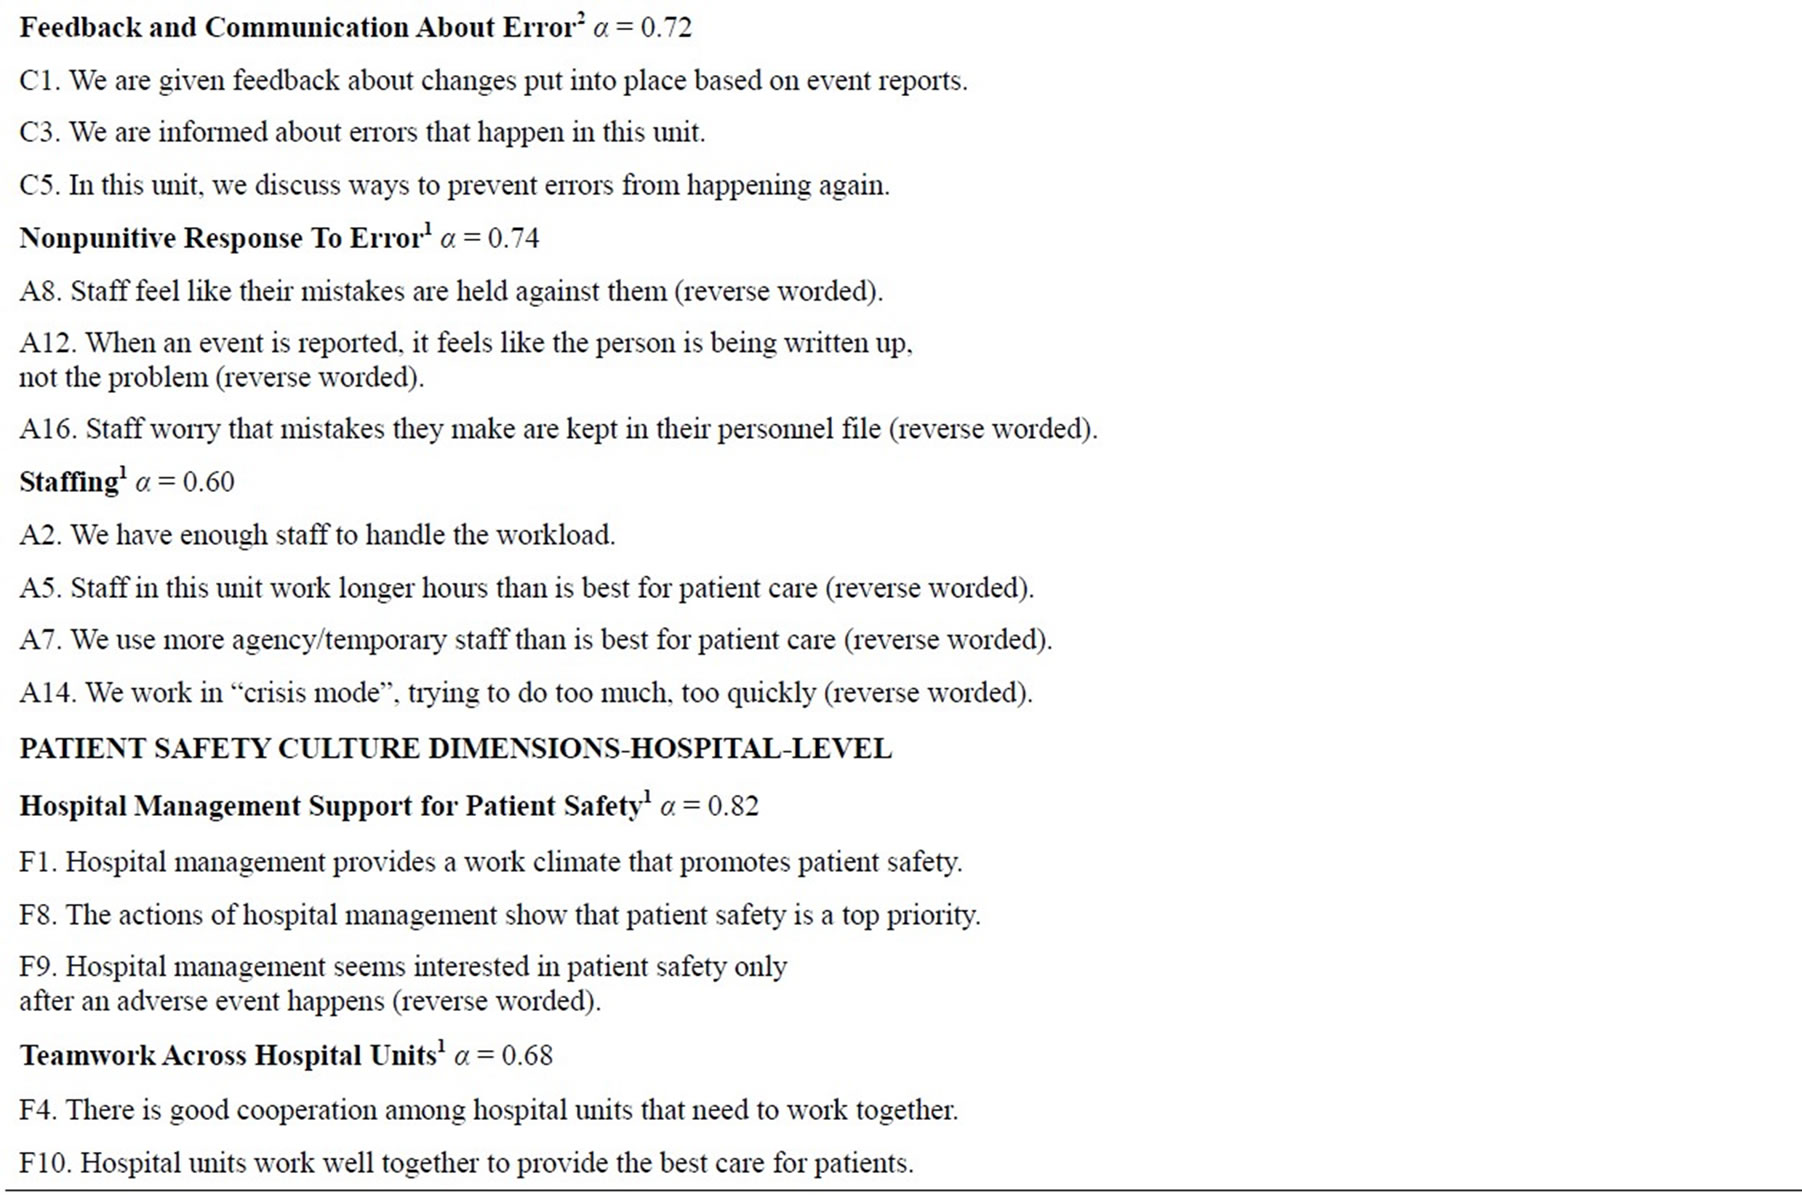
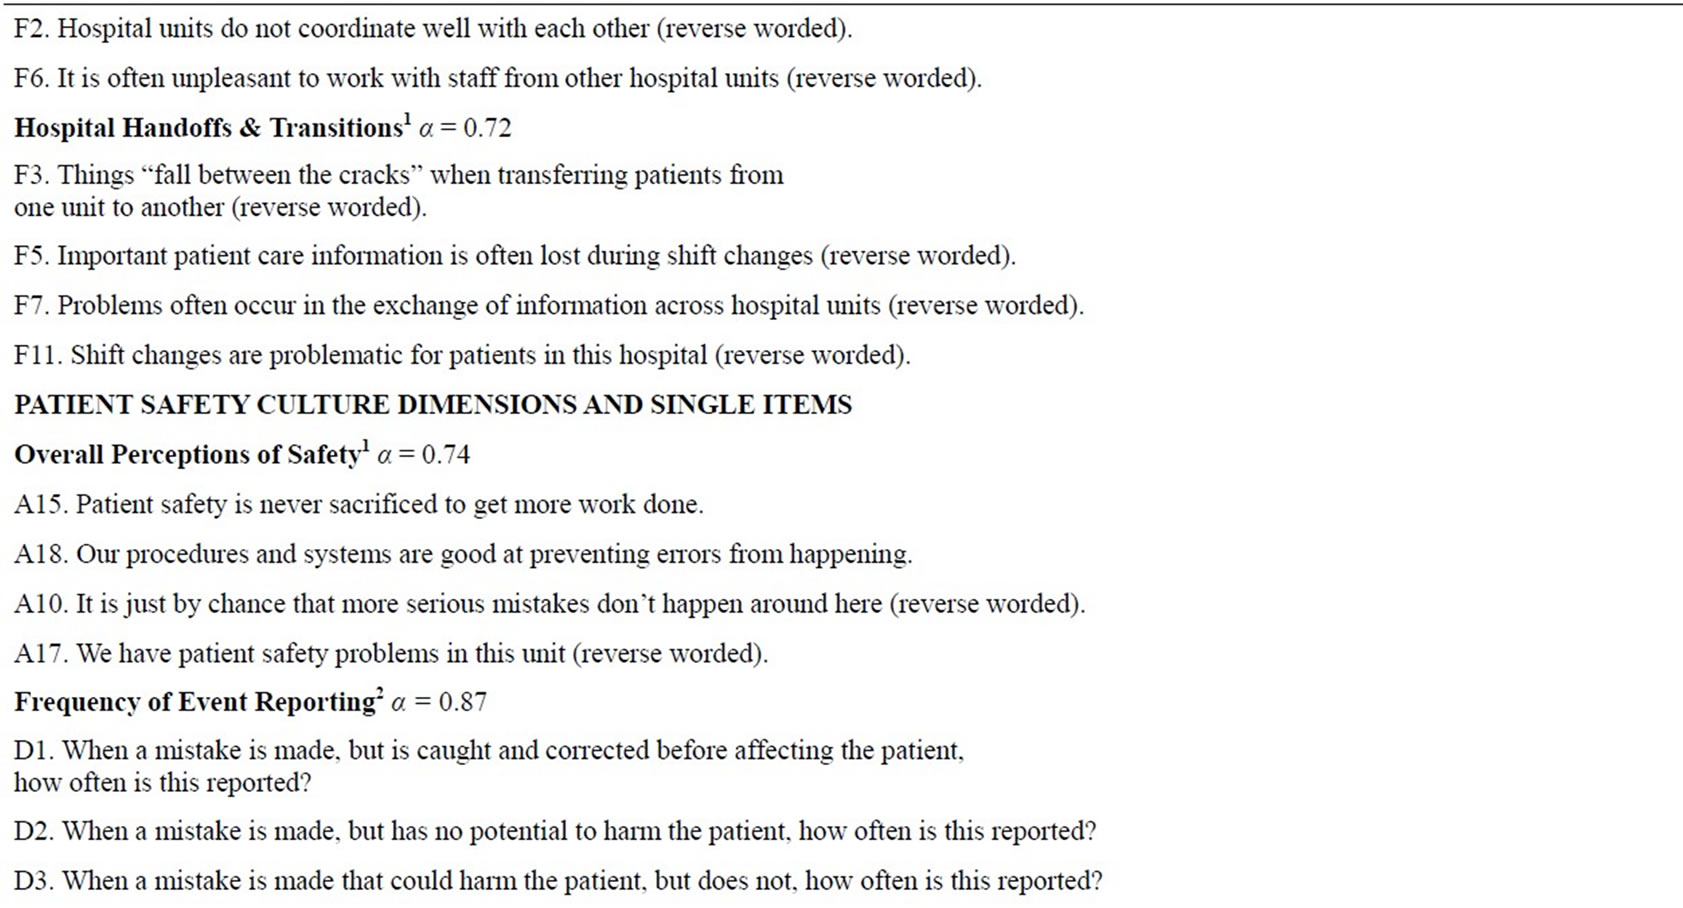
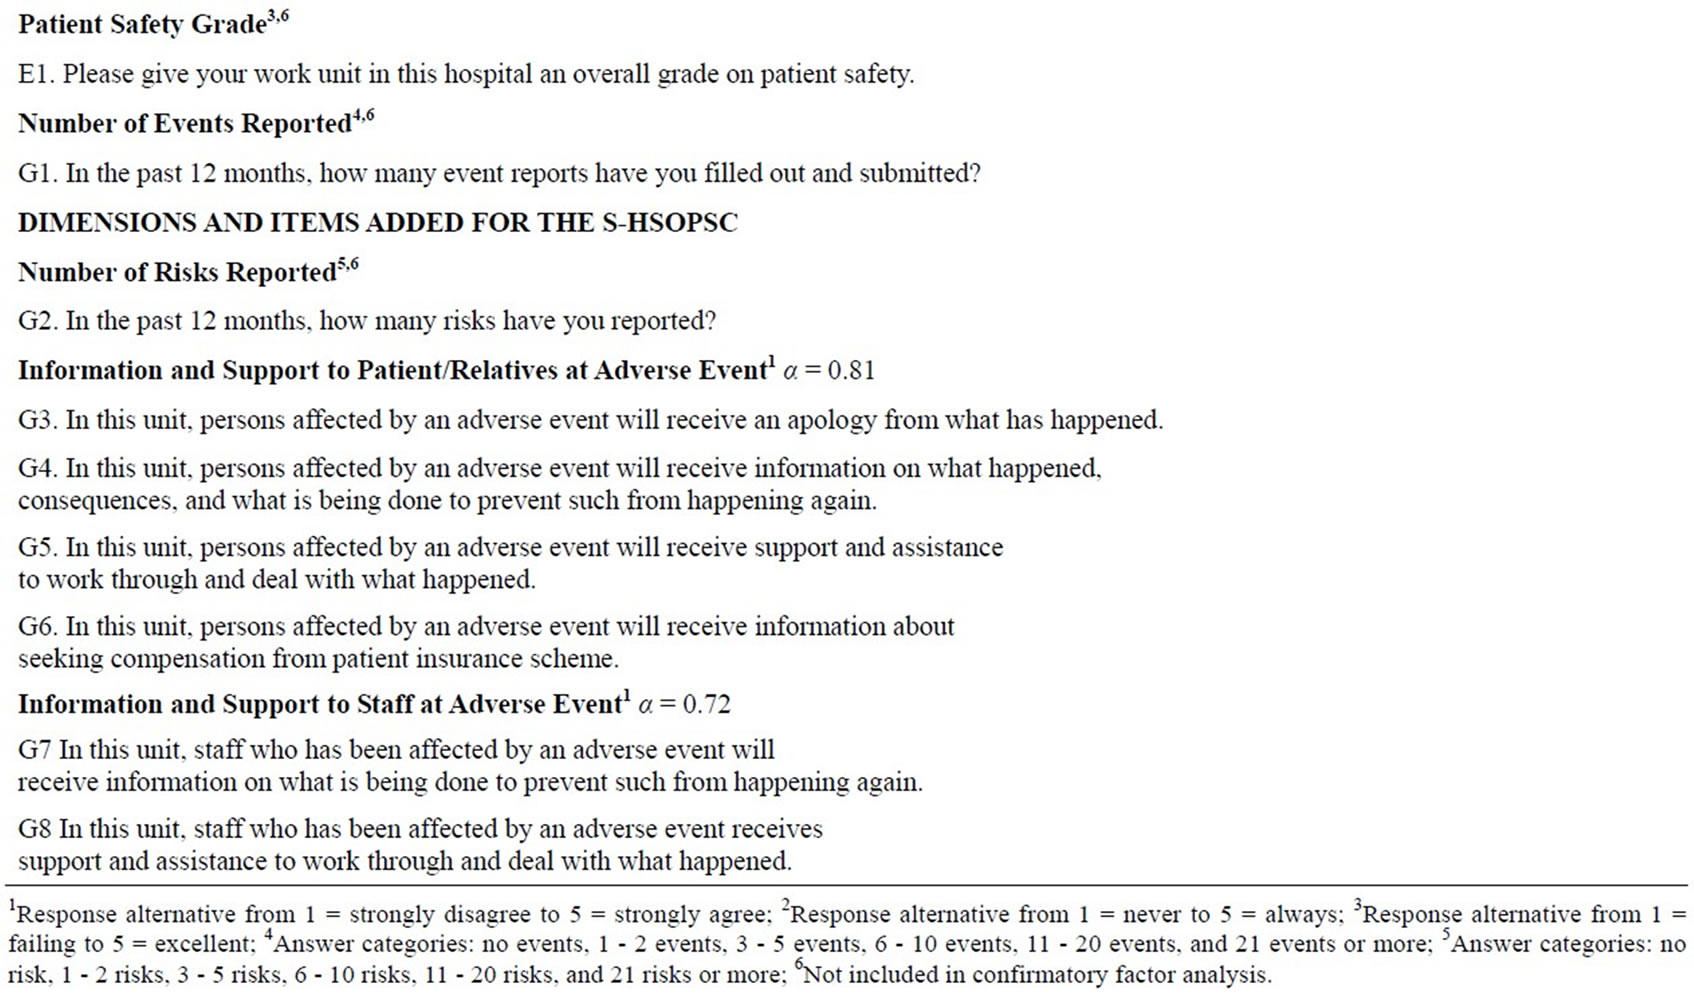
Table 2. Hospital Survey on Patient Safety Culture (HSOPSC) and the Swedish version (S-HSOPSC), level of measurement, dimensions, items, internal consistency and response alternatives.
model with lower values [29]. Internal consistency was calculated using Cronbach’s alpha coefficient.
For analyses conducted to examine health care staff’s perceptions of patient safety culture, all valid questionnaires, i.e. 1023 were included. Nominal data was presented in frequencies and percentage, interval data in mean and (SD). Composite scores for all 14 dimensions (composites) were calculated making up a possible score ranging from 0 to 100, with higher scores indicating a more positive assessment of patient safety culture. Areas with mean percentage values of 75 and above were considered as patient safety strengths and those not reaching values of 50 were considered as areas in need of improvement. The percentage of positive responses was calculated i.e. the percentage of respondents who answered the item with “strongly agree” and “agree” or “always” and “most of the time” [12]. Statistical analyses were conducted using IBM Statistical Package for Social Sciences (SPSS) Statistics version 18.0 and SPSS Analysis of moment structures (SPSS Amos).
3. RESULTS
3.1. Validity
Initially, the 14 dimensional model of the S-HSOPSC was investigated. Table 3 shows global fit of the proposed S-HSOPSC and the HSOPSC dimensional models. The CFA of the S-HSOPSC showed a χ2 of 5240 (p =< 0.001) and a df of 1068. RMSEA showed a value of 0.082 indicating the S-HSOPSC to be an acceptable model. Furthermore, a CFA of the 12 dimensional model of the original HSOPSC was also performed, showing a χ2 of 4162 (p =< 0.001) and a df of 819. The RMSEA showed a value of 0.085 indicating the HSOPSC also to be an acceptable model.
3.2. Reliability
The 12 dimensions common for both the S-HSOPSC and the HSOPSC showed alpha values between 0.60 and 0.87. Cronbach’s alpha for the two added dimensions in the S-HSOPSC were 0.81 and 0.72 respectively (Table 2).
3.3. Patient Safety Culture
Areas of patient safety culture strengths were seen in three unit level dimensions: “Teamwork within Hospital Units” showed the highest score, followed by “Communication Openness” and “Feedback and Communication about Error”. The patient safety culture dimension “Frequency of Event Reporting”, the hospital level dimension
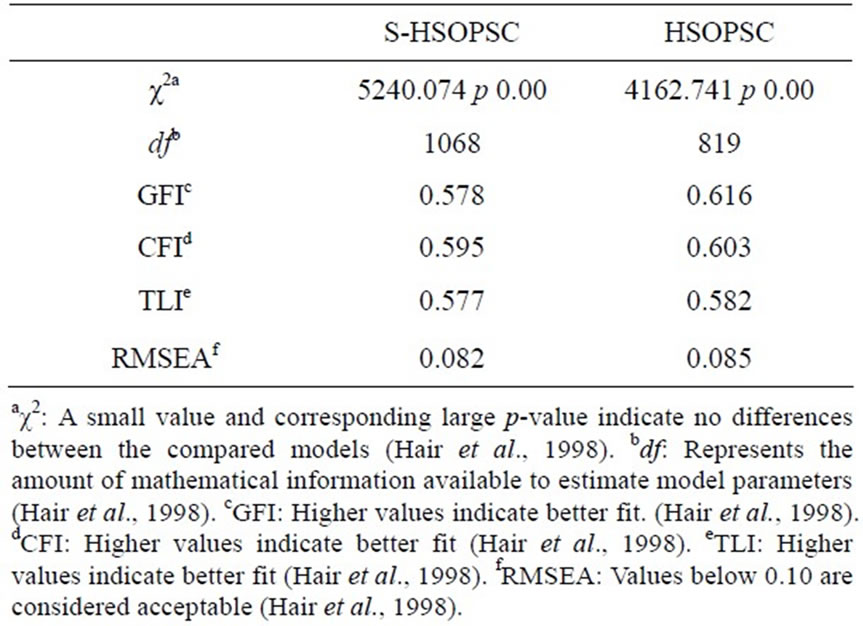
Table 3. Global fit of the proposed factor structure reported by means of fit indices.
“Hospital Management Support”, and the Swedish added dimension “Information and Support to Patients/Relatives at Adverse Event” showed the lowest scores (Table 4). Figures 2 and 3 show patient safety grade and number of events reported in the past 12 months. In total 58.9% of the respondents gave their hospital unit a “very good” or “excellent” patient safety grade (Figure 2) and 67.1% reported more than one event in the past 12 months (Figure 3).
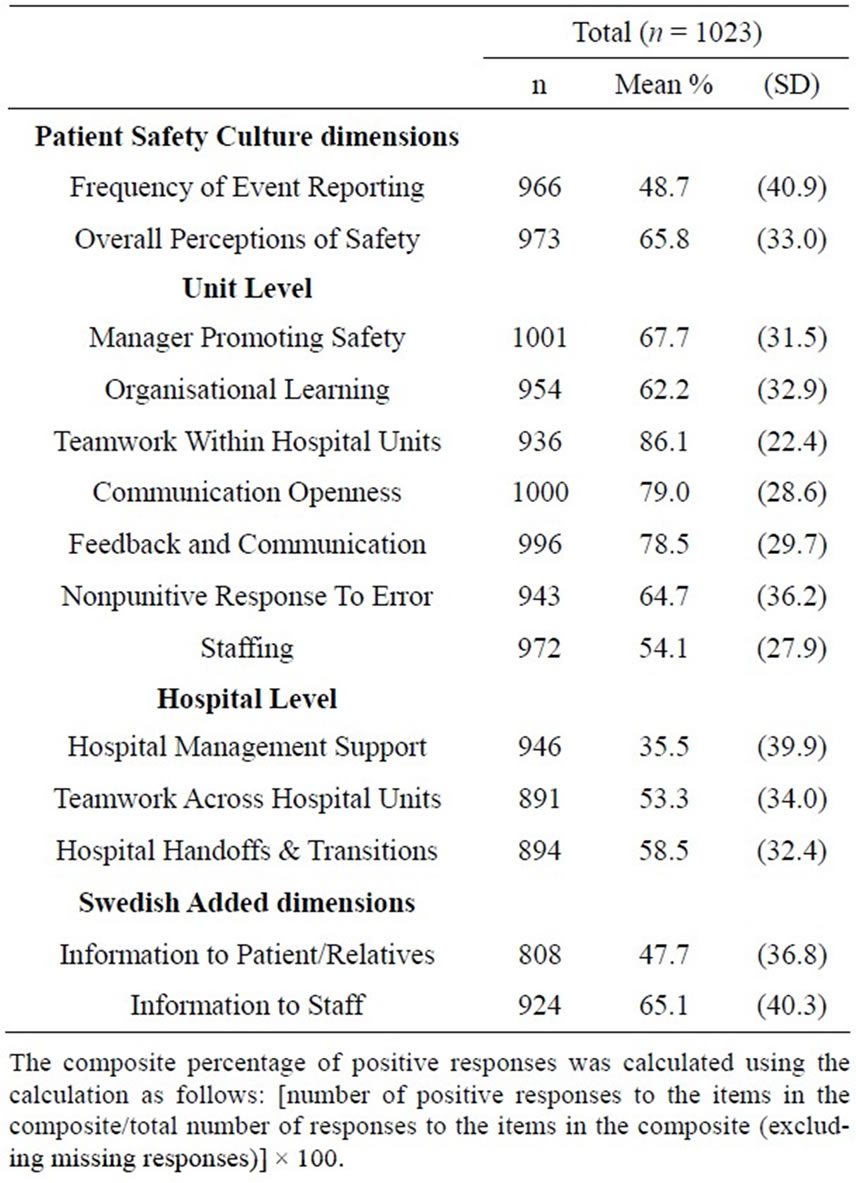
Table 4. Patient Safety Culture composite scores for the Swedish Hospital Survey on Patient Safety Culture (S-HSOPSC).
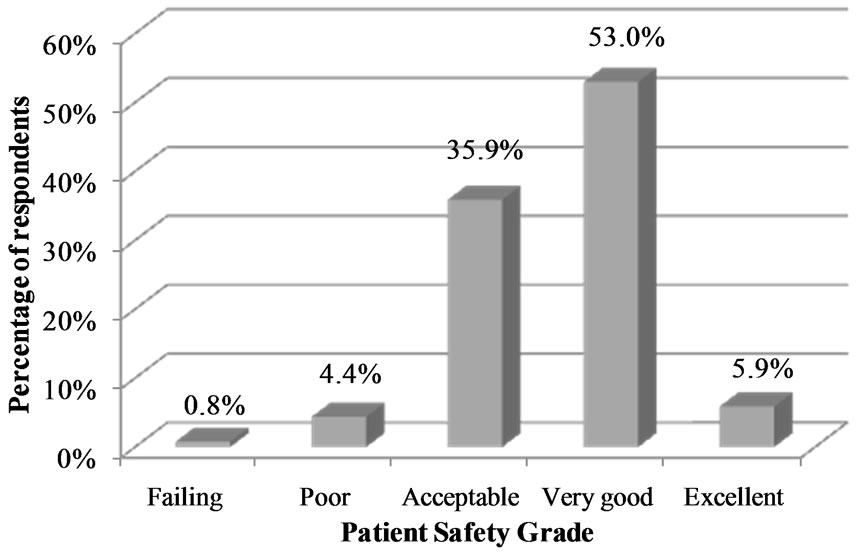
Figure 2. Percentage of respondents giving their work unit a patient safety grade.
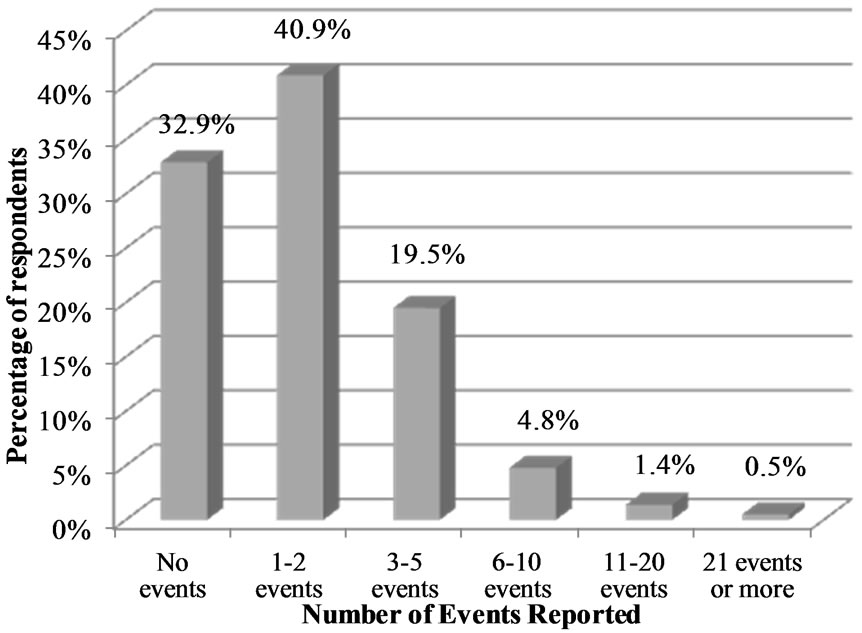
Figure 3. Percentage of respondents reporting event in the past 12 months.
4. DISCUSSION
4.1. Study Result
The main result of this study is that fit of the S-HSOPSC 14 dimensional model and the original HSOPSC 12 dimensional model tested by means of CFA was found to be acceptable. However, the fit values on the S-HSOPSC and the HSOPSC in the Swedish sample, were less favourable than those reported on HSOPSC by other authors [12,16,17,19]. Of the various sources of effect on fit indices, the sensitivity of fit indices to model misspecification, or effect of model misspecification, must be considered. A correct specification hints that a population exactly matches the hypothesized model [30]. In the present study, the sample consisted of three different health care staff (RNs, ENs and physicians) working in general, specialized medical and surgical as well as in mixed departments within one Swedish county council. Both rural and urban areas were represented. In the study by Sorra and Nieva (2004), the sample consisted of all kind of hospital staff, for example pharmacists, radiologists, pathologists, and ancillary staff from across several states in the US [12]. Sample size is another known source of effect on fit indices. Many fit indices have positive associations with sample size i.e. a large sample will more likely exhibit fit values indicating good fit than a small sample [30]. This issue must be considered when model fit is determined. In the present study, the CFA was performed on 569 respondents who had answered all patient safety culture items in the S-HSOPSC, a sample size sufficient for performing CFA [31,32]. This sample size makes a subject-to-variable ratio of 11:1. The corresponding figure in the original study [12] was 32:1, i.e. a larger sample size which might explain their more preferable fit values.
Regarding reliability, the Cronbach’s alpha values for the 12 common dimensions in the S-HSOPSC and the HSOPSC varied between 0.60 and 0.87. The corresponding figures for the two added dimensions in the S-HSOPSC were 0.81 and 0.72 respectively. In total, nine of the 14 dimensions met the established limit of 0.70 indicating acceptable internal consistency [33]. The Cronbach’s alpha values for the remaining five dimensions varied between 0.60 and 0.67. Two of these, “Teamwork Across Hospital Unites” and “Teamwork within Hospital Units” were close to the limit of 0.70. The remaining three dimensions “Staffing”, “Organisational learning-Continuous improvement” and “Communication Openness” had alpha values more close to 0.60. The dimensions “Staffing” [12,13,15,18-20] “Organisational Learning—Continuous Improvement” [15,16,20] and “Communication Openness” [13] were found to have low values also in other studies. This might indicate that these dimensions may consist of some vaguely formulated items.
Further, the results show that patient safety culture from a unit level perspective is perceived as an area of strength whereas those areas in need of improvement were scattered on several levels. Results regarding the health care staff’ perception of patient safety culture showed that manager’s actions and support as well as the learning aspect of patient safety culture are not highly valued by staff. Although almost 60% of the respondents gave their unit a very good or excellent grade more than two thirds reported one or more events the past 12 months.
The Unit Level dimension “Teamwork Within Hospital Units” received the highest percentage positive response, a result similar to many other patient safety culture measurement studies [14,15,21,22]. Teamwork is a strengthening part in developing patient safety [4] and thus, a good team functioning is important when aiming at patient safety improvements. The Unit Level dimensions “Communication Openness” and “Feedback and Communication about Error” were also given high percentage positive response indicating a good patient safety culture, a result in line with earlier research [14,15]. The Unit Level dimension “Hospital Management Support” reflects the more remote hospital management’s support for patient safety. This dimension showed the lowest percentage positive response of all dimensions, a result also shown earlier [14]. In the present study, the dimension “Manager Promoting Safety”, reflecting the nearest manager’s actions to promote safety was scored higher than the more remote hospital management, indicating a perceived greater commitment for patient safety culture in the near workplace unit. These results indicate that hospital management support is insufficient. This lack of confidence in near as well as in remote management is troublesome since management is a key element contributing to a safe culture [7].
In the present study, the dimension “Organisational Learning” showed a percentage positive response not reaching the cutoff indicating patient safety strengths [12]. This dimension consists of items mirroring the organisation’s ability to learn from errors and mistakes and to continuously improve, properties which are cornerstone in a culture characterized by safety [7]. The ability to learn from adverse events and to use event reporting as an agent to approach patient safety has been presented earlier [34]. When an organisation’s and staff’s ability to learn from mistakes in order to improve is underdeveloped, errors and mistakes recur and creates a nonworking problem-solving model leading to less organisational learning and fewer system improvements [35]. Thus, having an organization unwilling to learn and develop is troublesome and calls for actions in order to restore an important factor affecting patient safety.
The item “Patient Safety Grade” indicated that approximately 60% of the respondents assess patient safety to be generally good. More than two thirds of the respondents stated that they had reported one or more events the past 12 months. This is a higher figure than reported in Norway [21], and might be due to increased awareness related to Swedish regulations regarding reporting events which were nationally introduced in conjunction with data collection [36].
4.2. Study Limitations
In the CFA analysis only complete questionnaires i.e. data from respondents who answered all patient safety culture items was analysed (n = 569). If data consists of respondents with items missing, respondents value can either be replaced i.e. imputation or be excluded since information actually is missing for the specific item [29]. In the present study the latter was chosen. In addition, the CFA was also performed on the dataset with missing values replaced by means showing similar results, this is a strength of the study.
Data was collected during a period when several self-report questionnaires were to be answered by all health care staff in the county council. Despite the risk of questionnaire-tiredness, 1117 of 2120 questionnaires were answered making a response rate of 53% which can be seen as average for a questionnaire administered by email [37]. At the time of data collection approximately 2200 (54%) RNs, 1200 (29% ENs and 700 (17%) physicians were employed at the county council. In total 2120 were eligible for the study (RNs 58%, ENs 30%, physicians 12%). The distribution of respondents in the present study corresponds rather well with the eligible sample. In the present study as well as in other studies, RNs are the largest group of respondents [13,15,17-19].
5. CONCLUSIONS AND IMPLICATIONS FOR PRACTICE
The findings from this study indicate the psychometric properties of the S-HSOPSC as acceptable and the questionnaire is considered to be useful for measuring patient safety culture in Swedish hospital settings. It is suitable for clinical and research purposes and allows clinicians and researchers to make cross-national comparisons. Teamwork and communication within the own unit are highly valued but support from both remote and near managers is considered insufficient. The safety was considered to be very good or excellent by 58.9% of the respondents and approximately two thirds had reported one or more events in the past 12 months. In order to improve patient safety and to reduce adverse events it is important for an organization to learn from the events that occurred earlier. Healthcare managers could benefit from using the S-HSOPSC for benchmarking when improving hospital patient safety culture in general and to obtain knowledge about specific areas of improvement e.g. shift-working, staffing and over-occupancy. However, the S-HSOPSC needs to be further validated in larger samples in different regions and in different contexts. Examination of patient safety culture differences between staff groups and factors affecting patient safety culture is also needed in order to obtain knowledge of areas in order to take action to improve safety.
6. ACKNOWLEDGEMENT
The authors would like to thank Jari Appelgren for statistical support.
REFERENCES
- Brennan, T., Leape, L., Laird, N., Hebert, L., Localio, A., Lawthers, A., Newhouse, J.P., Weiler, P.C. and Hiatt, H.H. (1991) Incidence of adverse events and negligence in hospitalized patients: Results of the Harvard Medical Practice Study I. The New England Journal of Medicine, 324, 370-376. http://dx.doi.org/10.1056/NEJM199102073240604
- Davis, P., Lay-Yee, R., Briant, R., Ali, W., Scott, A. and Schug, S. (2002) Adverse events in New Zealand public hospitals I: Occurrence and impact. New Zealand Medical Journal, 115, 271-279.
- Vincent, C., Neale, G. and Woloshynowych, M. (2001) Adverse events in British hospitals: Preliminary retrospective record review. British Medical Journal, 322, 517-519. http://dx.doi.org/10.1136/bmj.322.7285.517
- Kohn, L., Corrigan, J. and Donaldson, M. (2000) To Err is Human: Building a Safer Health System. National Academies Press, Washington DC.
- Pronovost, P., Weast, B., Holzmueller, C, Rosenstein, B.J., Kidwell, R.P., Haller, K.B., Feroli, E.R., Sexton, J.B. and Rubin, H.R. (2003) Evaluation of the culture of safety: Survey of clinicians and managers in an academic medical center. Quality & Safety in Health Care, 12, 405- 410. http://dx.doi.org/10.1136/qhc.12.6.405
- European Union Network for Patient Safety (2006) Use of Patient Safety Culture Instrument and Recommendations. http://ns208606.ovh.net/~extranet/
- Wiegmann, D., Zhang, H., von Thaden, T., Sharma, G. and Mitchell, A. (2004) Safety Culture: An Integrative Review. The International Journal of Aviation Psychology, 14, 117-134. http://dx.doi.org/10.1207/s15327108ijap1402_1
- Zohar, D. (1980) Safety climate in industrial organizations: Theoretical and applied implications. The Journal of Applied Psychology, 65, 96-102. http://dx.doi.org/10.1037/0021-9010.65.1.96
- Sorra, J. and Dyer, N. (2010) Multilevel psychometric properties of the AHRQ hospital survey on patient safety culture. BMC Health Services Research, 10, 199. http://dx.doi.org/10.1186/1472-6963-10-199
- Nieva, V. and Sorra, J. (2003) Safety culture assessment: A tool for improving patient safety in healthcare organizations. Quality & Safety in Health Care, 12, ii17-ii23. http://dx.doi.org/10.1136/qhc.12.suppl_2.ii17
- Colla, J., Bracken, A., Kinney, L. and Weeks, W. (2005) Measuring patient safety climate: A review of surveys. Quality & Safety in Health Care, 14, 364-66. http://dx.doi.org/10.1136/qshc.2005.014217
- Sorra, J. and Nieva, V. (2004) Hospital Survey on Patient Safety Culture. Prepared by Westat under Contract No. 290-96-0004. Agency for Healthcare Research and Quality, Rockville, MD.
- Blegen, M., Gearhart, S., O’Brien, R., Sehgal, N. and Alldredge, B. (2009) AHRQ’s Hospital Survey on Patient Safety Culture: Psychometric Analyses. Journal of Patient Safety, 5, 139-144. http://dx.doi.org/10.1097/PTS.0b013e3181b53f6e
- Hellings, J., Schrooten, W., Klazinga, N. and Vleugels, A. (2007) Challenging patient safety culture: Survey results. International Journal of Health Care Quality Assurance, 20, 620-632. http://dx.doi.org/10.1108/09526860710822752
- Smits, M., Christiaans-Dingelhoff, I., Wagner, C., Wal, G. and Groenewegen, P. (2008) The psychometric properties of the “Hospital Survey on Patient Safety Culture” in Dutch hospitals. BMC Health Services Research, 8, 230. http://dx.doi.org/10.1186/1472-6963-8-230
- Olsen, E. (2008) Reliability and Validity of the Hospital Survey on Patient Safety Culture at a Norwegian Hospital. In: International Quality Improvement Research Network (QIRN), Quality and Safety Improvement Research: Methods and Research Practice, National School of Public Health, Lisbon, 173-186.
- Pfeiffer, Y. and Manser, T. (2010) Development of the German version of the Hospital Survey on Patient Safety Culture: Dimensionality and psychometric properties. Safety Science, 48, 1452-1462. http://dx.doi.org/10.1016/j.ssci.2010.07.002
- Bodur, S. and Filiz, E. (2010) Validity and reliability of Turkish version of “Hospital Survey on Patient Safety Culture” and perception of patient safety in public hospitals in Turkey. BMC Health Services Research, 10, 28. http://dx.doi.org/10.1186/1472-6963-10-28
- Waterson, P., Griffiths, P., Stride, C., Murphy, J. and Hignett, S. (2010) Psychometric properties of the Hospital Survey on Patient Safety Culture: Findings from the UK. Quality & Safety in Health Care, 19, e2. http://dx.doi.org/10.1136/qshc.2008.031625
- Sarac, C., Flin, R., Mearns, K. and Jackson, J. (2011) Hospital survey on patient safety culture: Psychometric analysis on a Scottish sample. BMJ Quality & Safety, 20, 842-848. http://dx.doi.org/10.1136/bmjqs.2010.047720
- Ballangrud, R., Hedelin, B. and Hall-Lord, M.L. (2012) Nurses’ perceptions of patient safety climate in intensive care units: A cross-sectional study. Intensive and Critical Care Nursing, 28, 344-354. http://dx.doi.org/10.1016/j.iccn.2012.01.001
- Chen, C. and Li, H. (2010) Measuring patient safety culture in Taiwan using the Hospital Survey on Patient Safety Culture (HSOPSC). BMC Health Services Research, 10, 152. http://dx.doi.org/10.1186/1472-6963-10-152
- El-Jardali, F., Jaafar, M., Dimassi, H., Jamal, D. and Hamdan, R. (2010) The current state of patient safety culture in Lebanese hospitals: A study at baseline. International Journal for Quality in Health Care, 22, 386-395. http://dx.doi.org/10.1093/intqhc/mzq047
- Smits, M., Wagner, C., Spreeuwenberg, P., van der Wal, G. and Groenewegen, P.P. (2009) Measuring patient safety culture: An assessment of the clustering of responses at unit level and hospital level. Quality & Safety in Health Care, 18, 292-296. http://dx.doi.org/10.1136/qshc.2007.025965
- Wagner, L.M., Capezuti, E. and Rice, J.C. (2009) Nurses’ perceptions of safety culture in long-term care settings. Journal of Nursing Scholarship, 41, 184-192. http://dx.doi.org/10.1111/j.1547-5069.2009.01270.x
- Castle, N., Handler, S., Engberg, J. and Sonon, K. (2007) Nursing home administrators’ opinions of the resident safety culture in nursing homes. Health Care Management Review, 32, 66-76. http://dx.doi.org/10.1097/00004010-200701000-00009
- The National Board of Health and Welfare (2009) To measure patient safety culture: Handbook for patient safety work. The National Board of Health and Welfare, Stockholm (Att mäta patientsäkerhetskulturen. Handbok för patientsäkerhetsarbete).
- The National Board of Health and Welfare (2011) Management Systems for Quality and Patient Safety in Health and Sick Care. The National Board of Health and Welfare, Stockholm (Ledningssystem för kvalitet och patientsä- kerhet i hälsooch sjukvården).
- Hair, J., Anderson, R., Tatham, R. and Black, W. (1998) Multivariate data analysis. 5th Edition, Prentice Hall, New Jersey.
- Hu, L. and Bentler, P. (1998) Fit Indices in Covariance Structure modeling: Sensitivity to underparameterized model misspecification. Psychological Methods, 3, 424- 453. http://dx.doi.org/10.1037/1082-989X.3.4.424
- Kaiser, H. (1960) The application of electronic computers to factor analysis. Educational and Psychological Measurement, 20, 141-151. http://dx.doi.org/10.1177/001316446002000116
- MacCallum, R., Widaman, K., Preacher, K. and Hong, S. (2001) Sample size in factor analysis: The role of model error. Multivariate Behavioral Research, 36, 611-637. http://dx.doi.org/10.1207/S15327906MBR3604_06
- George, D. and Mallery, P. (2003) SPSS for Windows step by step: A simple guide and reference. 11.0 update 4th Edition, Allyn & Bacon, Boston.
- Tuttle, D., Holloway, R., Baird, T., Sheehan, B. and Skelton, W.K. (2004) Electronic reporting to improve patient safety. Quality & Safety in Health Care, 13, 281-286. http://dx.doi.org/10.1136/qshc.2003.009100
- Elder, N., Brungs, S., Nagy, M., Kudel, I. and Render, M. (2010) Intensive care unit nurses’ perceptions of safety after a highly specific safety intervention. Quality & Safety in Health Care, 17, 25-30. http://dx.doi.org/10.1136/qshc.2006.021949
- SFS 2010:659. Patient Safety Act (2010) Government Offices of Sweden. Ministry of Health and Social Affairs, Stockholm (Sveriges Riksdag. Socialdepartementet).
- Baruch, Y. (1999) Response rate in academic studies—A comparative analysis. Human Relations; Studies towards the Integration of the Social Sciences, 52, 421-438.
NOTES
*Corresponding author.