Open Journal of Ecology
Vol. 3 No. 2 (2013) , Article ID: 31238 , 11 pages DOI:10.4236/oje.2013.32015
Estimating plant crown transpiration and water use efficiency by vegetative reflectance indices associated with chlorophyll fluorescence
![]()
1Department of Biological Sciences, California State University, Chico, USA; *Corresponding Author: mwjenkin@ucsc.edu
2Department of Ecology and Evolutionary Biology, University of California, Santa Cruz, USA
3Department of Geological and Environmental Sciences, California State University, Chico, USA
4Department of Earth and Environmental Sciences, East Bay, USA
5Institute for Sustainable Development, California State University, Chico, USA
6Office of the Academic Affairs, California State University, East Bay, USA
Copyright © 2013 Hidenori Furuuchi et al. This is an open access article distributed under the Creative Commons Attribution License, which permits unrestricted use, distribution, and reproduction in any medium, provided the original work is properly cited.
Received 4 January 2013; revised 5 February 2013; accepted 28 February 2013
Keywords: Crown Transpiration; Remote Sensing; Chlorophyll Fluorescence; Reflectance; Quercus lobata
ABSTRACT
This research developed estimates of plant crown transpiration and water-use-efficiency using reflectance and derivative indices extracted from remotely sensed chlorophyll fluorescence measurements under natural conditions. Diurnal changes of leaf-level gas exchange (carbon assimilation rate (A), stomatal conductance (gs), transpiration rate (E), chlorophyll fluorescence and canopy-scale remote sensing were measured on top crown of valley oak (Quercus lobata) in the foothills of central California, USA. The results indicated Q. lobata experienced saturating irradiance (PAR), which induced photoinhibition indicated by a decrease in the quantum efficiency of photosystem II (r2 = 0.648 with  and r2 = 0.73 with (PSII) and open reaction centers (qP; r2 = 0.699). The excess absorbed quantum energy was dissipated as heat through the Xanthophyll cycle and other processes (photorespiration and the water-water cycle) rather than energy emission as steady state chlorophyll fluorescence (Fs). An increase in leaf temperature caused by the activity of Xanthophyll cycle was correlated to a decrease in Fs (r2 = 0.381) and an increase in evaporative cooling through E (r2 = 0.800) and water use efficiency (WUE; r2 = 0.872).
1. INTRODUCTION
Estimation of plant crown transpiration and wateruse-efficiency (WUE) based on remotely sensed vegetative indices has the potential to enhance the study of ecosystem water flux and how species and ecosystems could respond to future climatic induced water stresses. In their Fourth Assessment Report, the Intergovernmental Panel on Climate Change reported that climate change has induced variation in precipitation patterns globally during the last century; some regions such as eastern parts of Northern and South America, northern Europe and northern and central Asia have increased their precipitation while other areas such as the Shale, the Mediterranean, southern Africa and southern Asia have had reductions [1]. Long-term droughts have been observed and have affected agriculture and economic development in some semi-arid and sub-humid regions of the globe including the western U.S. [2]. It is projected that some of current water stressed areas will experience even more severe drought and an increase in the frequency of drought during the 21st century [2,3].
Because the impacts of water stress vary in time, across space and between species, they generate shifts in species abundance of forest vegetation [4]. Water stress also changes vegetative water use patterns, such as WUE. These water stress impacts on vegetation gas exchange play a very significant role in the local to global carbon cycles [5,6]. Therefore, environmental stresses such as, heat, fire and insect stresses or vegetation water status have become the subject of remote sensing studies because spectral indices of vegetation can be informative about plant and ecosystem physiological conditions including atmospheric-terrestrial gas exchange processes.
Spectral reflectance indices commonly used for remote sensing are dependent on photosynthetic pigment concentration and plant water content [6-11]. In addition to these indices, reflectance indices associated with chlorophyll fluorescence have been successively used to estimate photosynthetic activities under heat and drought stress, chlorophyll fluorescence itself is linked to physiological stress in plants [12-17]. Currently, remote estimation of chlorophyll fluorescence has been proposed to integrate the physiological function at the ecosystem scale projecting net primary productivity (NPP). Quantum yield of PSII  and the steady-state fluorescence (Fs) have been proposed for estimating the photosynthetic radiation use efficiency at large scales, suggesting remote sensing of chlorophyll fluorescence parameters as a tool for large scale CO2 flux and transpiretion measurements [12].
In addition to the use of chlorophyll fluorescence for CO2 flux measurements, Flexas et al. (2002) [18] demonstrated that Fs tracked stomatal conductance (gs) rate of field-grown grapevines under drought conditions. However, this experiment was conducted at a single-leaf scale, not at a larger scale such as canopy, stand or ecosystem scale. The usefulness of chlorophyll fluorescence and remote sensing of chlorophyll fluorescence for largescale transpiration is still unclear. This study is an investtigation of physiological responses to environmental stimuli based on seasonal and diurnal observational measurements including micrometeorological data, gas exchange, chlorophyll fluorescence, and remotely sensed reflectance and derivative indices. We suggest means to estimate crown scale transpiration and WUE of a field grown oak tree Quercus lobata (valley oak) using spectral reflectance indices associated with chlorophyll fluorescence.
2. MATERIALS AND METHODS
2.1. Study Site
This experiment was conducted in Big Chico Creek Ecological Reserve (BCCER). BCCER is owned and managed by the Research Foundation of California State University, Chico for the purpose of preserving the critical natural habitat and providing environmental research and educational areas [19]. It is located in the foothills of the Sierra Nevada in the northern portion of the Sacramento Valley about 10 miles northeast of Chico, California, USA. The Reserve ranges in elevation from 213 to 623 feet, with mean precipitation ranging from 64 cm in the valley to 203 cm in the headwater region with hot dry summers and extended periods of limited rainfall. The Reserve includes 7.24 km of Big Chico Creek and encompasses 1599 ha of land. (Latitute 39˚51'51''N Longitude 121˚42'46''W).
2.2. Plant Material
A naturally occurring Quercus lobata (valley oak) with an open crown was selected for the study plant. This oak tree was found in a riparian area, which was located in the canyon of Big Chico Creek, and about 30 m from the creek (Figure 1). The tree had about 90 cm DBH and approximately 20 m height. The measurements including gas exchange, chlorophyll fluorescence and spectral reflectance were conducted on the southwest portion of the crown utilizing a constructed tower at approximately 15 m height.
2.3. Meteorological Measurements
A micrometeorological station was established about 40 m south of the study tree and 30 m from Big Chico Creek for the purpose of monitoring micro meteorological data including solar irradiance, air temperature and relative humidity at 2 m height from the ground (Figure 1). A quantum sensor [20] was mounted on the micro meteorological station. This sensor read global radiation (W∙m−2). The station was equipped with a humidity probe (HMP35A, Waisala Inc., Helsinki, Finland). The probe read relative humidity in percent and a thermistor (UUT51J1, Fenwal Electronics, Toledo, Ohio) was used to observe air temperature in degree Celsius. To utilize the recorded data for this research, specific data (from
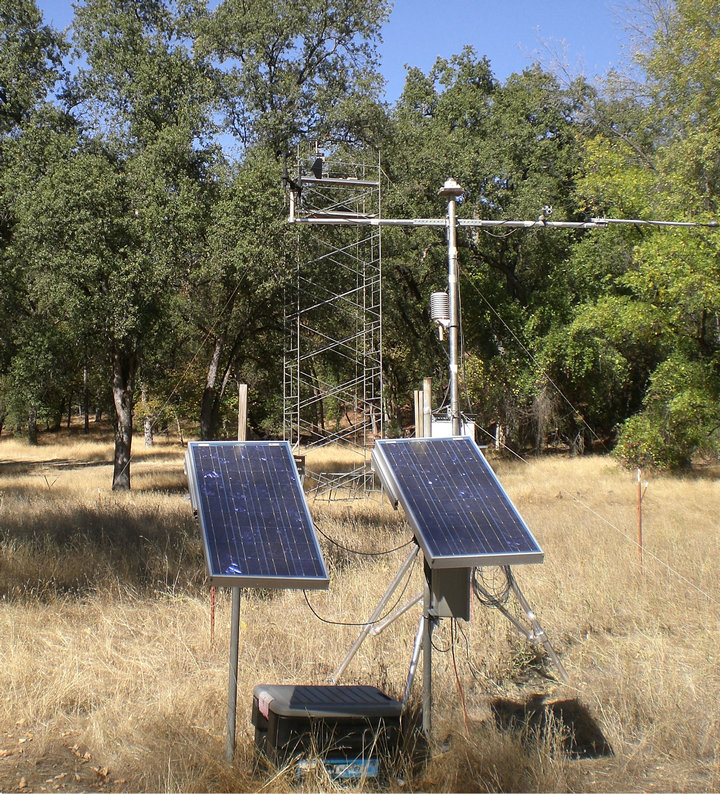
Figure 1. Experimental site at big Chico Creek Ecological Reserve, CA, USA with micrometeorological station, study tower, study tree Quercus lobata (valley oak).
10:30 to 16:30 of experiment days) were read out to Microsoft Excel spread sheets. Time data of gas exchange, chlorophyll fluorescence and spectral reflectance measurements discussed below were modified to match with time data of weather data.
2.4. Gas Exchange and Chlorophyll Fluorescence Measurements
Leaf level gas exchange and chlorophyll fluorescence were measured using LI-COR 6400 infra-red gas analyzer (IRGA) [14] equipped with a leaf chamber fluorometer [20]. Diurnal cycles of gas exchange and chlorophyll fluorescence were taken from 10:30 to 16:30 on September 29th, October 6th, 7th, 28th and November 4th. Intact leaves of the top crown were selected at the beginning of the measurements each day. These leaves were equilibrated prior to measurements. The LI-COR 6400 was programmed to take a sequence of measurements at 20 minute intervals of gas exchange and chlorophyll fluorescence. Gas exchange measurements included carbon assimilation rate (A, µmol CO2 m−2∙s−1), stomatal conductance (gs), (µmol CO2 m−2∙s−1), transpiration rate (E, µmol H2O m−2∙s−1), substomatal CO2 concentration (Ci, µmol CO2 m−2∙s−1), leaf temperature (˚C) and PAR (µmole photon s−1∙m−2).
The chlorophyll fluorescence parameters of steadystate fluorescence (Fs), quantum yield  and max quantum yield
  [21] (Maxwell and Johnson, 2000) were measured along with photochemical quenching (qP), and the fraction of the allocation of absorbed light energy by PSII antenna;
  and
and  [22].
[22].
2.5. Reflectance Measurements
Crown reflectance of Q. lobata was taken with a portable spectrometer (UniSpec-SC, PP Systems, Haverhill, MA). A 2.1 mm diameter fiber optic with an approximate field of view (FOV) of 20˚ was mounted to a measurement station at 1 m height from the top of the crown at the nadir angle of 90˚. The measurement FOV at crownheight was 0.977 m2.
The reflectance measurements were taken simultaneously with gas exchange and chlorophyll fluorescence measurements (every 20 minutes between 10:30 to 16:30). Between the measurements, Unispec-SC was calibrated using a reflectance-standard panel (Spectralon, Labsphere, New Hampshire) and the dark current was corrected for each measurement. Five readings (each composed of 40) scans of reflectance were taken and then averaged. The data were processed with software, Multispec, that interpolated from the original waveband (3.3 nm) of Uni-Spec-SC to 1 nm intervals to yield crown reflectance and derivative spectra and to calculate reflectance and derivative indices.
Reflectance indices used in this study were photochemical reflectance index (PRI) formulated as (R531 − R570)/(R531 + R570) [23], fluorescence ratio indices R690/R600 and R740/R800 [13], curvature index formulated as (R675 × R690)/R6832 [14]. Derivative indices included double-peak index (Dpi) formulated as (D688 × D710)/D692 [17] and derivative chlorophyll indices formulated as D730/D706, D705/D722 and (D705 − D703)/D707 [10].
2.6. Data Analysis
Quadratic regression using a second order polynomial was used to determine relationship between two different measurement variables in this study. Calculated relation values (r2 and p-value) were used to predict a Y-value from an X-value. The data were analyzed with polynomial regression function in scientific data analysis software (SigmaPlot ver. 10.0, Systat Software Inc., San Jose, CA).
3. RESULTS
3.1. Micrometeorological Data
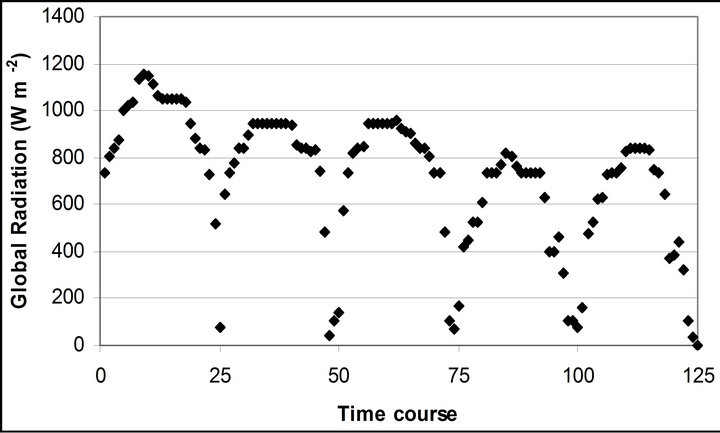
Micrometeorological data revealed a typical pattern of seasonal diurnal cycle. Solar irradiance generally showed a gradual increase before noon and reached its peak between noon and 13:00 (Figure 2(a)). It started decreasing around 14:00 to 15:00. A sudden reduction was observed around 16:00 due to the landscape of the canyon blocking the sunlight shading the quantum sensor. Over the experimental period, a mean solar irradiance (mean ± standard error) dropped from 921.4 ± 46.9 W∙m−2 (September 29th) to 567.1 ± 54.3 W∙m−2 (November 4th). The lowest mean and highest global radiations were observed on October 28th (562.2 ± 46.0 W∙m−2) and September 29th, respectively.
Air temperature and relative humidity followed the diurnal cycle of solar irradiance (Figures 2(b) and (c)). However, the daily mean air temperature slightly increased from 20.4˚C ± 0.5˚C on September 29th to 23.9˚C ± 1.1˚C November 4th. The daily mean relative humidity didn’t change (28.8% ± 1.9% to 28.3% ± 3.5%). The highest mean air temperature (25.8˚C ± 0.6˚C) and relative humidity (34.6% ± 2.0%) were observed on October 28th.
3.2. Diurnal Changes in Leaf Gas Exchange and Chlorophyll Fluorescence
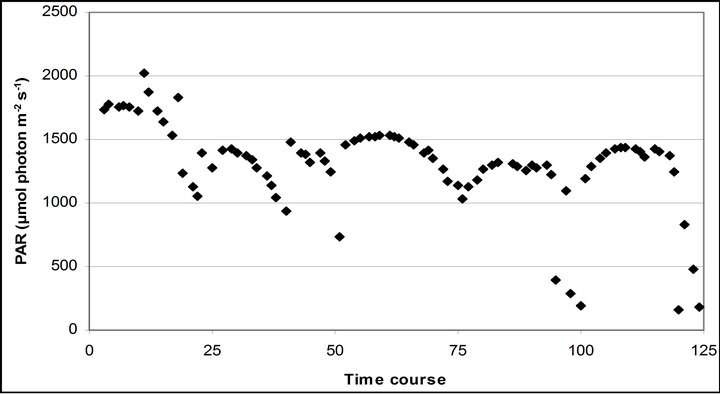
The mean PAR changed from September 29th (1599.1 67.8 µmole photon s−1∙ m−2) to November 4th (1369.6 ± 20.4 µmole photon s−1∙ m−2) (Figure 3). The lowest mean PAR was observed on November 28th (1231.2 ± 24 µmole photon s−1∙ m−2) and September 29th, respectively.
 (a)
(a)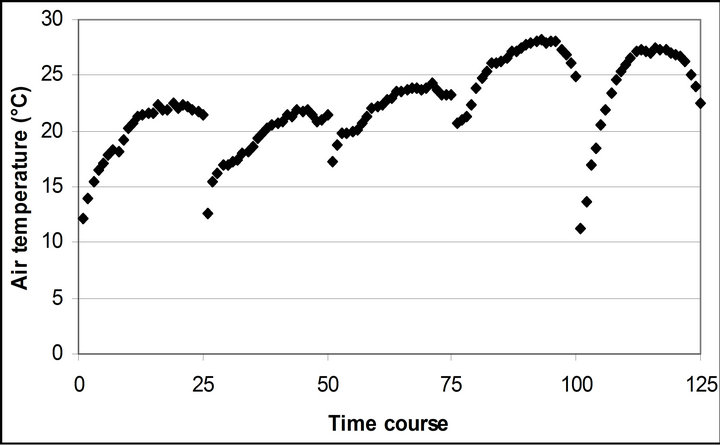 (b)
(b)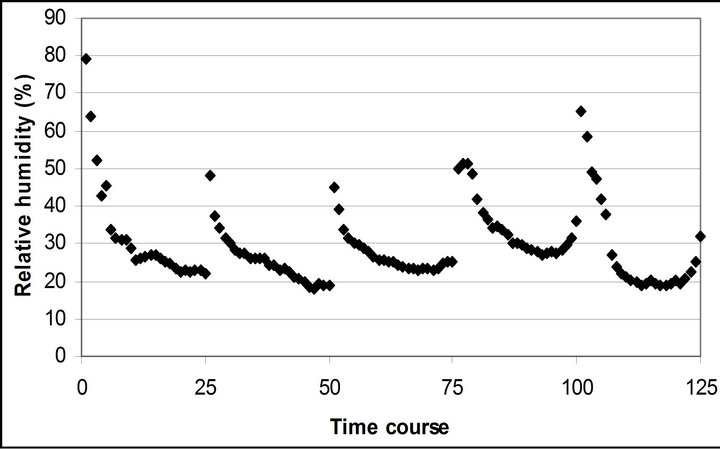 (c)
(c)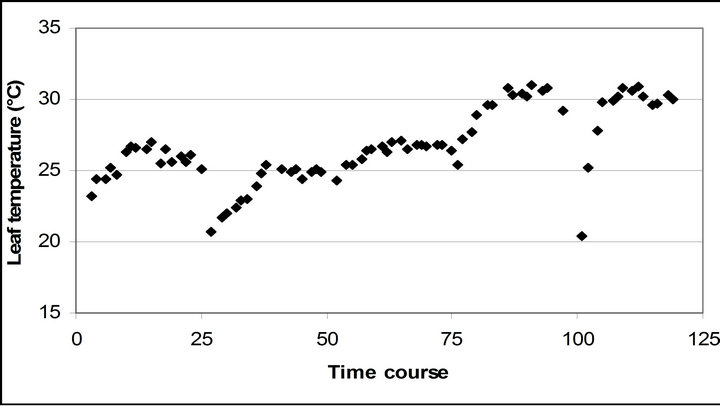 (d)
(d)
Figure 2. (a) Time course measurement of the solar irradiance. Global radiation (W∙m−2) was measured on September 29th, October 6th, 7th, 28th and November 4th. The data point on the graph starts at 10:30 on September 29th and moves to the next data at 15 minutes interval until it reaches 16:30. The other 4 measurement days repeats same graphing pattern. A daily cycle completes with 25 measurement data point. Therefore, September 29th completes its diurnal cycle from Time course number 1 to 25. Time course number 26 to 50, 51 to 75, 76 to 100 and 101 to 125 represents October 6th, 7th, 28th and November 4th; (b) Air temperature (˚C); (c) Relative humidity (%); (d) Leaf temperature (˚C).
 (a)
(a)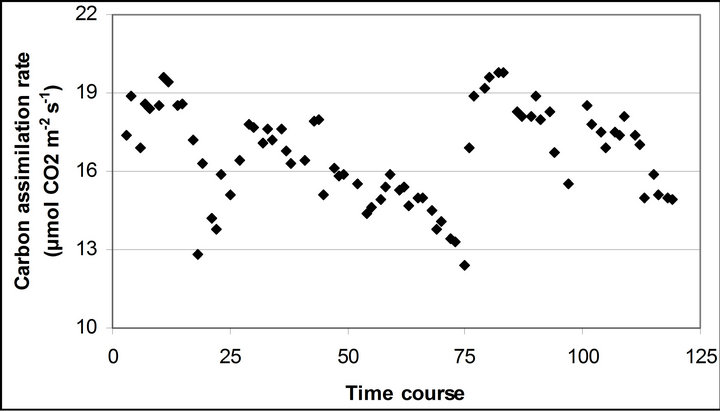 (b)
(b) (c)
(c)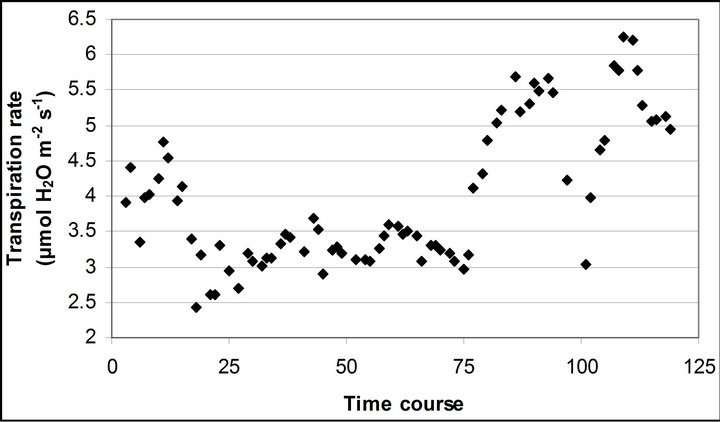 (d)
(d)
Figure 3. (a) Time course measurement of PAR (b) carbon assimilation rate (A) (c) stomatal conductance (gs) (d) transpiration rate (E) monitored with the LI-COR 6400-40 leaf chamber. PAR (μmole photon s−1∙m−2) was measured on September 29th, October 6th, 7th, 28th and November 4th. Graphs are drawn with the same scheme used in Figure 2.
Leaf temperature was significantly related to air temperature (r2 = 0.796, p < 0.001), but had a higher mean temperature than air temperature throughout the measurement (4.5˚C higher than air temperature) (Figure 2(d)).
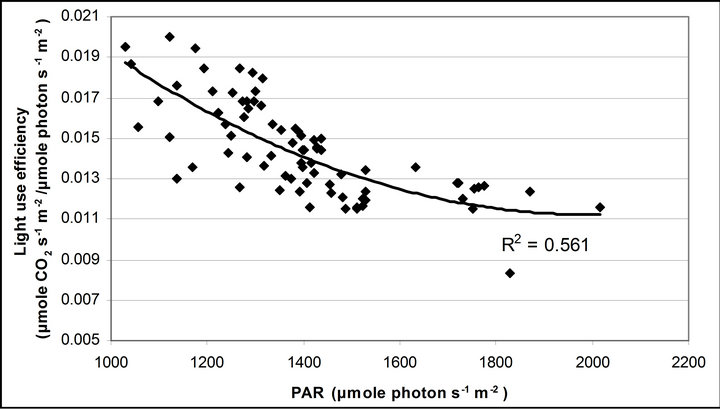
Figure 4 shows time course measurements of WUE and LUE. Figure 5 show regression analysis of PAR with light use efficiency (LUE), chlorophyll fluorescence parameters and the allocation of absorbed light energy by PSII antenna. LUE and chlorophyll fluorescence parameters ( , ΦPSII and qP) had a significant negative correlation with PAR (r2 = 0.561 for LUE, 0.648 for
 , 0.730 for ΦPSII and 0.699 for qP). The allocation of absorbed light energy by PSII antenna showed different responses (Figure 5(c)). Heat dissipation indicated by 1 −
 hada positive correlation with PAR (r2 = 0.648).
  or light energy that was not converted to photochemical energy thermally dissipated increased between 1000 and 1500 µmol photon m−2∙s−1 of PAR and then stopped increasing its allocation at PAR greater than 1500 µmol photon m−2∙s−1 (r2 = 0.648). Fs decreased from 20˚C to 28˚C and then stopped
 (a)
(a)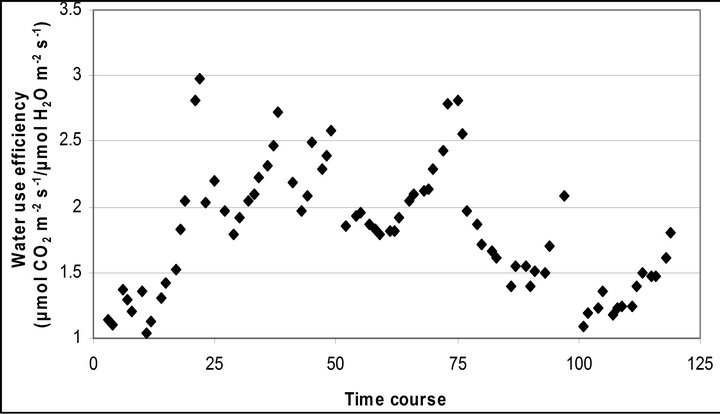 (b)
(b)
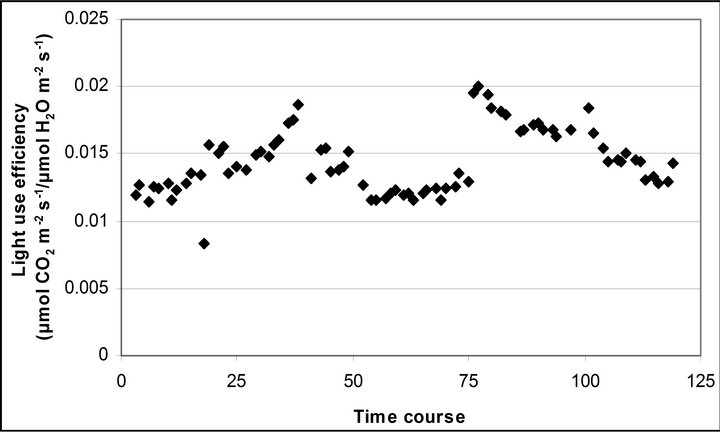
Figure 4. Time course measurement of (a) light use efficiency (LUE) and (b) water use efficiency (WUE). LUE (μmol CO2 m−2∙s−1/μmol photon m−2∙s−1) was calculated based on the assumeption of 84 % absorbance of the incident PAR by the leaf. LUE and WUE (μmol CO2 m−2∙s−1/μmol H2O m−2∙s−1) were measured on September 29th, October 6th, 7th, 28th and November 4th. Graphs are drawn with the same scheme used in Figure 2.
 (a)
(a)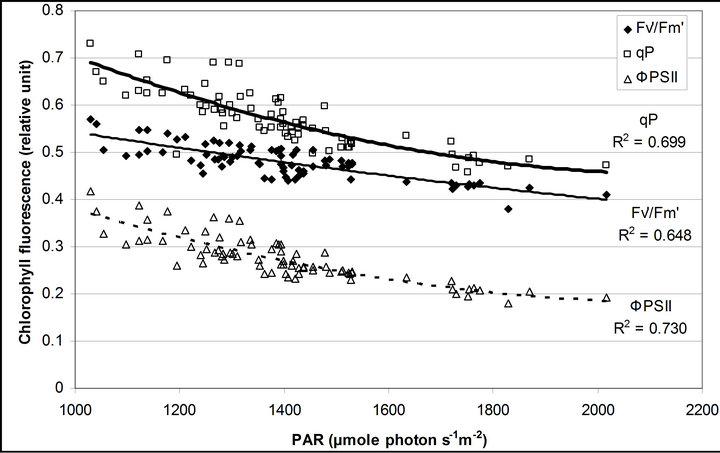 (b)
(b)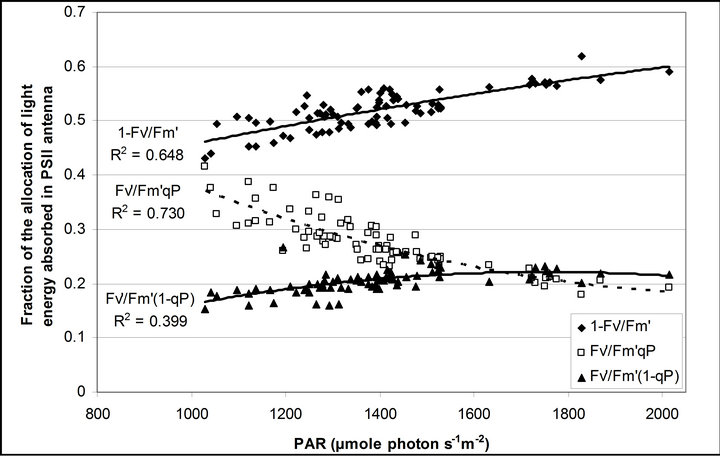 (c)
(c)
Figure 5. (a) Regression analysis between PAR and LUE. All data have P-value < 0.001 (n = 78). (b) Regression analysis of PAR with chlorophyll fluorescence parameters ( , ФPSII and qP) and (c) the fraction of the allocation of absorbed light energy by PSII antenna.
  and
and  stand for the fraction of absorbed light that is dissipated as heat, utilized for photochemistry (same as ФPSII) and excess light energy not dissipated in PSII antenna. The sum of all three fractions at each PAR level becomes 1 (100%). All data have P-value < 0.001 (n = 78).
decreasing at leaf temperature higher than 28˚C (r2 = 0.381). E didn’t show a significant change between 20 and 25˚C, but increased its rate at leaf temperature higher than 25˚C (r2 = 0.800).
Light use efficiency calculated as A divided by PAR, and WUE, A/E, of Q. lobata inversely tracked changes in gs, PAR and leaf temperature (Figure 4). Both LUE and WUE increased their value as stomata started closing. At the same time, leaf temperature yielded its highest values of the day and PAR begun decreasing (Figure 2(d)). Mean and standard error of LUE and WUE were 0.276 ± 0.0055 μmol CO2 m−2∙s−1/μmol photon m−2∙s−1 and 0.0121 ± 0.00022 μmol CO2 m−2∙s−1/μmol H2O m−2∙s−1, respectively. LUE was calculated based on the assumption of 84 % absorbance of the incident PAR by the leaf.
3.3. Remote Sensing Results
Daily mean spectra of crown reflectance and crown derivative are shown are shown in Figure 6. Reflectance and derivative spectra (Dpi) showed changes during the measurements reflecting a decrease in PAR due to the seasonal variance in the solar declination angle. Reflectance spectra exhibited an increase in a xanthophyll related peak centered on 550 nm, and a shift in the red edge toward shorter wavelengths. Derivative spectra revealed an increase in a peak at 700 nm (between 690 and 710), but no change was observed in the peak at 720 nm(between 710 and 730 nm).
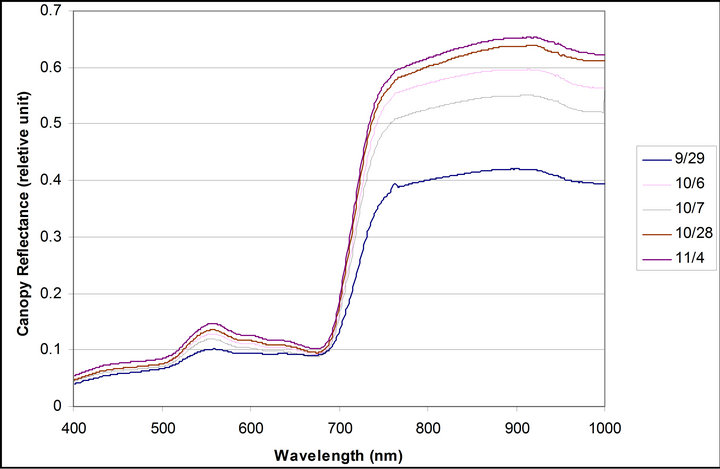
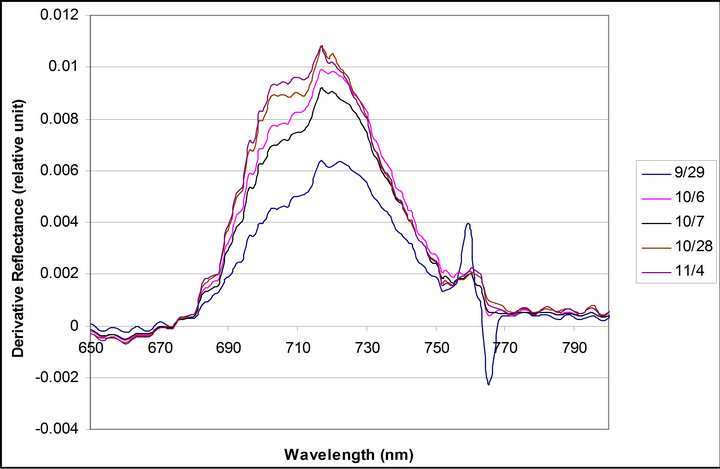
Figure 6. Daily mean spectra of crown reflectance and crownderivative. Daily mean spectra were calculated with data taken from 10:30 to 16:30 each day.
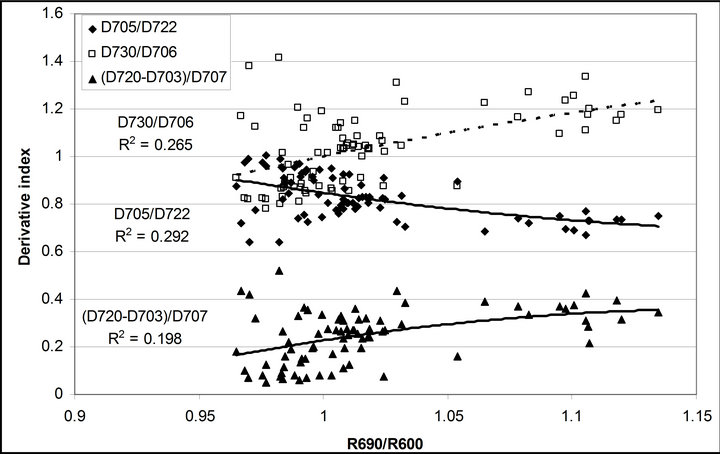
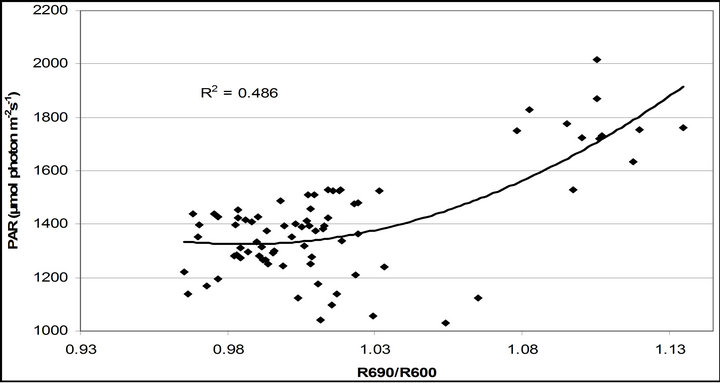
R740/R800 (r2 = 0.292 for D705/D722, 0.265 for Regression analysis between fluorescence ratio indices (FRI), which are R690/R600 and R740/R800, and derivative chlorophyll indices (DCI) including D705/D722, D730/D706 and (D720-D703)/D707 was conducted to determine the linkage of DCIs to chlorophyll fluorescence emission spectra (Figure 7). All three DCIs were significantly correlated to R740/R800 (r2 = 0.731 for D705/ D722, 0.692 for D730/D706 and 0.715 for (D720 − D703)/D707). DCIs were also significantly correlated to R690/R600, but showing poorer linkages than D730/ D706 and 0.198 for (D720 − D703)/D707). These results indicate DCIs are strongly associated with chlorophyll fluorescence emission at 740 nm (F740) rather than 690 nm peak (F690).The fluorescence ratio index (FRI R690/ R600) shows significant correlations with PAR, chlorophyll fluorescence parameters and the allocation of absorbed light energy by PSII antenna (Figure 8). R690/ R600 tracked PAR with a positive correlation (r2 = 0.486) although it didn’t correlate with leaf temperature change (Figure 2(d) and Figure 8(a)). It was weakly correlated to  and
and , ΦPSII or
  ∙ qP (r2 =0.280) and qP (r2 = 0.234) except
 (a)
(a)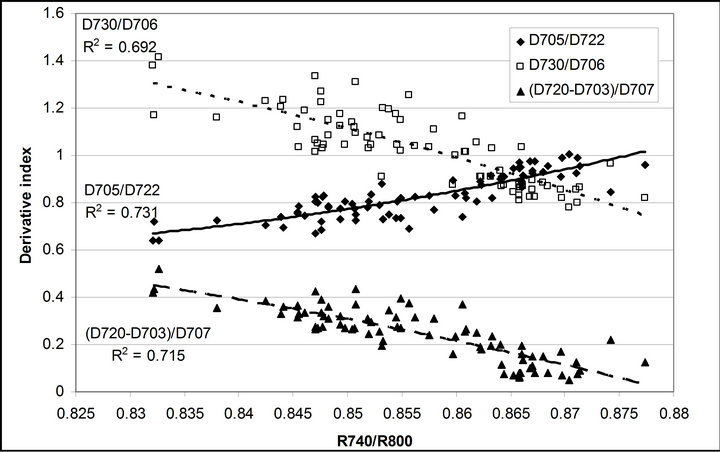 (b)
(b)
Figure 7. Regression analyses of (a) R690/R600 and (b) R740/ R800 with derivative chlorophyll indices including D705/D722, D730/D706 and (D720 − D703)/D707. All data have P-value < 0.001 (n = 78).
 (a)
(a)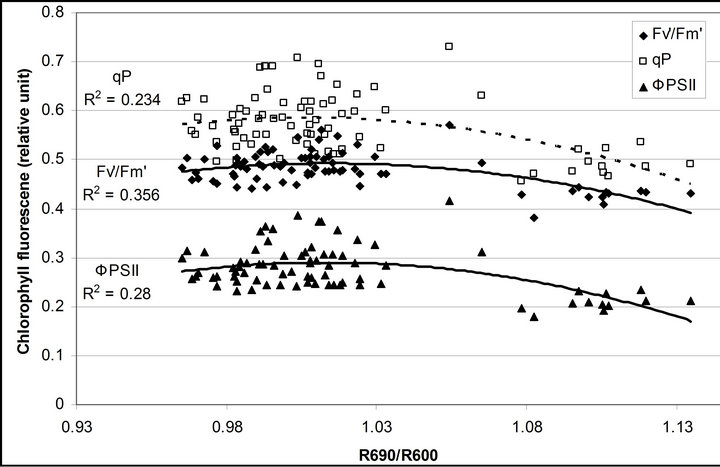 (b)
(b)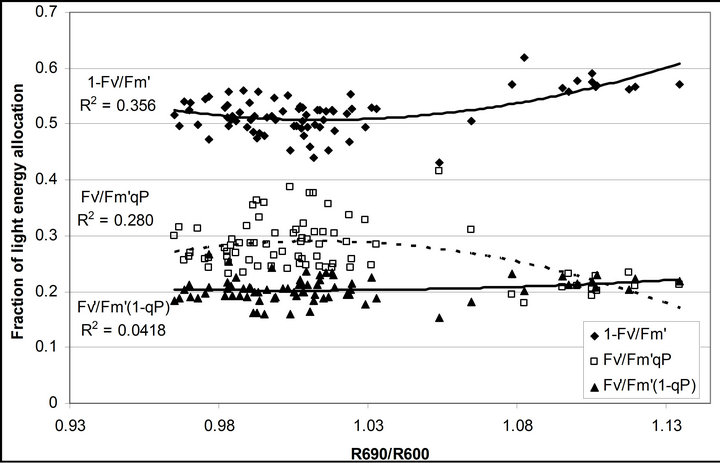 (c)
(c)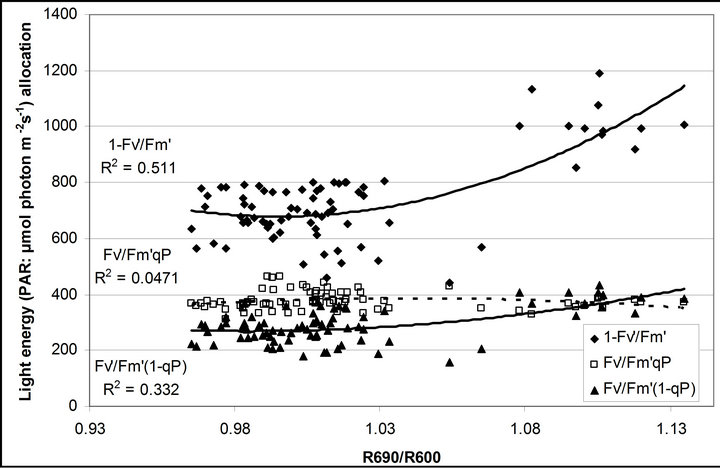 (d)
(d)
Figure 8. Regression analysis of a derivative chlorophyll index, R690/R600, with (a) PAR; (b) chlorophyll fluorescence parameters; (c) the fraction of the allocation of absorbed light energy by PSII antenna and (d) the estimated rate of light energy allocation. All data have P-value < 0.001 (n = 78).
 (Figures 8(b) and (c)). The estimated rate of light energy allocations (in terms of PAR) by PSII was successively tracked by R690/R600 (r2 = 0.595 for PAR × (
 , 0.332 for PAR ×
 (1 − qP)) except the estimation of PAR ×
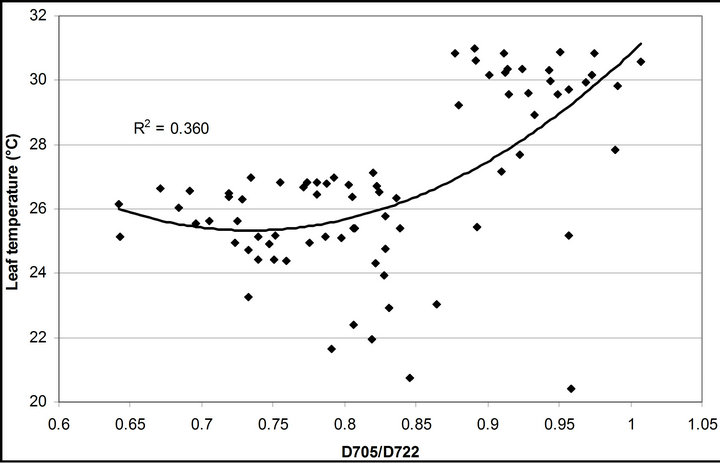
 ∙qP (r2 = 0.0471) (Figure 8(d)). In addition, the index was found to be poorly correlated to physiological responses to leaf temperature changes (Figure 2(d)). Figure 9 shows a regression analysis of D705 /D722 indices. The index had a significant positive correlation to leaf temperature and physiological responses (r2 = 0.292 for leaf temperature, 0.537 for E, 0.501 for gs and 0.712 for Ci/Ca) (Figures 9(a) to (d)). Figures 9(e) and (f) demonstrate a significant correlation between D705/ D722 and commonly used reflectance index: PRI (r2 = 0.785) and water band index or WBI (r2 = 0.595). The other two DCIs yielded similar correlations with these parameters (Table 1). FRI (R740/R800) was strongly correlated to E and gs while it was poorly correlated to leaf temperature, PRI and WBI (Table 1). The indices associated with F740 were found to have very weak
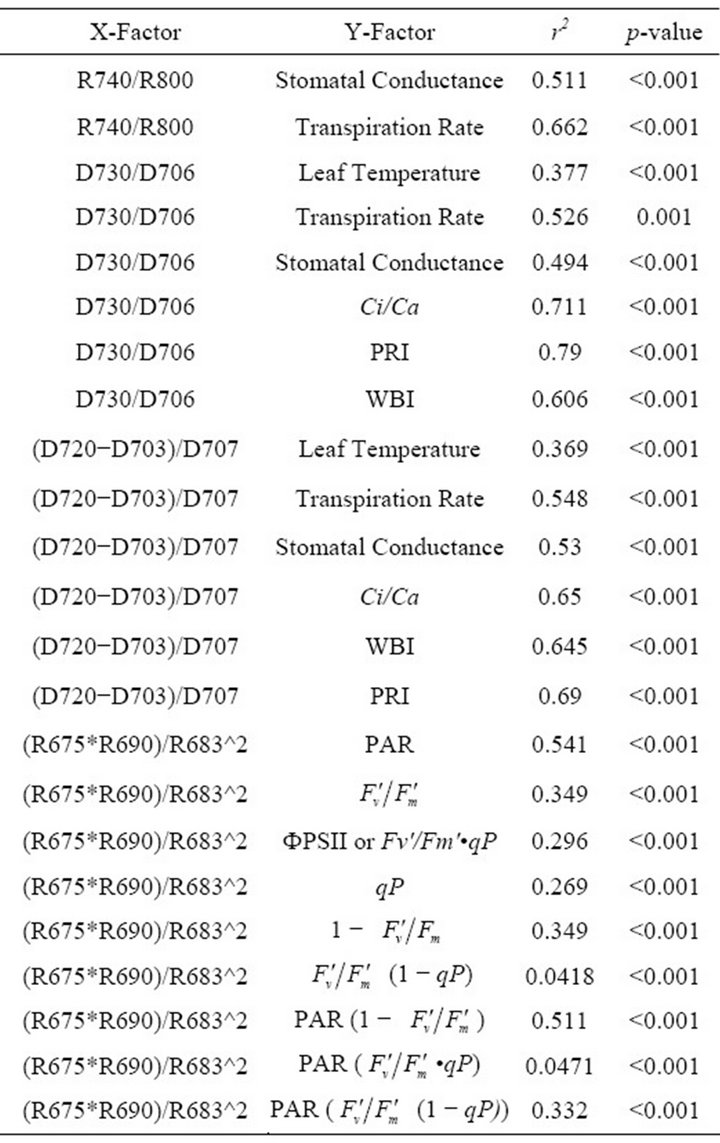
Table 1. Summary of regression analyses between remote sensing and leaf level measurements.
 (a)
(a)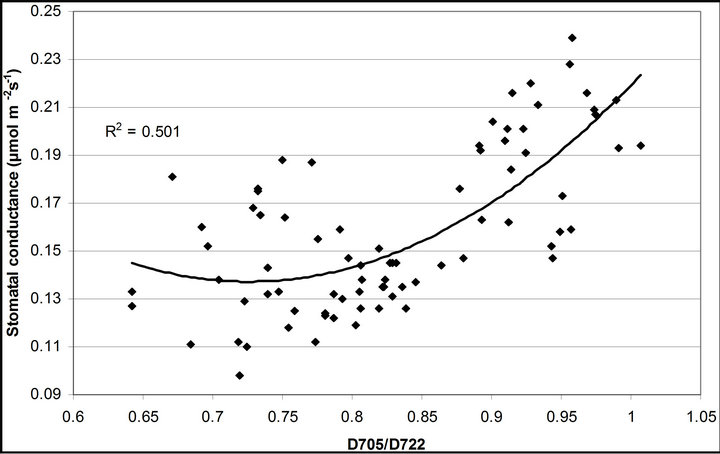 (b)
(b)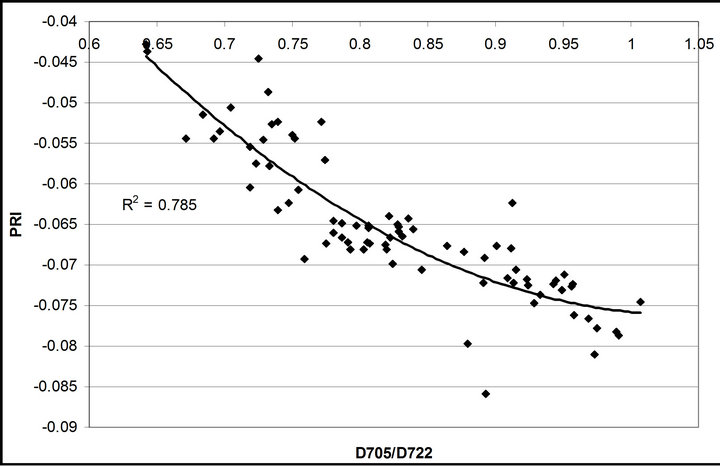 (c)
(c)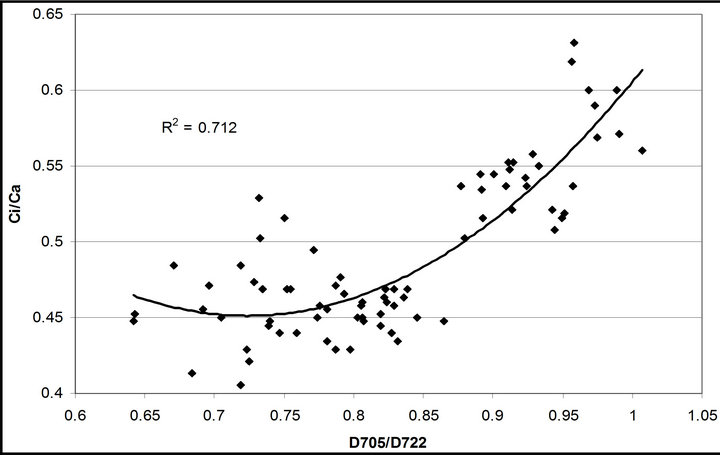 (d)
(d)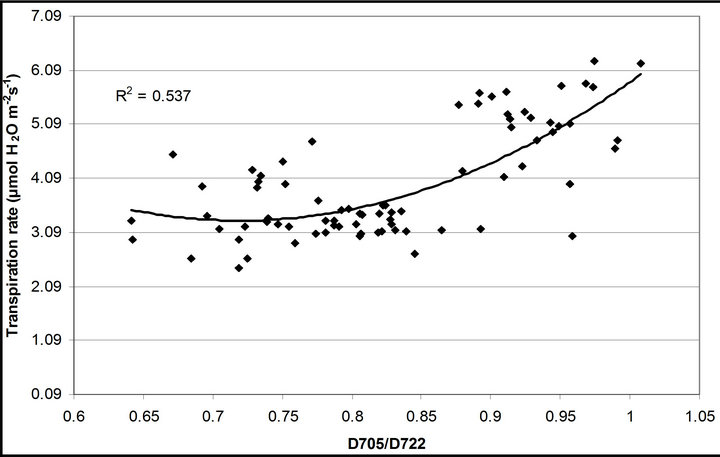 (e)
(e)
Figure 9. Regression analysis of a derivative chlorophyll index, D705/D722, with (a) leaf temperature; (b) transpiration rate; (c) stomatal conductance; (d) Ci/Ca, (e) PRI and (f) water band index (WBI). All data have P-value < 0.001 (n = 78).
linkage to PAR and chlorophyll fluorescence Parameters (data not shown).
Remote estimation of the canopy-scale Fs using these indices was poorly correlated to the leaf-level Fs as expected. The r2-correlation ranged from 0 (R740/R800 and Dpi) to 0.146 ((D720 − D703/D707), 0.156 (R690/ R600), 0.169 ((R675 × R690)/R6832), 0.214 (D730/ D706) and 0.219 (D705/D722). These poor r2-correlations were observed because of the re-positioning of the quantum sensor and the wind breakage of the sample leaf (as described above). Finally, Dpi was observed to have no significant correlation to any leaf-level measurement.
4. DISCUSSION
The diurnal cycle measurement of PAR (Figure 3) revealed that under our regional conditions Q. lobata received higher quantum fluxes than its photosynthetic capacity (500 µmol photon m−2∙s−1) (Figure 3). This indicates Q. lobata experienced excess light stress during the experiment and couldn’t fully utilize all absorbed light energy for photosynthetic activity. Actually, only a small portion (1.51% ± 0.028%) of absorbed light energy was consumed by carbon assimilation in the Calvin cycle while 27.6% ± 0.55% of absorbed quanta was converted to photochemistry by PSII (Figure 6). Also, the result of the regression analyses of PAR with LUE (Figure 6), maximum quantum yield of PSII  and quantum yield of PSII (ΦPSII) (Figure 8(a)) indicate that less absorbed quantum energy was used in carbon assimilation and converted to photochemical energy as light intensity increased. The observed decrease in
  has been suggested to be the result of degradation associated with the D1 protein [25]. The increase in the excess light stress,
  (1 − qP) (Figure 8(b)), has been shown to enhance the formation of damaging singlet oxygen in PSII [22] that is associated with the degradation of the D1 protein [26]. At the same time, the fraction of the light energy dissipated as heat (1 −
 ) had increased (Figure 8(b)). These results suggest that under excess light conditions, most of the quantum energy was dissipated through the xanthophylls cycle.
As a result of the observed increase in heat dissipation of light energy, heat stress was considered to have an inhibitory effect on the Calvin cycle [27] and the accumulation of NADPH that increased the reduced form of plastoquinone (PQ) molecules [28]. Reduced PQ molecules could enhance the cyclic electron transport from ferredoxin to PQ and the proton gradient through the thylakoid membrane [29]. These physiological mechanisms contributed to activate the energy-dependent quenching (qE) [30] and serve to protect PSI from superoxide ions under the high light condition [26]. Joly and Carpentier (2007) [28] reported that the reduction of PQ molecules, caused by the accumulation of NADPH, was induced by the inhibition of Rubisco activase, and decreases the activation states of Rubisco under high leaf temperatures [27], enhanced the energy dissipation in PSI as chlorophyll fluorescence centered around 740 nm (F740-spectrum).
As leaf temperature increased during this experiment (Figure 2), F740-spectrum was demonstrated to increase, as the ratio of Ci/Ca increased suggesting a decrease in Rubisco activity. However, chlorophyll fluorescence emitted from PSII, which was centered around 690 nm (F690-spectrum), was believed to decrease under the high light conditions. These different responses between properties F690 and F740 spectra might be attributed to the measurement with LI-COR 6400-40 which was designed to detect fluorescence emission at 715 nm. Recently, the contribution of F740 spectrum to the total fluorescence spectra at wavelength greater than 700 nm was found to be significant [31-33]. In this experiment the equipment design and chlorophyll fluorescence properties resulted in ecologically strong r2-correlations (0.64 to 0.73) between PAR and chlorophyll fluorescence parameters (Figures 7 and 8). Fluorescence ratio indices (FRI; R690/R600 and R740/R800), curvature index (R675 × R690)/R6832) and derivative chlorophyll indices (DCI; D705/D722, D730/D706 and (D720 − D703)/D707) successfully yielded the remote estimation of the different patterns of F690 and F740 spectra in this experiment. Indices associated with F690-spectrum, R690/R600 and (R675 × R690)/R6832, were found to have linkage to chlorophyll fluorescence parameters measured with LI-COR 6400-40 (Figure 9 and Table 1). This result suggests the use of reflectance indices associated with 690 nm wavelength allows detecting changes in PSII fluorescence. This observation is supported by Zarco-Tejada et al. 2003a and 2003b [17,34]. They reported the direct relationship between PSII-related chlorophyll fluorescence (Fs,  and
and ) measured with PAM-2000 Fluorometer and remote estimation of F690 in laboratory, the field and from aerial sensors under both light-saturating and solar-illumination. However, r2-correlation between these indices and chlorophyll fluorescence parameters yielded weak values. The reason for the weak r2-correlation is considered as following. The gap between the actual irradiance on the crown and the PAR inside the leaf chamber is considered as the cause of weak values of r2-correlation in addition to the contribution of F740-spectra to the total chlorophyll fluorescence and LI-COR 6400-40 design. In addition, an influence of a change in the quality of solar irradiance spectrum due to the seasonal change in the solar zenith angle can be considered to have caused a change in F690 It should be noted that the position of the quantum sensor was re-positioned on October 6th and November 4th due to setting problems and the sample leaf was changed because of accidental leaf break under gusty wind conditions.
It is considered that these problems reduced the accuracy of Fs measurements because chlorophyll fluorescence required longer periods to stabilize than did gas exchange. This fact might have skewed the correlation between leaf-level Fs and both gas exchange measurements and canopy-scale chlorophyll fluorescence. R740/ R800 and DCI, which were associated with F740-spectrum, were significantly correlated with leaf temperature, Ci/Ca, E, PRI and WBI (Figure 9 and Table 1). These reflectance indices successively cycle activity. The relationship between PSI fluorescence and crown transpiretion is not clear. However, both physiological activities are dependent on leaf temperature. These properties of PSI fluorescence and transpiration suggest reflectance indices associated with F740 can be used to estimate crown transpiration (Figure 9 and Table 1). In addition, remote estimation of F740 was found to be not directly dependent on variation in solar irradiance. This indicates the use of F740 spectra is useful to monitor transpiration over a long period such as day-long and season-long. Finally, the linkage of R740/R800 and DCI to PRI and WBI suggests the possible use of these indices in ecosystem scale and flux studies [36-38].
5. CONCLUSIONS
The experimental results presented here demonstrate sun-light induced chlorophyll fluorescence emitted from PSII and PSI are observable using reflectance indices associated with fluorescence peak wavelengths (690 and 740 nm) including fluorescence ratio index (FRI; R690/ R600 and R740/R800), curvature index (R675 × R690)/ R6832) and derivative chlorophyll indices (DCI; D705/ D722, D730/D706 and (D720 − D703)/D707). Measurement data were collected four times using the crown of a mature naturally grown valley oak (Q. lobata) in the field over a one month period. During the experiment, solar irradiance was found to be the super-saturation condition for carbon assimilation of Q. lobata leaves. Changes in solar irradiance induced variations in PSII chlorophyll fluorescence parameters such as  and qP. Theoretically, strong light stress caused enhanced formation of damaging singlet oxygen in PSII [16] that degrade the D1 protein [26], resulting in decreases in PSII fluorescence. This phenomenon was observed at both leaf and crown scale using indices associated with F690 spectrum (r2 = 0.35)
At the same time, most of absorbed photon energy was considered to be dissipated as heat energy. Increases in leaf temperature decrease Rubisco activity inducing increases in the Ci/Ca ratio, accumulation of NADPH and reduction of PQ molecule. This physiology contributes to increases in PSI fluorescence emission [28]. Results of crown scale measurements revealed variations in PSI fluorescence can be observed using reflectance indices associated with F740 (r2 = 0.360 to 0.377). Also, the same reflectance indices were found to be useful in estimating stomatal conductance (r2 = 0.494 to 0.511) and transpiration (r2 = 0.537 to 0.662) because both F740 spectrum and these physiological responses were under the influence of leaf temperature mediated through Xanthophyll cycle, not change in solar irradiance quality.
The above results demonstrate the potential use of reflectance indices based on chlorophyll fluorescence peaks for crown scale detections of plant physiological responses to natural environment, especially solar irradiance. The concluding remark of this paper suggests that crown scale transpiration can be monitored through remote estimation of PSI fluorescence over the season and can be expanded from crown scale to landscape scale according to the strong linkages to PRI and WBI. In addition, the results of this paper will contribute to chlorophyll fluorescence measurement from satellite platform for the use of estimating large scale transpiration.
![]()
![]()
REFERENCES
- IPCC (2007) Summary for policymakers. In: Solomon, S., Qin, D., Manning, M., Chen, Z., Marquis, M., Averyt, K.B., Tignor, M. and Miller, H.L., Eds., Climate Change 2007: The Physical Science Basis. Contribution of Working Group I to the Fourth Assessment Report of the Intergovernmental Panel on Climate Change, Cambridge University Press, Cambridge, 16-17.
- Kundzewicz, Z.W., Mata, L.J., Arnell, N.W., Döll, P., Kabat, P., Jiménez, B., Miller, K.A., Oki, T., Şen, Z. and Shiklomanov, I.A. (2007) Freshwater resources and their management. In: Parry, M.L., Canaziani, O.F., Palutikof, J.P., van der Linden, P.J. and Hanson, C.E., Eds., Climate Change 2007: Impacts, Adaptation and Vulnerability. Contribution of Working Group II to the Fourth Assessment Report of the Intergovernmental Panel on Climate Change, Cambridge University Press, Cambridge, 173- 210.
- IPCC (2007) Summary for policymakers. In: Parry, M.L., Canziani, O.F., Palutikof, J.P., van der Linden, P.J. and Hanson, C.E., Eds., Climate Change 2007: Impacts, Adaptation and Vulnerability. Contribution of Working Group II to the Fourth Assessment Report of the Intergovernmental Panel on Climate Change, Cambridge University Press, Cambridge, 7-22.
- Gray, S.T., Betancourt, J.L., Jackson, S.T. and Eddy, R.G. (2006) Role of multidecadal climate variability in a range extension of pinyon pine. ESA, 87, 1124-1130.
- Haxeltine, A., Prentice, I.C. and Creswell, I.D. (1996) A coupled carbon and water flux model to predict vegetation structure. Journal of Vegetation Science, 7, 651-666. doi:10.2307/3236377
- Montaldo, N., Albertson, J.D. and Mancini, M. (2008) Vegetation dynamics and soil water balance in a water-limited Mediterranean Ecosystem on Sardinia, Italy. Hydrol. Hydrology and Earth System Sciences Discussions, 5, 219-255. doi:10.5194/hessd-5-219-2008
- Gamon, J.A., Serrano, L. and Surfus, J.S. (1997) The photochemical reflectance index: An optical indicator of photosynthetic radiation use efficiency across species, functional types, and nutrient levels. Oecologia, 112, 492- 501. doi:10.1007/s004420050337
- Gamon, J.A. and Surfus, J.S. (1999) Assessing leaf pigment content and activity with a reflectometer. New Phytologist, 143, 105-117. doi:10.1046/j.1469-8137.1999.00424.x
- Peñuelas, J. and Filella, I. (1998) Visible and near-infrared reflectance techniques for diagnosing plant physiological status. Trends in Plant Science, 3, 151-156. doi:10.1016/S1360-1385(98)01213-8
- Sims, D. and Gamon, J.A. (2002) Relationships between leaf pigment content and spectral reflectance across a wide range of species, leaf structures and developmental stages. Remote Sensing of Environment, 81, 337-354. doi:10.1016/S0034-4257(02)00010-X
- Stimson, H.C., Breshears, D.D., Ustin, S.L. and Kefauver, S.C. (2005) Spectral sensing of foliar water conditions in two co-occurring conifer species: Pinusedulis and Juniperusmonosperma. Remote sensing of Environment, 96, 108-118.
- Cavender-Bares, J. and Bazzaz, F.A. (2004) From leaves to ecosystems: Using chlorophyll fluorescence to assess photosynthesis and plant function in ecological studies. Advances in Photosynthesis and Respiration, 19, 737- 755.
- Dobrowski, S.Z., Pushnik, J.C., Zarco-Tejada, P.J. and Ustin, S. (2005) Simple reflectance indices track heat and water stress-induced changes in steady-state chlorophyll fluorescence at the crownscale. Remote Sensing of Environment, 97, 403-414. doi:10.1016/j.rse.2005.05.006
- Zarco-Tejada, P.J., Miller, J.R., Mohammed, G. H. and Noland, T.L. (2000) Chlorophyll fluorescence effects on vegetative apparent reflectance: I. Leaf-level measurements and model simulation. Remote Sensing of Environment, 74, 582-595. doi:10.1016/S0034-4257(00)00148-6
- Zarco-Tejada, P.J., Miller, J.R., Mohammed, G. H., Noland, T.L. and Sampson, P.H. (2000) Chlorophyll fluorescence effects on vegetative apparent reflectance: II. Laboratory and airborne canopy-level measurements with hyperspectral data. Remote Sensing of Environment, 74, 596-608. doi:10.1016/S0034-4257(00)00149-8
- Zarco-Tejada, P.J., Miller, J.R., Mohammed, G. H., Noland, T.L. and Sampson, P.H. (2002) Vegetation stress stress detection through chlorophyll a + b estimation and fluorescence effects on hyperspectral imagery. Journal of Environmental Quality, 31, 1433-1411. doi:10.2134/jeq2002.1433
- Zarco-Tejada, P.J., Pushnik, J.C., Dobrowski, S.Z. and Ustin, S.L. (2003) Steady-state chlorophyll a fluorescence detection from crown derivative reflectance and double-peak red-edge effects. Remote Sensing of Environment, 84, 283-294. doi:10.1016/S0034-4257(02)00113-X
- Flexas, J., Escalona, J.M., Evain, S., Gulias, J., Moya, I., Osmond, C.B. and Medrano, H. (2002) Steady-state chlorophyll fluorescence (Fs) measurements as a tool to follow variations of net CO2 assimilation and stomatal conductance during water-stress in C-3 plants. Physiologia Plantarum, 114, 231-240. doi:10.1034/j.1399-3054.2002.1140209.x
- California State University (2008) Big Chico Creek Ecological Reserve. http://www.csuchico.edu/bccer/
- LI-COR Biosciences, Inc. (2004) Using the LI-6400 portable photosynthesis system. LI-COR Biosciences, Inc., Lincoln.
- Maxwell, K. and Johnson, G.N. (2000) Chlorophyll fluorescence-A practical guide. Journal of Experimental Botany, 345, 659-668. doi:10.1093/jexbot/51.345.659
- Demmig-Adams, B. and Adams, W.W. III. (1992) Photoprotection and other responses of plants to high light stress. Annual Review of Plant Physiology and Plant Molecular Biology, 43, 599-626. doi:10.1146/annurev.pp.43.060192.003123
- Wellburn, A.R. (1994) The spectral determination of chlorophylls a and b, as well as total carotinoids using various solvents with spectrophotometers of different resolutions. Journal of Plant Physiology, 144, 307-313. doi:10.1016/S0176-1617(11)81192-2
- Gamon, J.A., Peñuelas, J. and Field, C.B. (1992) A narrow-waveband spectral index that tracks diurnal changes in photosynthetic efficiency. Remote Sensing of Environment, 41, 35-44. doi:10.1016/0034-4257(92)90059-S
- Bertamini, M. and Nedunchezhian, N. (2003) Photoinhibition of photosynthesis in mature and young leaves of grapevine (Vitisvinifera L.). Plant Science, 164, 635-644. doi:10.1016/S0168-9452(03)00018-9
- Kruk, J., Holländer-Czytko, H., Oettmeier, W. and Trest, A. (2005) Tocopherol as singlet oxygen scavenger in photosystem II. Journal of Plant Physiology, 162, 749- 757. doi:10.1016/j.jplph.2005.04.020
- Law, D. and Crafts-Brandner, S.J. (1999) Inhibition and acclimation of photosynthesis to heat stress is closely correlated with activation of ribulose-1,5-bisposphate carboxylase/oxygenase. Plant Physiology, 120, 173-182. doi:10.1104/pp.120.1.173
- Joly, D. and Carpentier, R. (2007) Regulation of energy dissipation in photosystem I by the redox state of the plastquinone pool. Biochemistry, 46, 5534-5541. doi:10.1021/bi602627d
- Kühlbrandt, W. (2003) Structural biology: Dual approach to a light problem. Nature, 426, 399-400. doi:10.1038/426399a
- Miyake, C., Horiguchi, S., Makino, A., Shinzaki, Y., Yamamoto, H. and Tomizawa, K. (2005) Effects of light intensity on cyclic electron flow around PSI and its relationship to non-photochemical quenching of chl fluorescence in tobacco leaves. Plant and Cell Physiology, 46, 1819-1830. doi:10.1093/pcp/pci197
- Agati, G., Cerovic, Z.G. and Moya, I. (2000) The effect of decreasing temperature up to chilling values on the in vivo F685/F735 chlorophyll fluorescence ratio in phaseolus vulgaris and pisumsativum: The role of the Photosystem I contribution to the 735 nm fluorescence band. Photochemistry and Photobiology, 72, 75-84. doi:10.1562/0031-8655(2000)072<0075:TEODTU>2.0.CO;2
- Peterson, R.B., Oja, J. and Laisk, A. (2001) Chlorophyll fluorescence at 680 and 730 nm and leaf photosynthesis. Photosynthesis Research, 70, 185-196. doi:10.1023/A:1017952500015
- Pfündel, E. (1998) Estimating the contribution of photosystem I to total leaf chlorophyll fluorescence. Photosynthesis Research, 56, 185-195. doi:10.1023/A:1006032804606
- Zarco-Tejada, P.J., Rueda, C.A. and Ustin, S.L. (2003) Water content estimation in vegetation with MODIS reflectance data and model inversion methods. Remote Sensing of Environment, 85, 109-124. doi:10.1016/S0034-4257(02)00197-9
- Lichtenhaler, H.K. and Rinderle, U. (1988) The role of chlorophyll fluorescence in the detection of stress conditions in plants. CRC Critical Reviews in Analytical Chemistry, 19, 29-85. doi:10.1080/15476510.1988.10401466
- Claudio, H.C., Cheng, Y., Fuentes, D.A., Gamon, J.A., Luo, H., Oechel, W., Qiu, H.L., Rahman, A.F. and Sims, D.A. (2006) Monitoring drought effects on vegetation water content and fluxes in chaparral with the 970 nm water band index. Remote Sensing of Environment, 103, 304-311. doi:10.1016/j.rse.2005.07.015
- Gamon, J.A., Rahman, A.F., Dungan, J.L., Schildhauer, M. and Huemmrich, K.F. (2006) Spectral Network (SpecNet)—What is it and why do we need it? Remote Sensing of Environment, 103, 227-235. doi:10.1016/j.rse.2006.04.003
- Nichol, C.J., Huemmrich, K.F., Black, T.A., Jarvis, P.G., Walthall, C.L., Grace, J. and Hall, F.G. (2000) Remote sensing of photosynthetic-light-use-efficiency of boreal forest. Agricultural and Forest Meteorology, 101, 131- 142. doi:10.1016/S0168-1923(99)00167-7