Open Journal of Ecology
Vol.2 No.4(2012), Article ID:24909,4 pages DOI:10.4236/oje.2012.24025
The influence of altitude and management on carbon stock quantities in rungwe forest, southern highland of Tanzania
![]()
Institute of Resource Assessment, University of Dar es Salaam, Dar es Salaam, Tanzania; *Corresponding Author: amajule@ira.udsm.ac.tz
Received 17 May 2012; revised 4 July 2012; accepted 14 July 2012
Keywords: Altitude; Forest; Carbon Stock; Rungwe; Soil
ABSTRACT
A study was conducted to assess the impacts of elevation, tree species and management on carbon stock on the slopes of Rungwe Mountain in Tanzania. Twenty 15 m radius plots with trees of DBH >10 cm were used to collect trees measurements as well as soil samples at depths of 10 cm, 20 cm and 30 cm. Tree data collected were calculated and analyzed for tree biomass and carbon by using the Tree Biomass Equations (TBE) while soil samples were analyzed for total soil carbon using oxidative reduction method in which soils were combusted at about 600˚C in a muffle furnace to released CO2 and SO2 gases carried by the oxygen flow into cells. The results showed that aboveground carbon content increased with altitude ranging from 9.2 t/ha at 2031 m to 561.7 t/ha at 2312 m.a.s.l due to little forest disturbance at high altitudes. However, the trend changed drastically at 2312 m.a.s.l. Soil carbon content tended to increase down the slope ranging from 3.8 t/ha at 2.312 to 4.7 t/ha at 2031 m.a.s.l, respectively. In general, there is limited awareness on sustainable management of forest resource in the study area. It is necessary to empower local communities to monitor and manage their forest resources so that they can contribute to climate change mitigation and income generation through carbon trade under REDD initiative.
1. INTRODUCTION
Deforestation in the tropics is a major source of carbon emissions and an active contributor to global warming. The Intergovernmental Panel on Climate Change (IPCC) estimates that 1.7 billion tons of carbon is released annually due to land use change, the majority of which is tropical deforestation (MacDicken, 1997; IPCC, 2005) [1,2]. In Africa, for example, deforestation accounts for nearly 70% of total emissions (FAO, 2005) [3] while in Tanzania various sources has reported about the forest depletion and degradation (Kangalawe et al., 2005; Majule et al., 2010) [4,5] contributing to almost 20% of the total emission. Carbon circulates among the oceans; terrestrial biosphere and atmosphere, in addition to human activities, such as fuel combustion and deforestation affect the carbon dioxide (CO2) concentration in the atmosphere (Lehtonen, 2005) [6]. Forests are also the largest terrestrial reservoir for atmospheric carbon because they remove CO2 from the atmosphere and store it in the soil litter, trees and other organic matter. The current carbon stored in tree biomass comprises half of the atmospheric storage and is continuing to grow despite deforestation, the rate of which is decreasing but still high.
The amount of carbon stored in a forest stand depends on its age, tree species, the location of forests on a landscape and management practices imposed. However, much attention has also to be paid to the human development activities such as cultivation of crop, collection of fire woods, cutting down of trees for charcoal and timber which involves clearing of forest’s trees which reduces the amount of carbon in a particular forest stand. These activities result in the emission of greenhouse gases (GHG), such as CO2, NOx and CH4 in the atmosphere that contributes considerably to global warming (IPCC, 1995) [2]. Human activities which lead to loss of forests are significant contributing factor in climate change. Therefore, one possible strategy to reduce GHG with great potential is to use forest to sequester CO2 by improving the management of forest resources. Efforts should therefore be put in expanding carbon storage in forests which has been identified as a potential measure to mitigate climate change (Prentice et al., 2000) [7].
Different studies indicate that forests store different amounts of carbon in defined pools including aboveground biomass carbon (AGB), below ground biomass carbon (BGB), leaf litter (fine necromas), dead woody (coarse woody necromas) and soil organic matter carbon (SOC). It is clearly known that the changes in forestland affect the carbon stock of a particular forest and hence the annual carbon storage and average carbon density (Rowell, 1994) [8]. However, Gibbs et al. (2007) [9] discussed the important options of estimating national-level forest biomass carbon stocks in developing countries and proposed methods to link forest carbon and deforestation estimates. According to Munishi and Shirima (2009) [10] unpublished report, carbon stored in trees shows significant variation with elevation, species composition and management practices imposed.
In Tanzania, carbon stock assessment is a recent practice which has been adopted recently according to Kyoto protocol (1997) by establishment of the National Forest Monitoring and Assessment (NAFORMA). In the last 30 years sub national inventories for different parts of the country have been carried out for only particular purposes. There are also limited complementing studies including those of Uruguru Nature Reserve in Morogoro region and Chome Nature Reserve in Kilimanjoro region conducted by Munishi and Shirima (2010) [10]. More studies are still needed to be done in order to effectively implement REDD initiative in Tanzania.
This study measured the aboveground tree biomass and soil organic carbon down the slope of Mount Rungwe in order to determine the variation in carbon stock with elevation, tree composition and management practices imposed.
2. RESEARCH METHODOLOGY
2.1. Description of the Study Area
The study was conducted in the southern highland areas of Tanzania in Rungwe Mountain located in Mbeya region (Figure 1). The area is located between latitudes 8˚30'S and 9˚30'S and longitudes 33˚E and 34˚E in southwest Tanzania (Majule, 2010) [5]. The Mountain is associated with a belt of forest which dominates the mountainous country north-west of Lake Nyasa. The Mountain has an extensive stands of bamboo in some forests and a belt of moor land above 2600 m.a.s.l.
The climate in Rungwe district is generally tropical, with marked seasons and sharply defined dry and wet seasons. It experiences adequate rainfall throughout the year. The average rainfall ranges from 900 mm in the lowland zone to 2700 mm in the highland zone. The rains normally start in October and end in May followed by dry and cold spell between June and September. Mean annual temperature averages range between 16˚C in the highlands and 25˚C in the lowland areas [5].
According to Majule (2010) [5], the soil in Rungwe district is mainly volcanic in nature mostly in the upper and mid altitudes covered with thick layers of volcanic and alkali basalt. The lower altitude consists of limestone lacustrine rocks, and in arable areas soils are most commonly of moderate fertility with coarse and medium texture varying from sandy loams, alluvial soils to cracking clays (Muganyizi, 2009) [11].
2.1.1. Assessment of Carbon Stock
Circular plots were preferred than rectangular plots since they are easy and simple to layout and measure. They also ensure that small trees are measured in small plots and large trees (which constitute most of the biomass per unit area) are measured in large plots. In each stratum, concentric plots of about 15 m radius were established aiming at increasing the accuracy of the measurement and intensity sampling (see Munishi and Shirima, 2009) [10]. In 15 m diameter plots both trees with DBH ≥ 10 cm were measured accordingly and for trees forking below 1.3 m from the ground, each stem was treated as an individual tree.
Tree and stem numbers in case of a forked tree, species name, DBH at 1.3 m above the ground total height and elevation were taken and also their health status was assessed. GPS coordinates of the tree that mark the centre of the plot and tree origin were then recorded for all trees following a procedure adopted by Munishi and Shirima (2009) [10].
2.1.2. Assessment of Soil Carbon
Soil samples were collected at the 1st and 3rd plot outside of the border of the sampling plot at four points of the sampling plot i.e., north, south, east and west to a depth of 30 cm. At each selected soil sampling plot, four points or sites were identified located at main compass points east, south, west and north (Figure 2). Soil sampling and analysis were done by following a procedure outlined for total carbon analysis by Rowell (1994) [8]. In this case, organic carbon content was analyzed in the laboratory by oxidative reduction in which the soils were combusted at about 600 C using Muffle furnace to released CO2 and SO2 which is carried by the oxygen flow into cells and analyzed to its weights by using an electron balance or Analyzer balance of max 230 g and standard error (d) = 0.1 mg.
2.1.3. Measurements of Dead Wood
Dead woods are tree parts that are lying on the ground. Dead woody parts found inside the plot area within the radius of 15 were identified. The length and diameter at both ends of all pieces of fallen wood with diameter larger than equals to 5 cm within the plot area were measured. Measurements of length were made to the plot border as indicated in Figure 3.
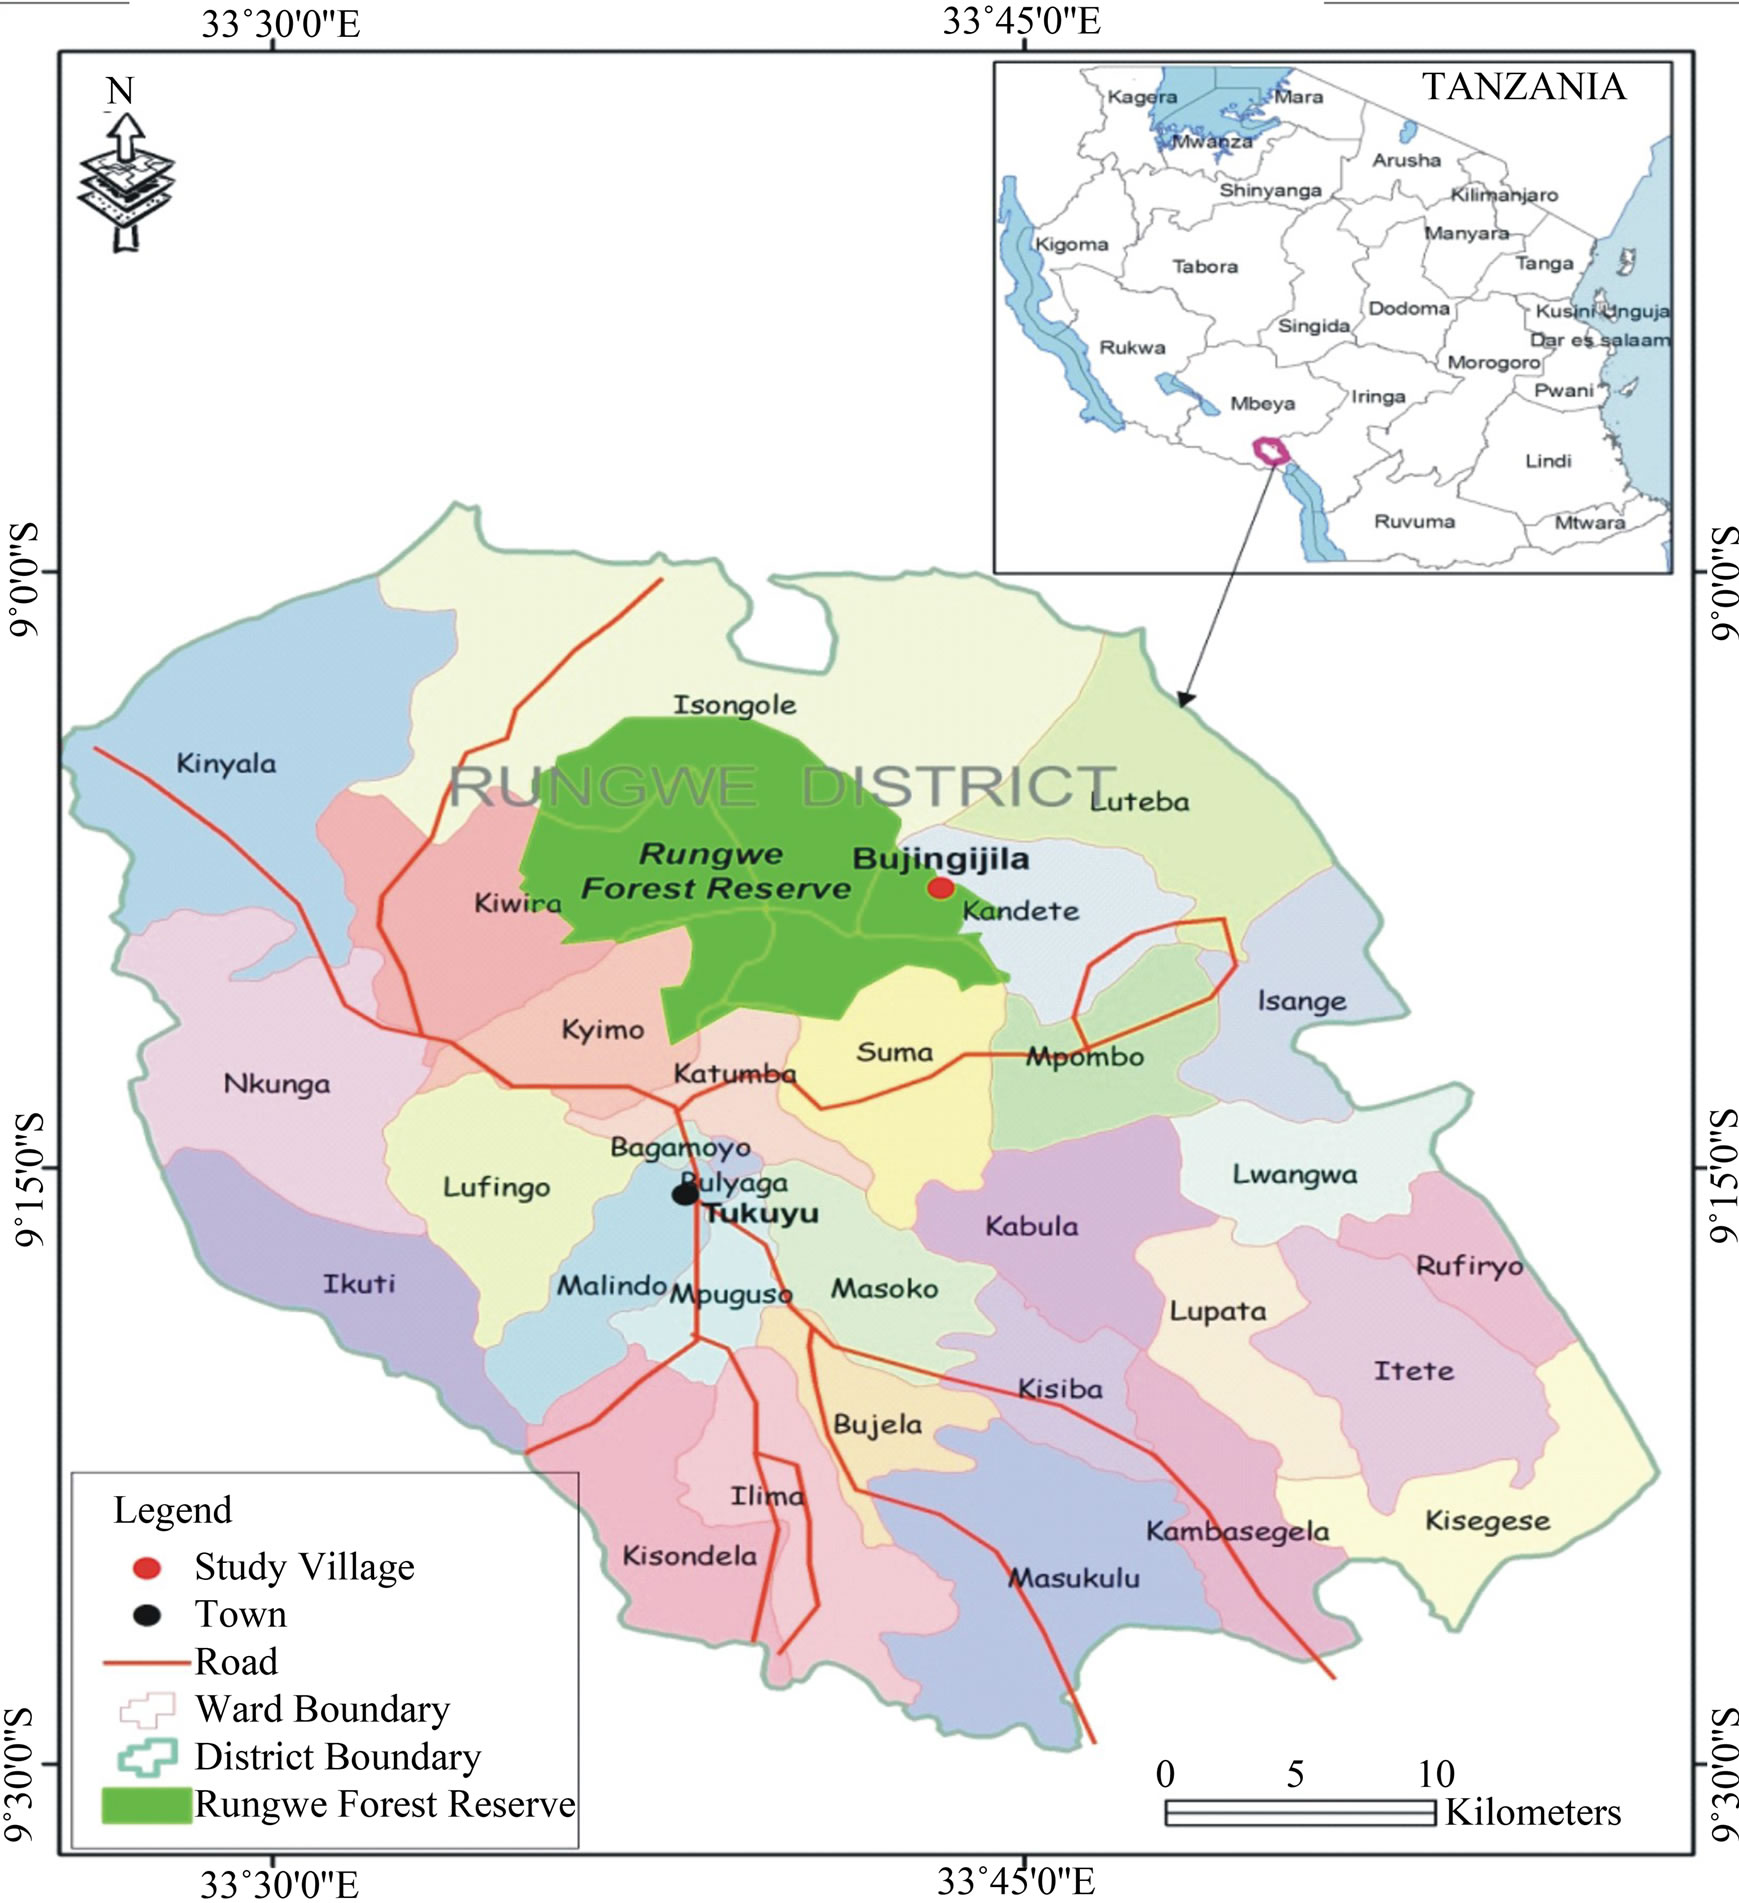
Figure 1. Map of Rungwe district showing the location of study site.

Figure 2. Location of soil sampling points in the sampling plot.
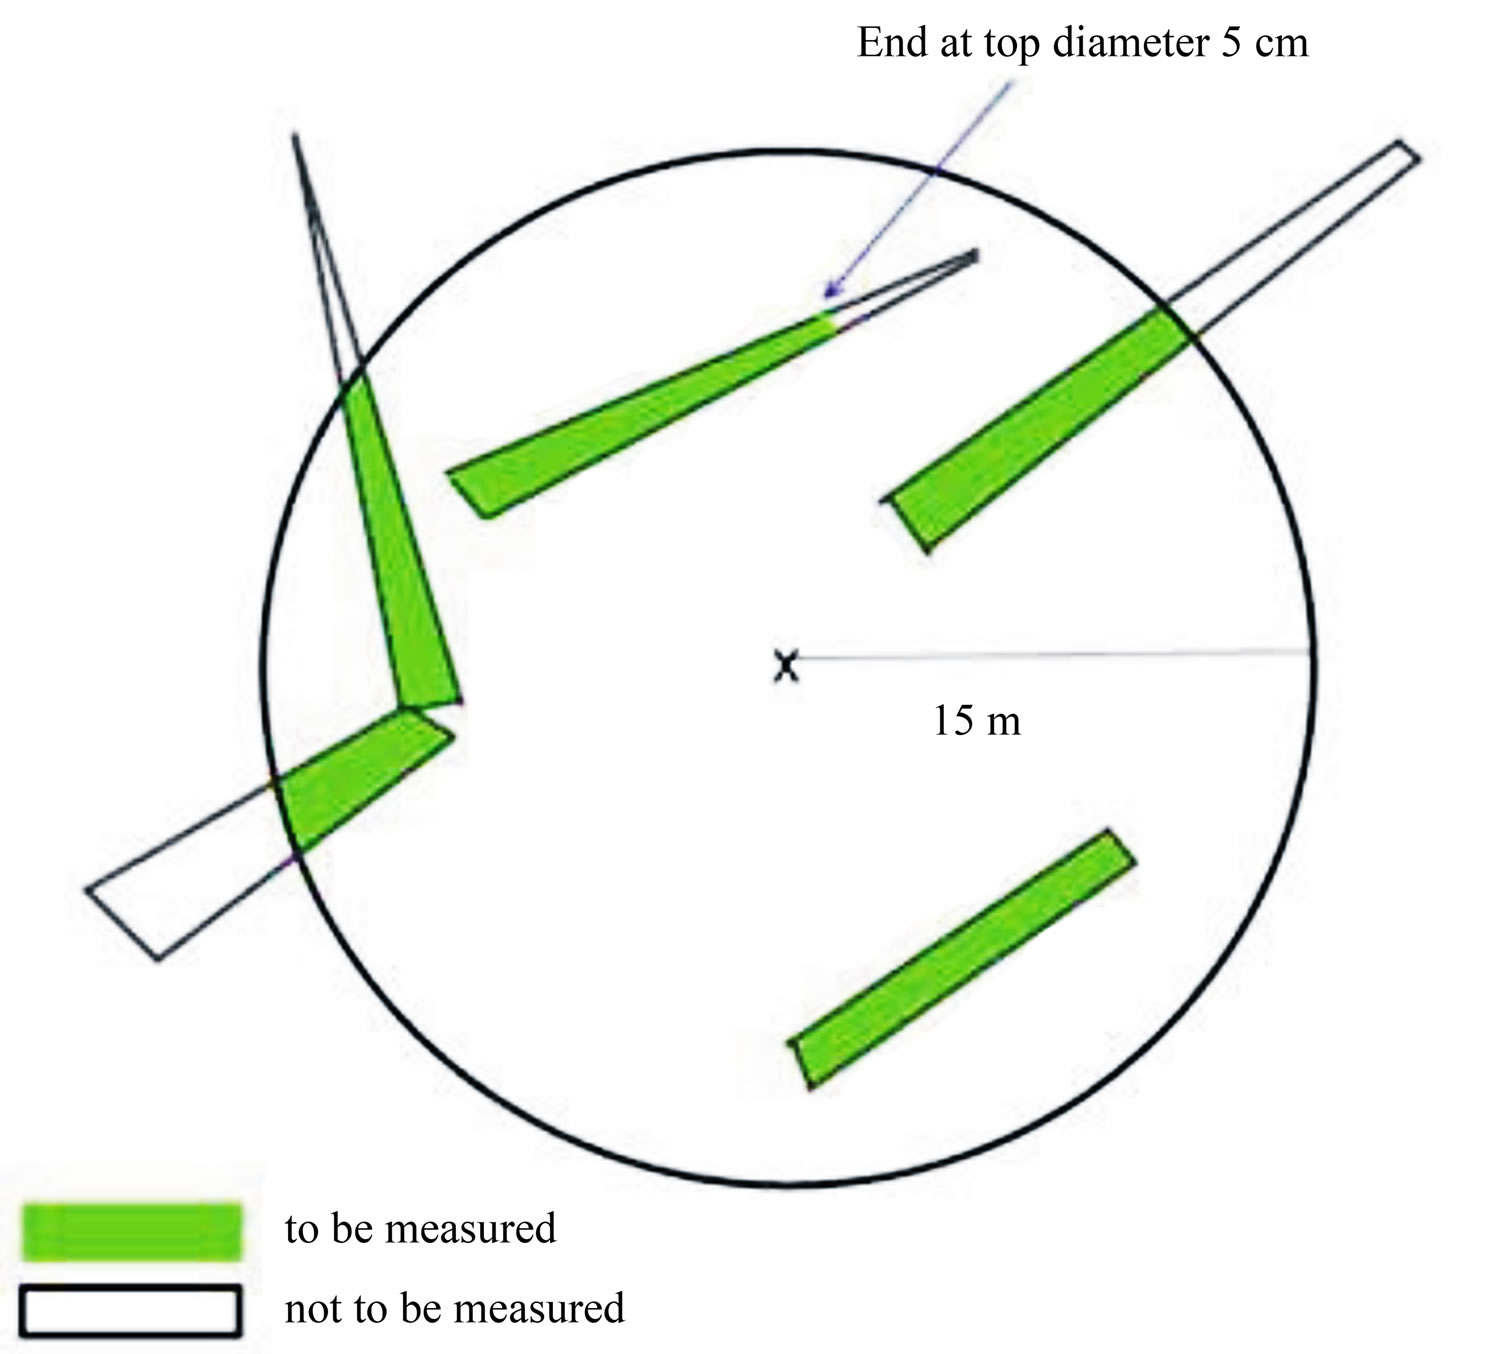
Figure 3. Sampling and measurement of dead wood in sample plots.
2.1.4. Tree Biomass Analysis
To determine the aboveground biomass and volume of each tree, the allometric equation was developed by Malimbwi et al. (1994) [12]. In this case, both aboveground biomass and volume are the function of tree height and diameter. The basal area, volume and aboveground biomass were calculated for each tree species in each subplot, their sum was calculated and converted to tones per hectare according to Malimbwi et al. (1994) [12] following the equations given below:
1) Volume = 0.0001D2.032 H0.66
2) Height = Exp (0.58048 + 0.602965 Ln D)
3) Basal area = 3.142 × (D/200)2
4) Aboveground biomass = 0.06D2.012·H0.71
whereD is the diameter at breast height in centimeters (cm)H is the height in meters (m) of each tree.
Volume in cubic meter per hectare (m3·tree–1)
Basal area in square meter per hectare (m2·tree–1)
Aboveground biomass in tone per hectare (Kg·tree–1)
3. RESULTS AND DISCUSSION
3.1. Stand Volume and Basal Area in Plots
The stand volume, basal area and carbon stocks for the different plots are shown in Table 1. The density of trees was found to be 467 stems ha–1 ranging from 14 to 467 stems·ha–1. The basal area ranged from 0.05 to 28.61 m2·ha–1 with an average of 14.33 m2·ha–1. The study revealed that tree volume ranges from 0.02 to 2.51 m3·ha–1. It was revealed that distribution of stem per ha exhibits high number of large trees which are above 10 cm DBH as compared to those 10 cm DBH. This implies that high carbon sequestration can be achieved if forest management will be improved and sustained (Zahabu, 2008) [13].
3.2. Variation in Carbon Stocks with Elevation
The results showed an increase in carbon stocks with increasing elevation from 9.2 ± 5.2 t/ha to a maximum of 561.7 ± 5.2 t/ha at the elevations 2031 and 2312 m.a.s.l respectively (Figure 4). Increases in carbon contents were found to be positively correlated (R2 = 0.818) with elevation at the first two points. Such increase is not surprising as many scholars have reported similar results. Once a certain limit is reached as altitude increased (at point 3), new tree species and grasses with less ability to fix carbon dominate. This is typically with the upper parts of Rungwe Mountain at above 2312 m.a.s.l where grasses were found to dominate.
The carbon stock content values based on elevations for Rungwe mountain are in broad agreements with those reported by Brown et al. (1991) [14] cited by Munish et al. (2000). Yamakura et al. (1986) also reported similar values for aboveground biomass which was estimated to be 509 t/ha for undisturbed forest in Indonesia. Slightly low values of the aboveground biomass in Rungwe mountain
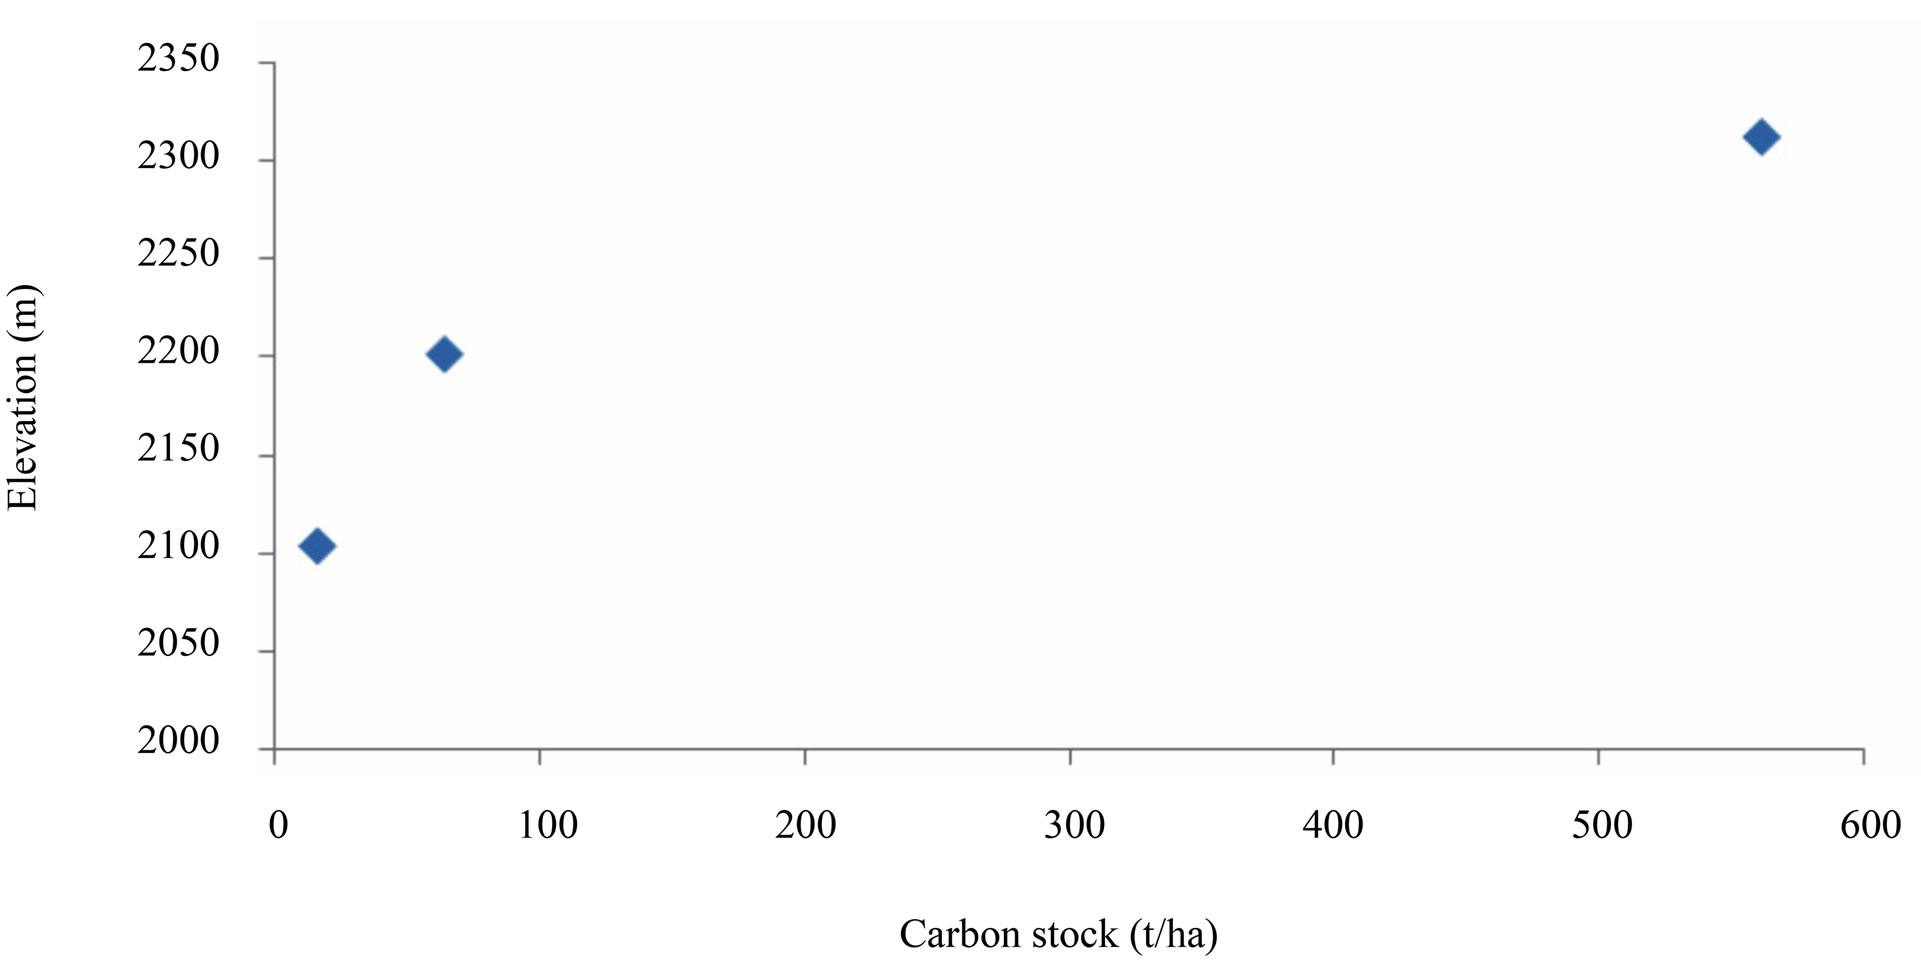
Figure 4. Impacts of elevation on total carbon stocks on Rungwe Mountain.
slopes could be probably due to degradation through encroachment of forest resources. On the other hand lower value of carbon stocks in low altitudes may probably attri- buted by poor management practices such as deforestation and land degradation evidenced by the high number of stumps which was recorded to be 122.67 stumps/ha.
3.3. Carbon Variation with Tree Species in Rungwe
The carbon stocks in each plot varied with tree species (Figure 5). This variation is possibly attributed to the differences in tree ages and canopy sizes as well as leaf morphology. In this case and as shown in Figure 5, estimated carbon contents in t/ha was the highest in Hagenia abysinica, Albizia spp and Pinus patula dominated plots respectively. The rest of species had less than 50 t/ha of carbon stock contents. Such findings are not surprising since aboveground carbon stocks vary widely depending on the extent of the tree cover and associated characteristics as reported by Grace (2004) [15]. The differences in tree carbon between plant communities may also results from the sizes and age of tree species that constituted in these communities. Normally, forest types with larger trees accumulated more biomass, hence higher carbon stock contents.
3.4. Carbon Stock Contents in Crop Lands
Land use dynamics affects carbon stock contents in most ecosystems. For example, woodlands tends have large amount of carbon stock but once this is converted to agriculture land the amount tends to decrease. In croplands mixed with trees at Bujingijila village a variation in carbon stock with tree species (Table 1) was found. Generally in plots with many available tree stumps and with remained dead stems had less carbon stock suggesting forest degradation and increased emission of carbon.
The large amount of carbon stocks in Pinus patula (Figure 6) is probably caused by the presence of large number of replanted trees under reforestation program (Figure 6). In general, the more the number of trees, more carbon was measured. This suggests that tree number per ha can be expressed by density contributes significantly to total carbon stock contents while deforestation and forest degradation leads to increased emission of carbon.
Conversion of forest into cropland has also been reported to be associated with devastating loss in carbon (Majule and Shishira, 2008) [16]. Major reasons for that loss have been pointed out to be due to human disturbances such as fire, tillage practice which increase the rate of soil organic matter decomposition and the actual process of clearing the vegetation. On the other hand Gupta (2009) [17] pointed clearly the role of forest in mitigation climate change by sinking carbon adding soil carbon contents.
3.5. Variation in Soil Carbon Stock with Elevation
Rungwe Mountain is mostly made of loam soils mixed up volcanic ash with varying amount of carbon [18]. Soil carbon stock contents depend on the type of soil, vegetation types and cover, climatic (temperature) and land management practices. The soil organic carbon contents assessed at different soil depths ranged from 0.20% to 0.39% (Cgram/Dry soilgram*100) within 0 - 10 cm soil layer, from 0.12% to 0.32% within 10 - 20 cm and 0.10% to 0.24% within 20 - 30 cm soil layers. This pattern indicates that soil carbon decreased with soil depth exhibiting major trends in carbon accumulation in the upper
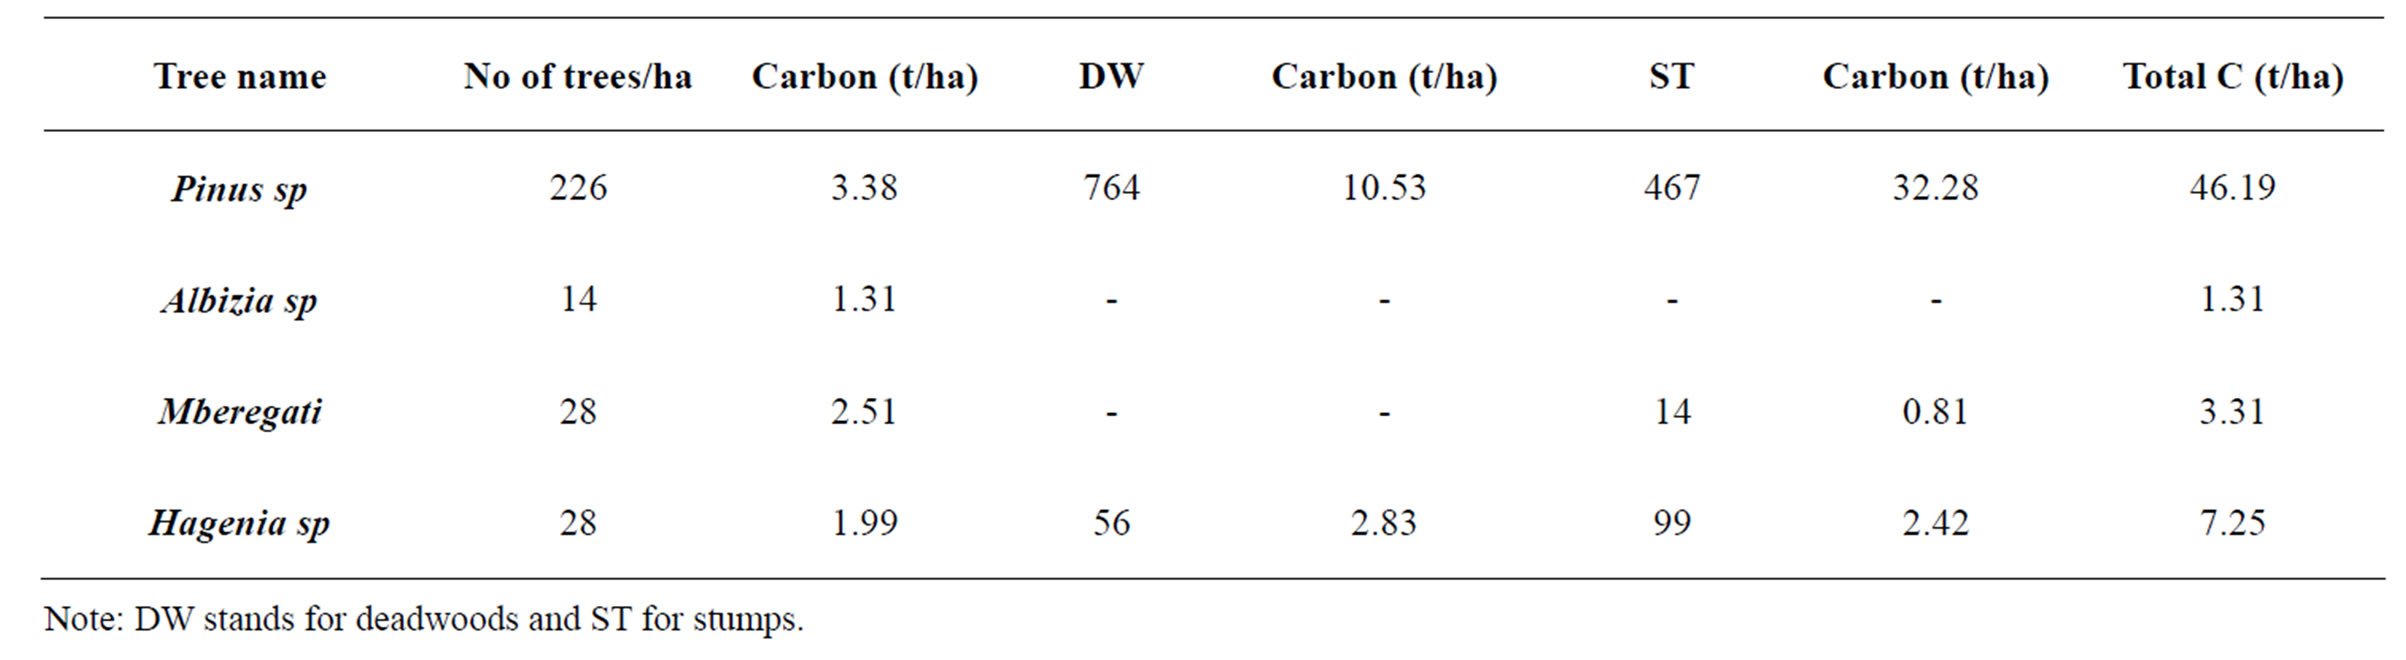
Table 1. Carbon stocks variation with tree species in cropland.
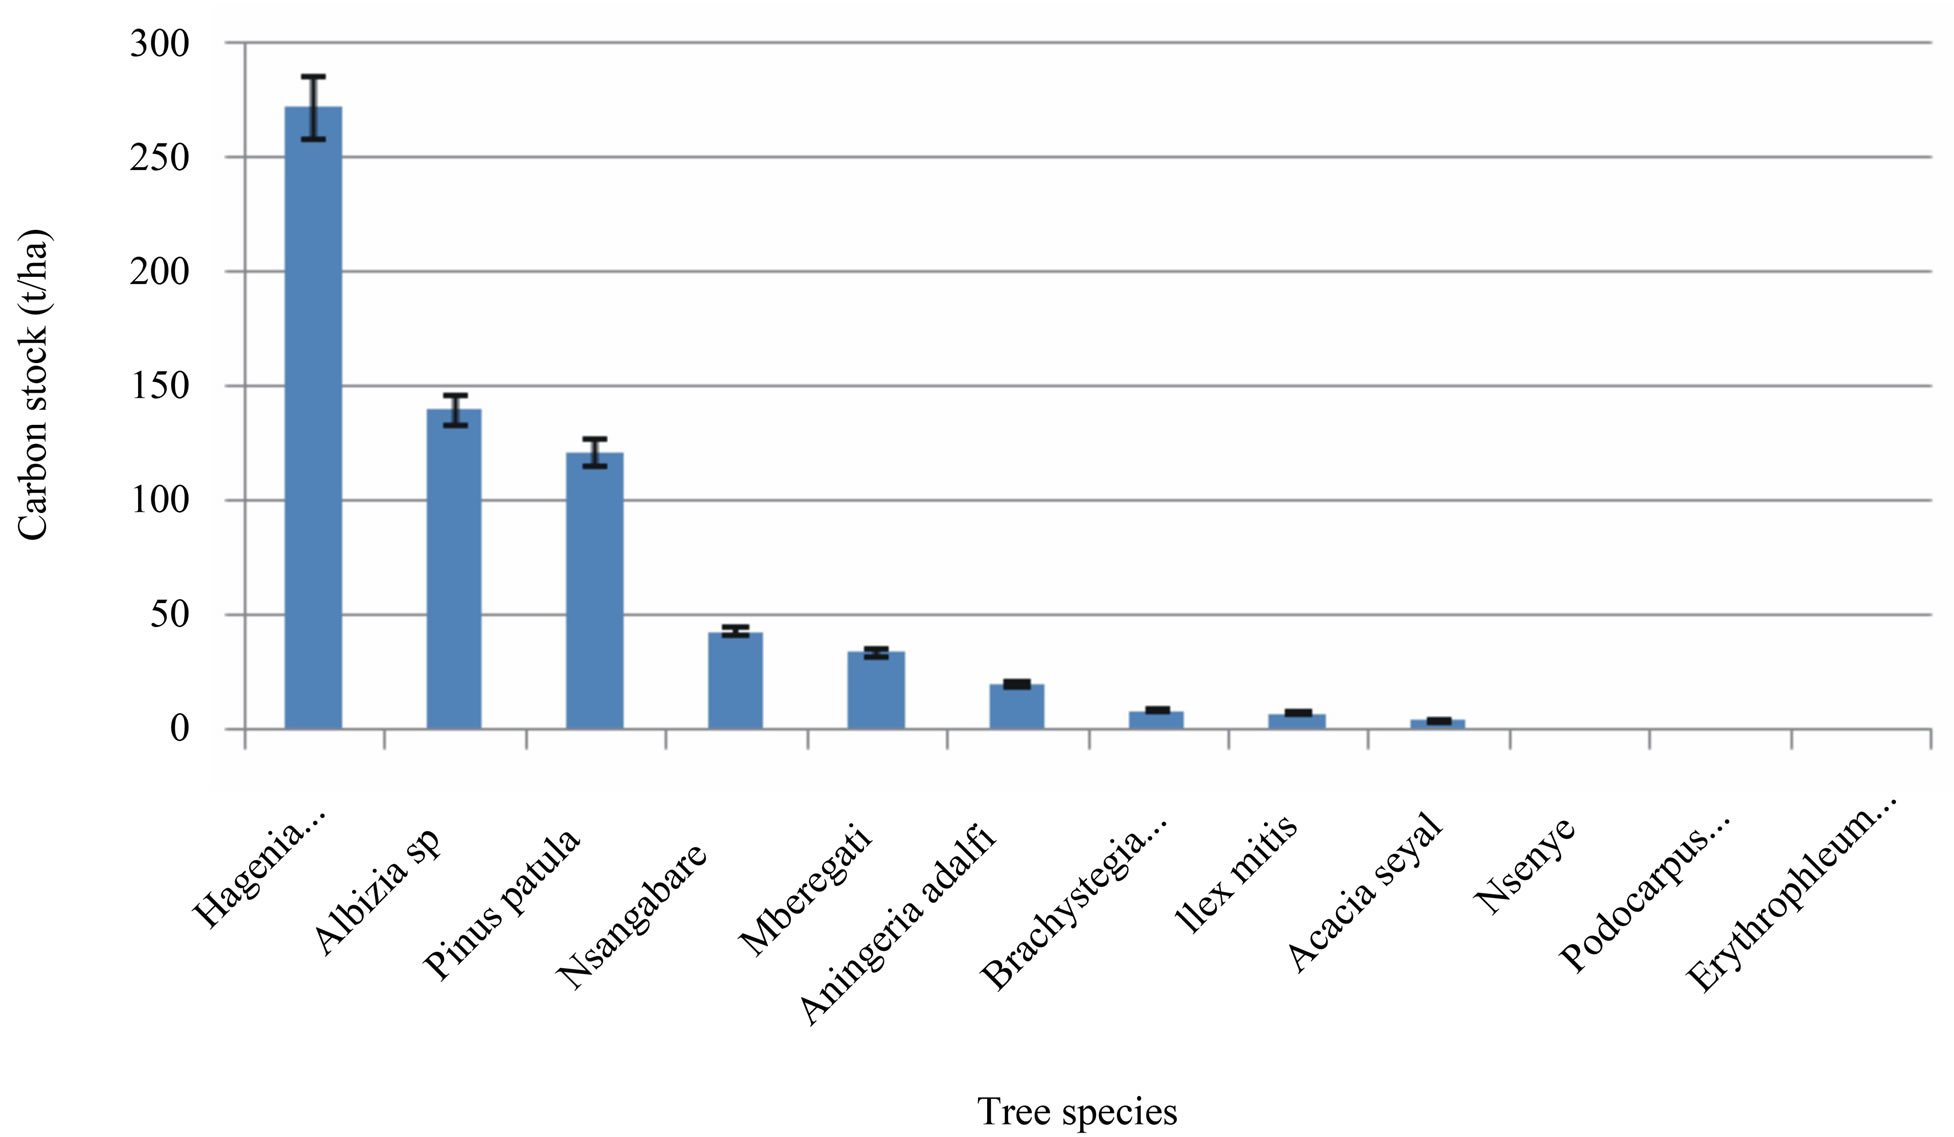
Figure 5. Relationship between tree species and carbon stocks in Rungwe Mountain.
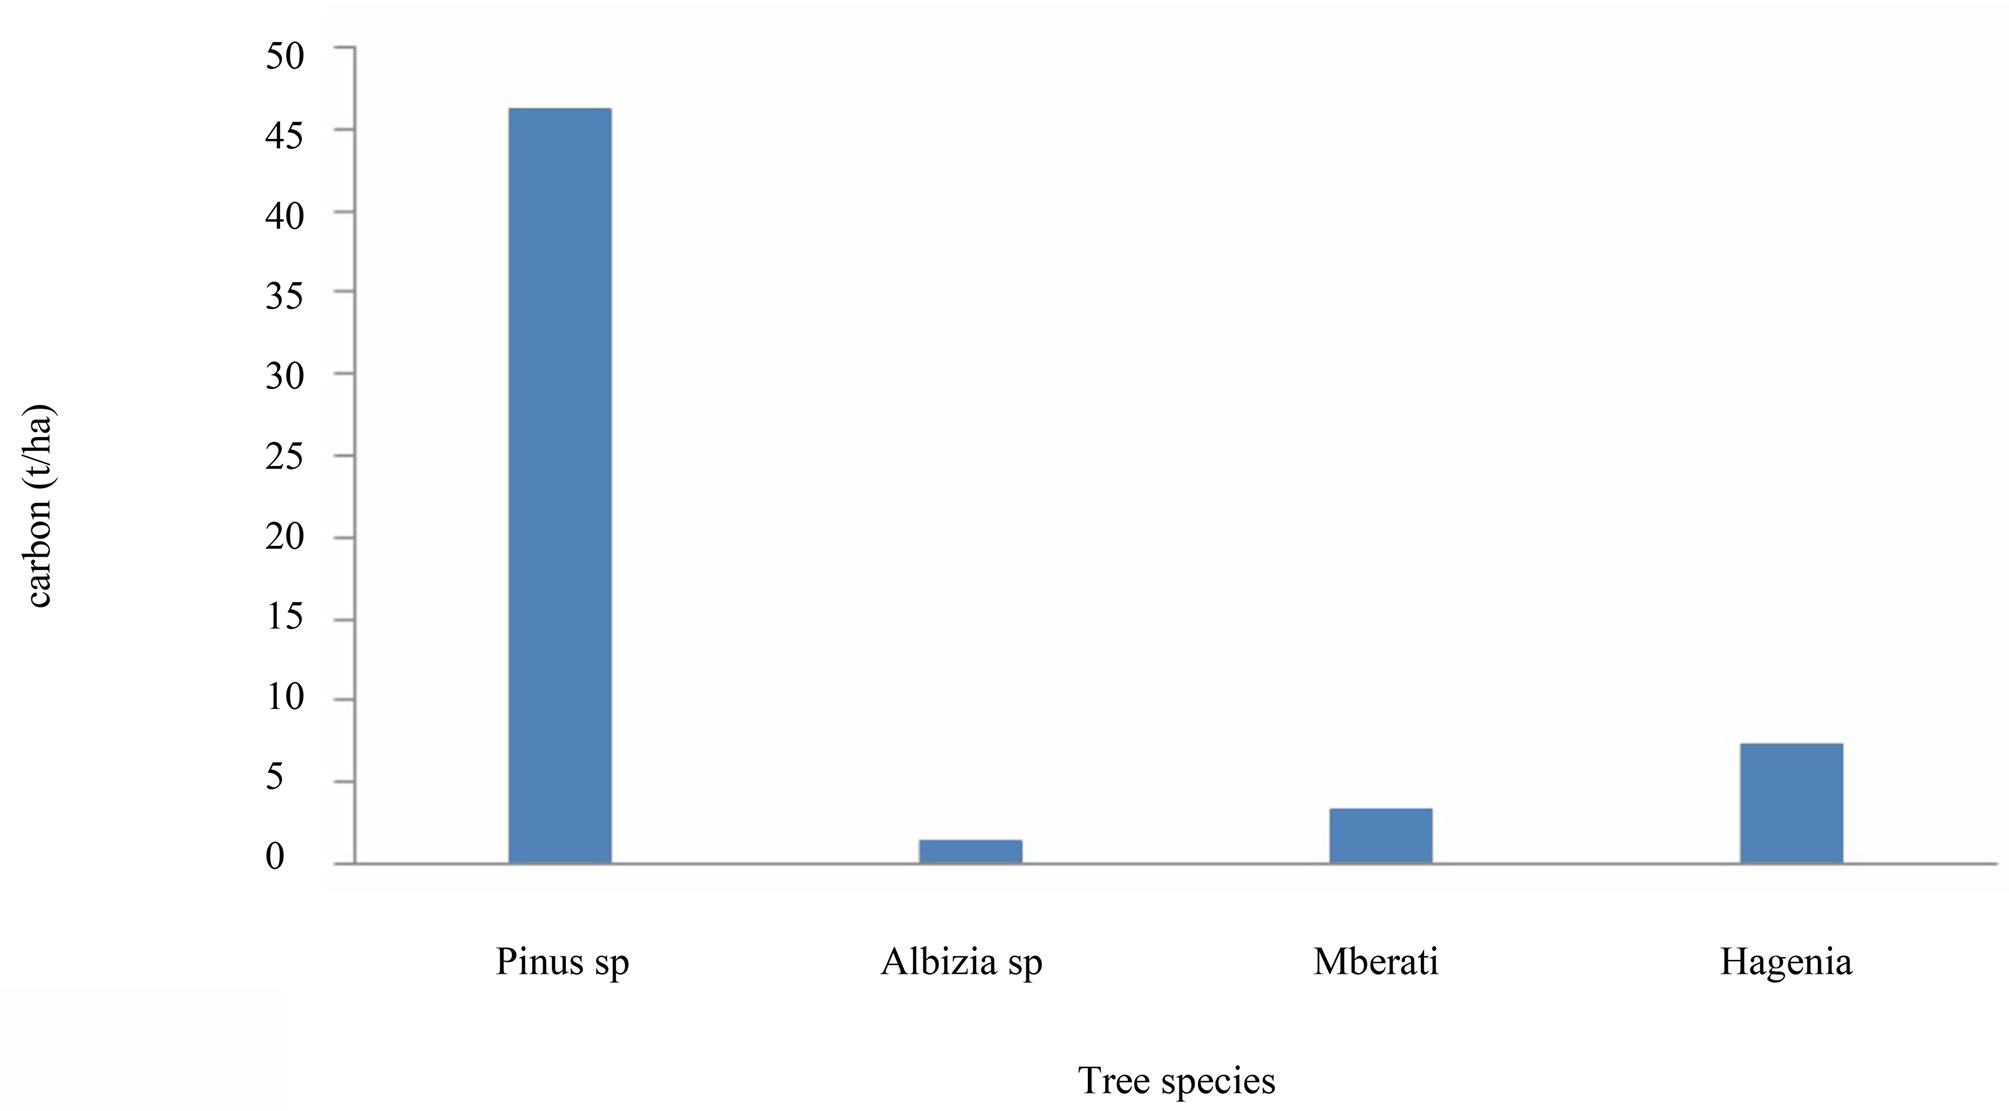
Figure 6. Carbon stock variation with tree species in cropland.

Figure 7. Variation of soil carbon with elevation.
soil layers. Results are in broad agreement with findings by FAO (2001) [19] and Sakala (1998) [20]. Overall, much of the soil carbon was found to be stored in the first 10 cm top soil indicating that the management for this soil layer is important in balancing carbon.
Soil carbon ranged from 0.27 at high elevations to 0.32% at low elevations (Figure 7). Findings are similar to those reported by Maitima et al. (2009) and Majule (2010) for soils found on slopes on Mount Kilimanjaro and Tukuyu in Mbeya respectively.
4. CONCLUSION
Variation in elevation is one of the major determinant factors for both carbon stocks aboveground and belowground on slopes of Rungwe Mountain in Tanzania. This is because with elevation tree species and composition tends vary and they affects carbon stock contents. Human activities in managing the forest have influence on soil carbon stock and this tends to affects climate change mitigation efforts in the area.
5. ACKNOWLEDGEMENTS
Authors wishes to thank CORUS through RESON for providing financial assistance to undertake this important study. The Director of the Institute of Resource Assessment, University of Dar es Salaam is thanked for granting permission to researchers to implement this study. Rungwe region authority is thanked for allowing this study to be conducted in their region. District authority for Rungwe is also thanked for availing information and spending their time to assist in the field work. Finally, authors wishes to thank all village leaders and local communities and individuals who participated in the field visit to identify various issues.
REFERENCES
- MacDicken, K.G. (1997) A guide to monitoring carbon emissions from deforestation and degradation in developing countries: An examination of issues facing the incorporation of REDD into market-based climate policies. Resource for Future, Washington DC, 84.
- Intergovernmental Panel on Climate Change (1995) Climate change: A report of the intergovernmental panel on climate change. IPCC Report, Geneva.
- Food and Agriculture Organization (2008) Technical review of FAO’s approach and methods for National Forest Monitoring and Assessment (NFMA). National Forest monitoring and Assessment Working Paper, Rome.
- Kangalawe, R.M., Majule, A.E. and Shishira, E.K. (2005) An analysis of land use dynamics and land degradation process in the great rift valley, central tanzania: A case of Iramba district. The Organization for Social Science Research in Eastern and Southern Africa, Addis Ababa.
- Majule, A.E. (2010) The impacts of land management practices on soil quality implications on smallholder productivity in southern highland Tanzania. Journal of Environmental Economics, 1, 59-67.
- Lehntonen, A. (2005) Carbon stocks and flows in forest ecosystems based on forest inventory data. Finish Research Institute, Vantaa Research Center, Helsinki.
- Prentice, C. (2000) The carbon balance of the terrestrial biosphere: Ecosystem models and atmospheric observations. Ecological Applications, 10, 1553-1573. doi:10.1890/1051-0761(2000)010[1553:TCBOTT]2.0.CO;2
- Rowell, D.L. (1994) Soil sciences: Methods and applications. Longman, London.
- Gibbs, H. (2007) Monitoring and estimating tropical forest carbon stocks: Making REDD a reality. Nelson Institute for Environmental Studies, University of Wisconsin, Madison.
- Munishi, P.K.T. and Shirima, D.D. (2009) Valuation, mapping and conservation of carbon stocks and other ecosystem services I: The eastern arc mountains of Tanzania. University of Leeds, UK and Sokoine University of Agriculture, Tanzania.
- Maitima, M.J., Simon, M.M., Robin S.R., Louis, N.G., Majule, A.E., Herbet, L., Dereck, P., Stephen, M. and Sam, M. (2009) The linkages between land use change, land degradation and biodiversity across East Africa. African Journal of Environmental Science and Technology, 3, 310-325.
- Malimbwi, R.E., Solberg, B. and Luoga, E. (1994) Estimation of biomass and volume in miombo woodlands at kitulangalo forest reserve, Tanzania. Journal of Tropical Forest Science, 7, 230-242.
- Zahabu, E. (2008) Sinks and sources: A strategy to involve forest communities in Tanzania in global climate policy. Ph.D. Thesis, University of Twente, Enschede.
- Brown, S. (1997) Estimating biomass and bilmass change of tropical forest: A primer. Food and Agriculture Organization of the United Nations, Rome.
- Grace, J. (2004) Understanding and Managing Carbon Cycle. Journal of Ecology, 92, 189-202.
- Majule, A.E. and Shishira, E.K. (2008) Participatory development of sustainable soil fertility management practices through innovative training, south eastern, Tanzania. The ICFAI Journal of Environmental Economics, 1.
- Gupta, H.S. (2009) Forest as carbon sink-temporal analysis for Ranchi District. Indian Forestry Journal, 32, 6-12.
- Majule, A.E. (2011) Implications of ecological and social characteristics to community livelihoods in the coastal areas of Tanzania. African Journal of Environmental Science and Technology, 6, 72-79.
- Food and Agriculture Organization (2001) FAO Forestry FAO and world bank, soil fertility initiative. Food and Agriculture Organization of the United Nations, Rome.
- Sakala, M.G. (1998) The effects of incorporating plant residues on soil acidity in the management of tropical soils. Ph.D. Thesis, Reading University, Reading.