Advances in Biological Chemistry
Vol.3 No.1(2013), Article ID:27960,8 pages DOI:10.4236/abc.2013.31006
Excess adsorption of biomolecules on soft surfaces: Adsorption of DNA, proteins and lactose on fatty surfaces
![]()
1Department of Food Technology & Biochemical Engineering, Jadavpur University, Kolkata, India
2Department of Chemistry, Bose Institute, Kolkata, India
Email: *dkchattoraj@hotmail.com, kalipada@bosemain.boseinst.ac.in, *daskp25@gmail.com
Received 2 November 2012; revised 27 December 2012; accepted 6 January 2013
Keywords: Excess Adsorption; Surface Adsorption of Biomolecules; Soft Surfaces; Adsorption on Soft Surfaces; DNA; Globular Proteins
ABSTRACT
Insoluble fatty surfaces are involved in many important interactions such as in biomembranes with soluble biological macro and micromolecules. In this paper we have studied the adsorption interaction of aqueous solution of DNA, some proteins and lactose on several sparingly soluble fatty substances namely milk fat, stearic acid, palmitic acid, phosphatidyl choline and cholesterol surfaces by measuring the depletion of the adsorbates by analytical methods. Adsorption ( ) of DNA on the soft surfaces of stearic acid, milk fat, phosphatidyl choline, palmitic acid and cholesterol was measured as a function of DNA concentration C2. In each case
  t=32.3 /> was found to increase with C2 until it reached the maximum value
  at a critical concentration
 . For different surfaces
  stands in the order: stearic acid > milk fat > phosphatidyl choline > cholesterol > palmitic acid. DNA forms multilayers on stearic acid surface. Adsorption of hemoglobin on cholesterol surface is found to be negative or zero but that of BSA on cholesterol is positive. Adsorption of gelatin on cholesterol surface is significantly higher than that of BSA. Lysozyme on cholesterol surface forms multilayers and on casein forms bilayer. The lowering of free energies −(Go for all systems have been calculated using integrated form of the Gibbs adsorption and their values have been compared with each other. It is concluded that despite differences in the adsorption behavior of the biomolecules on various soft surfaces, free energy change expressed as Bull’s free energy change (Δ
 ) remain nearly constant except for BSA-fatty acid interaction which may be likely due a specific interaction.
1. INTRODUCTION
H. B. Bull [1,2] in 1956-1957 first studied the adsorption of egg albumin and bovine serum albumin from solution onto the rigid surface of glass powder under various physico-chemical conditions. He measured specific surface areas covered due to packing of ellipsoid shaped egg-albumin and BSA molecules and analyzed the orientations of these globular proteins on the rigid glass surface. Subsequently, extensive studies of relative adsorption of different soluble proteins in pure and mixed forms on different types of rigid surfaces of powdered substance of known specific surface areas have been studied by various workers [3-8]. In a series of papers Chattoraj and coworkers studied extensively the adsorption of deoxyribonucleic acid (DNA), ribonucleic acid (RNA) and nucleo-histone on the rigid surfaces of alumina, silica, charcoal, resins and chromium metal surfaces using analytical and micro-electrophoretic techniques [9-15]. Following thermodynamic approaches of Bull [1,2], these workers evaluated affinities or standard free energy changes of adsorption using integrated forms of the Gibbs adsorption equations. Earlier Das and Chattoraj [16] studied adsorption of proteins from solutions onto soft oil-water interface using simple microscopic and analytical techniques of measurements. Recently, Chattoraj and coworkers [16,17] have studied the excess adsorption of nucleic acids, BSA and gelatin from solution onto the surfaces of a few soft suspended particles like insoluble casein [13], cellulose [14], stearic acid particles [15].
While recent studies on biomolecules adsorption primarily focus on biopolymer conformation at the adsorbed surface [18-21], very little attention was given to understand the thermodynamics of interaction on soft surfaces [22]. Recently we reported the on adsorption of milk protein β-lactoglobulin on the surfaces of stearic acid, lipids and cellulose [17]. All these adsorbents give rise to soft interfaces with water. In this paper we present our extensive data on the adsorption of DNA, soluble proteins such as hemoglobin, lysozyme, serum albumin and gelatin and disaccharide lactose from aqueous solution onto the soft surfaces of fatty acids lipids, cholesterol and fats. The objective of the present work is to understand the thermodynamics of the biomolecule soft surface interactions. Since the soft surfaces can swell taking up water, their surface areas of the adsorbents do not remain constant as in conventional adsorption experiment. Therefore these aspects must be taken into the treatment to understand free energy of adsorption of soft surfaces.
2. MATERIALS AND METHODS
2.1. Samples and Chemicals
Different biopolymers such as BSA, gelatin, lysozyme, hemoglobin, and calf thymus DNA were all from Sigma Aldrich, USA and lactose was from BDH, England.
Among the different surfaces used as adsorbents, fat free casein was from N. B. Chemicals, Cleveland, USA; cholesterol, stearic acid, palmitic acid and phosphatidylcholine were from Sigma Aldrich, USA; milt fat was procured from market. All these materials were dried in a vacuum desiccators containing fused CaCl2 for 2 weeks before use. Inorganic salts NaCl, Na2SO4 and KSCN used were of analytical quality. Folin reagent was used for protein estimation was from Sisco Research Laboratory, India. Double distilled water was used throughout the adsorption experiments.
2.2. Adsorption Experiments
Solutions of inorganic salts (NaCl, Na2SO4, KSCN) of 0.05 M ionic strengths were prepared from their stock solutions. The solutions were brought to pH 6.5 by addition of requisite amounts of dilute HCl or NaOH. Solutions of soluble biopolymers (DNA, proteins) and lactose respectively were dissolved in salt solutions by stirring. For the study of adsorption of DNA, lysozyme, hemoglobin, gelatin, BSA and lactose on the surfaces of casein and cholesterol powders as adsorbents direct method of analytical measurement as described earlier [15] using Eq.1.
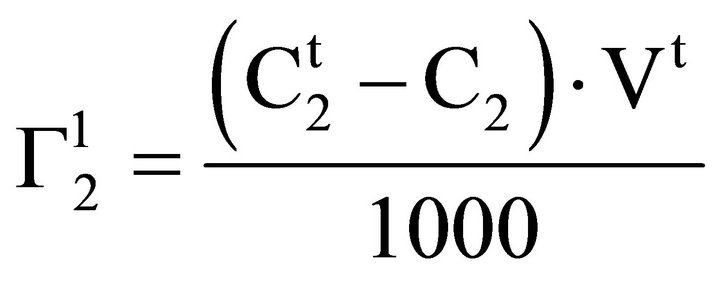 (1)
(1)
Here Vt stands for v/w where v in ml is the volume of the aqueous solution in which w kg of insoluble adsorbents was suspended. Also  and C2 stands for molar concentrations of adsorbate biopolymer or lactose before and after adsorption equilibrium. In a typical experiment, 1 g adsorbent was taken in 10 ml buffered biopolymer solution and the mixture was stirred magnetically for 4 hr to reach equilibrium. The values of C2 for soluble proteins (lysozyme, gelatin and BSA) were determined using Lowry method of protein analysis [23]. Red colored hemoglobin solution shows absorption at 406 nm in spectrophotometric analysis [24] and hence has been used for direct analysis of C2 in bulk solution. C2 for lactose solution in the bulk was estimated using Fehling equivalent method [25]. Solutions of lactose were titrated with mixture of Fehling A and Fehling B (in 1:1 ratio) against standard solution of lactose. From titration values,
  for lactose have been estimated using Eq.1.
Concentration (C2) of DNA of adsorption equilibrium was estimated spectrophotometrically at 260 nm. The absorbance at 260 nm of a set of ten solutions of known DNA concentrations was used to plot a standard curve (OD against concentration of nucleotide) which was found to be linear. The molar concentration C2 of DNA nucleotides was calculated from the standard curve. For DNA  has been calculated as moles of nucleotide per kg of adsorbent using average molecular mass of the nucleotide as 330.
When adsorption of proteins, DNA and lactose respectively from their aqueous solution onto the surface of powdered stearic acid, palmitic acid, milk fat and phosphatidyl choline respectively were studied, the addition of the adsorbent powders to these aqueous solution formed as fine colloidal suspension and separation of these particles from clear solvent was difficult. In these cases, the adsorbent powder (1 g) was first dissolved in n-heptane (2.5 ml). These solutions were added quantitatively to the aqueous solution (10 ml) of adsorbate with gentle stirring. The n-heptane from the mixture was evaporated and agglomerated precipitate of adsorbent suspended in aqueous solution was used for adsorption process until state of adsorption equilibrium was reached. The values of C2 for the adsorbate dissolved in the bulk aqueous solution was estimated so that values of  can be calculated using Eq.1. The standard error in the values of
 , based on three repeats of each experiment, did not exceed 8 percent.
3. EXCESS ADSORPTION AND FREE ENERGY CHANGE—THEORETICAL CONSIDERATION
Amount of soluble biopolymer adsorbed onto the surface of adsorbent has been experimentally determined using Eq.1. According to this equation, amount of adsorption  will be positive when
![]() C2. However if C2 >
C2. However if C2 > ,
,  will be negative. Since the molar concentration
  and C2 are very low, they can be equated to the respective molal concentration
  and m2. Again for dilute solution, Vt may be replaced by the weight of solution Wt. Thus Eq.1 can be written as
 (2)
(2)
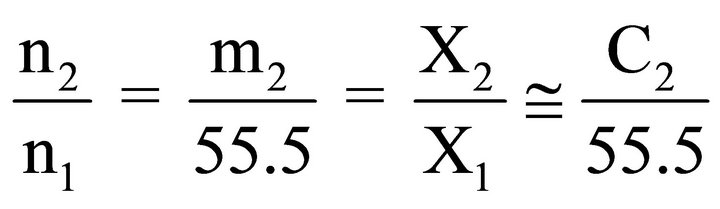
Here  and m2 are equal to 1000
 , 1000 n2/n1, and the weight of solvent
  is equal to
 . Here
  and
and  are moles of solvent and solute respectively per kg of the adsorbent before adsorption and n1 and n2 stand for their values per kg after adsorption. M1 represents the molecular weight of solvent water. Inserting these values in Eq.2, one finds [26,27]
 (3)
(3)
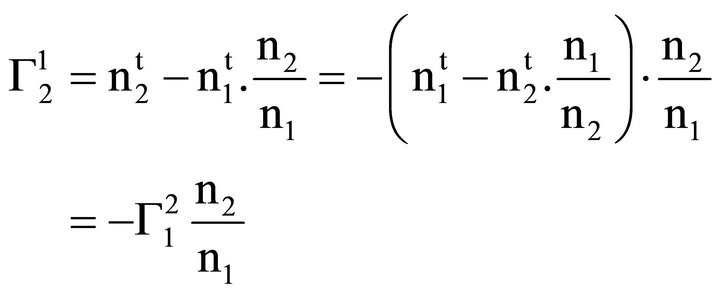
Here  stands for solvent excess per kg of adsorbent whose value can be calculated from values of
  and n2/n1 using Eq.4 since
 (4)
(4)
X1 and X2 stand for bulk mole fractions of solvent and solute components respectively. For dilute solutions, m2 ![]() C2 and Eq.2 may be converted to the form of Eq.1, since Wt becomes approximately equal to Vt. Also, it has been pointed out earlier [27] that
C2 and Eq.2 may be converted to the form of Eq.1, since Wt becomes approximately equal to Vt. Also, it has been pointed out earlier [27] that
 (5)
(5)
 (6)
(6)
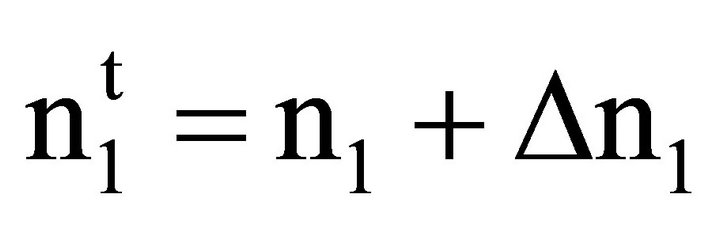
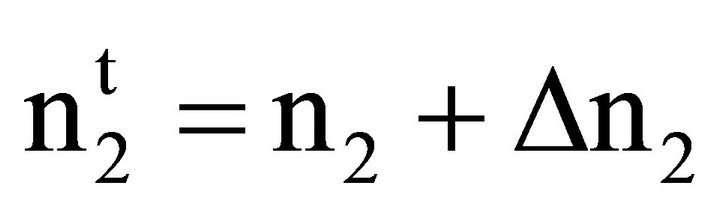
Here ∆n1 and ∆n2 stand for moles of solvent and solute respectively bound per kg of powdered adsorbent thus forming a surface bound phase. Inserting these relations [27] in Eq.3
 (7)
(7)
When  attains a maximum value
 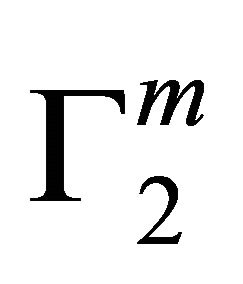 at a critical concentration of
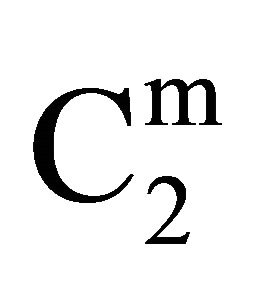 , Δn1 becomes zero and the surface becomes free of adsorbed water forming a monolayer and thus
  = n2. When C2
 ![]()
 , Δn1 still remains zero but
  increases further forming a multilayer at the interface. However, if n1 is positive after attainment of apparent maximum value
  at
at ,
,  will decrease with increase of C2. If in this region
  varies linearly with C2, the absolute composition of the solvent and solute (Δn1 and Δn2) in the surface phase can be determined from the slope and intercept of the plot.
4. RESULTS AND DISCUSSION
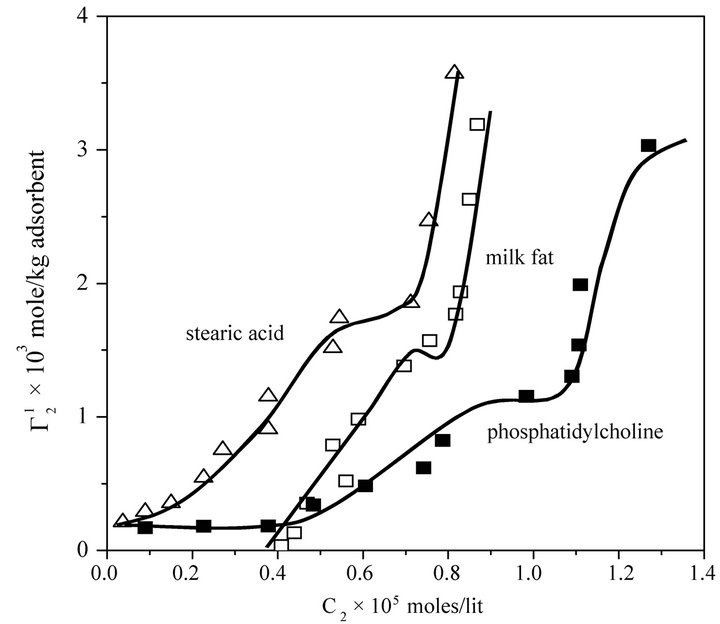
In the present study, extents of adsorption of DNA on the surface of stearic acid, milk fat, and phosphatidylcholine have been carried out at pH 6.5 and ionic strength 0.10 maintained by NaCl (Figure 1(a)). In the adsorption isotherms for these three soft organic surfaces values of 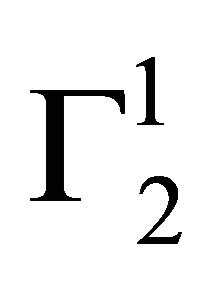 are observed to increase with the increase of the DNA nucleotide concentration until at a critical concentration
 (a)
(a) (b)
(b)
Figure 1. Isotherms for adsorption of calf thymus DNA on different powders, at 28˚C, pH 6.5 in presence of 0.05 M NaCl. Upper panel: stearic acid, milk fat and phosphatidyl choline; Lower panel: cholesterol and palmitic acid.
 , values of
  become maximum (
 ). This behavior is similar in nature to those observed for the adsorption of DNA on regid solid surfaces such as alumina, silica and charcoal, barium sulphate and resins [11-14]. On exceeding
 ,
,  sharply increased for these three surfaces with the increase of C2 within a short range of concentration indicating multilayer formation of DNA on the surfaces of stearic acid, milk fat and phosphatidyl choline respectively. Similar characteristics of multilayer formation have been observed for the adsorption of DNA on rigid surfaces [11-13]. We have also studied adsorption of calf thymus DNA on powdered surfaces of palmitic acid and cholesterol respectively at average pH 6.5 and NaCl concentration 0.05 M. It is observed that
  increased with increase of C2 (vide Figure 1(b)) until saturation value of
  is attained at C2 close to
 . These values are included also in Table 1. Values of
  for the adsorption of DNA on different soft organic surfaces stand in the following order:
Stearic acid > milk fat > phosphatidyl choline > cholesterol > palmitic acid Critical average values of the mole from  (calculated from
  of all these systems have been reported in Table 1. Earlier from adsorption interaction DNA from solution are found to occur onto various types of surfaces of insoluble protein and cellulose [9,13,14]. But in the present work, we are able to show that DNA may also undergo adsorption interaction on the surface of insoluble organic lipids such free fatty acids, triglyceride fats, phosphatidyl choline and cholesterol.
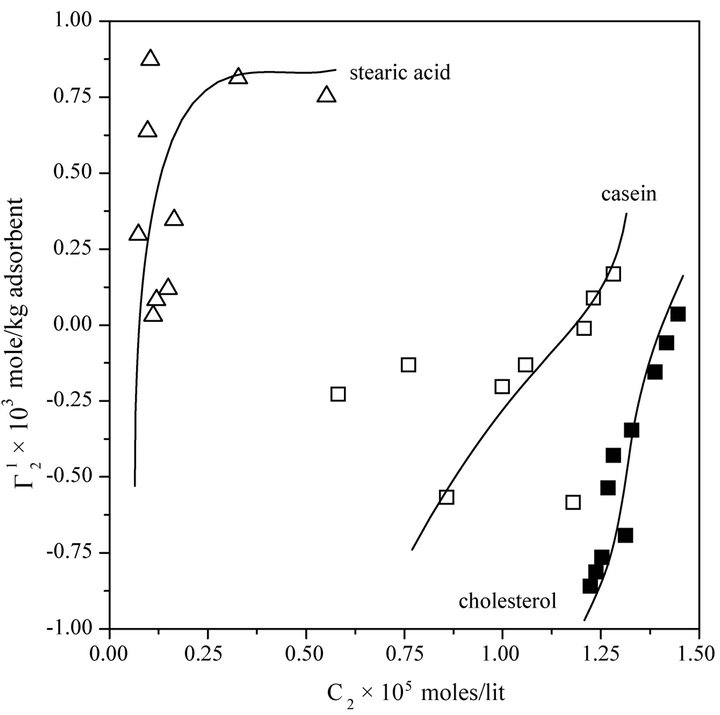
Cholesterol in vivo is transported to different corners of cellular systems through its interaction with blood serum proteins [28]. However, in some cases, excess cholesterol may deposit on the arterial wall leading to serious coronary heart disease problem. The adsorption interaction of blood protein hemoglobin with insoluble cholesterol particles have also been studied at pH 6.5. It is most interesting to note that even at very high values of hemoglobin concentration,  on cholesterol surface is mostly negative or close to zero (vide Figure 2(a)) indicating lack of binding interaction of cholesterol with Hb fraction of blood at pH 6.5. One notes with interest that in the presence of 0.05 M NaCl concentration hemoglobin cannot be adsorbed as positive excess on casein powder at lower values of C2. In fact,
  becomes negative here due to excess hydration of the soft surface. At very high values of C2,
  becomes zero. On stearic acid surface however, Hb is positively adsorbed and a saturation level is attained at low values of C2 (Figure 2(a)).
However, with replacement of NaCl by Na2SO4,  values for hemoglobin adsorption on casein surface becomes positive even at lower values of C2 (vide Figure 2(b)). With further increase of C2, positive value of
  increases and approaches maximum value
  (vide Table 1). Due to the excess hydration of protein [15] in the presence of KSCN, values of
  becomes negative at very low concentration of Hb. But with the increase of C2, unfolded Hb molecules are adsorbed as positive excess probably by partial dehydration of casein.
  increases and becomes positive above azeotropic point [15] when C2 becomes close to
  (vide Table 1). The maximum adsorption, as pointed out earlier [15] leads to complete dehydration of proteins (Dn1 = 0).
In Figure 3, adsorption data of bovine serum albumin and gelatin on cholesterol surface is presented. Both show increasing adsorption with increase of C2, but comparatively much higher amount of gelatin is adsorbed on cholesterol compared to BSA. Comparing Hb and BSA adsorption data on cholesterol, it may be concluded that cholesterol in blood serum is transported specifically by BSA and not by hemoglobin. Thus cholesterol-BSA interaction plays important functional role in cellular trans-
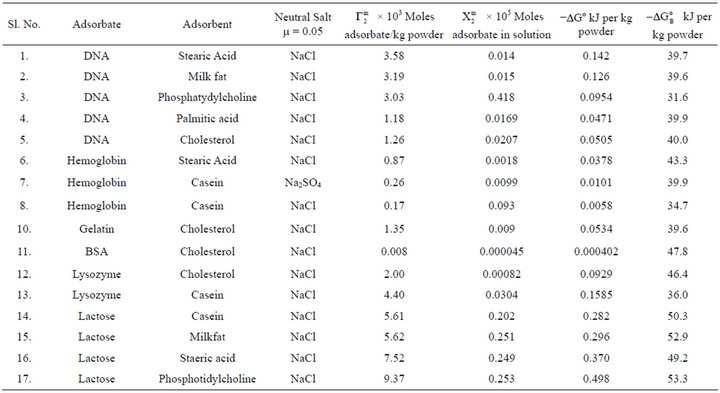
Table 1. Thermodynamic parameters for adsorption of DNA, proteins and lactose at fatty surfaces.
 (a)
(a) (b)
(b)
Figure 2. Isotherms for adsorption of hemoglobin by different powders at 28˚C, pH 6.5 in presence of 0.05 M NaCl. Upper panel: cholesterol, casein and stearic acid; Lower panel: casein powder in presence of Na2SO4 and KSCN both at an ionic strength of 0.05 M.
port mechanism [28]. Significantly high value of  for denatured protein gelatin on cholesterol surface is indicative of multilayer formation. Such multilayer formation for gelatin on polar oil surface was reported by us long back [16].
In Figure 4 adsorption isotherms of globular and compact protein lysozyme on the surfaces of cholesterol and casein respectively have been presented at pH 6.5 and NaCl concentration 0.05. Values of  for both sur-
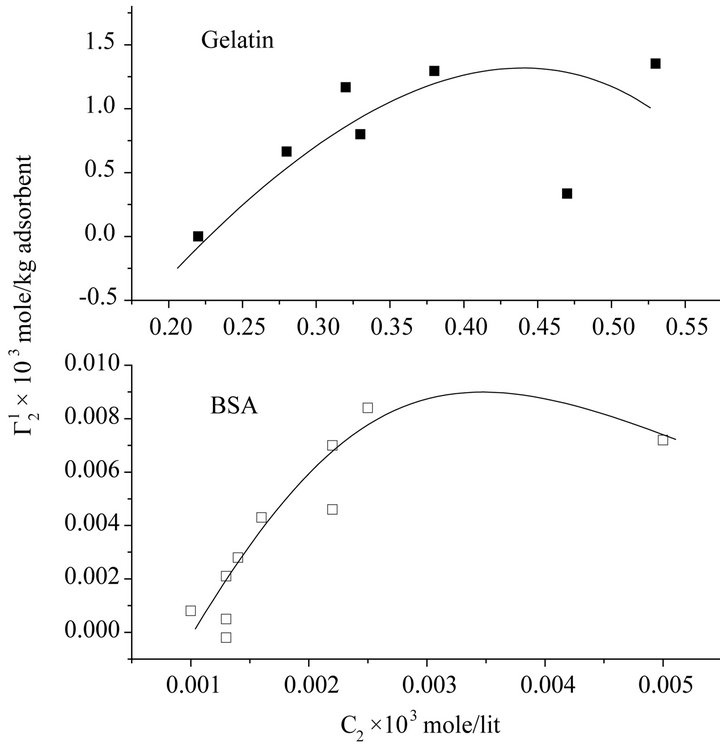
Figure 3. Isotherms for adsorption of BSA and Gelatin on the surface of cholesterol powder at 28˚C in presence of 0.05 M NaCl at pH 6.5. (a) Gelatin; (b) BSA.
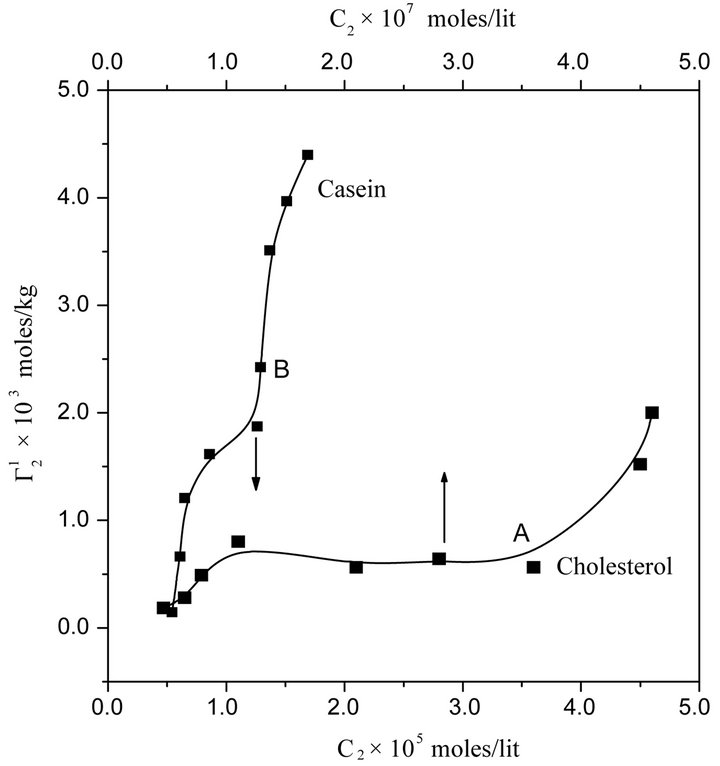
Figure 4. Isotherms for adsorption of lysozyme on the surface of powdered cholesterol (A) and casein (B) from aqueous solution of protein at 28˚C at pH 6.5 and 0.05 M NaCl.
faces are positive throughout the whole range of protein concentrations. The value of  and
and  are quite low for this protein adsorbed on cholesterol surface but at very high value of C2,
![]()
 indicating multilayer formation of adsorbed lysozyme (Figure 4). Hemoglobin and other globular protein are expected to be denatured and unfolded at the interface. Values of
  of lysozyme on soft casein surface is observed (in Figure 4) to increase with the increase of C2 reaching an apparent maximum value for
 . At this stage, it may be assumed that casein surface is covered by a monolayer of lysozyme. When C2 is further increased,
  increases further and saturates at twice the monolayer adsorbed amount. The adsorption for lysozyme on casein surface is thus a two state process; first it forms a monolayer and then at higher concentration of lysozyme it saturates to a bilayer on the casein surface.
The isotherm for the adsorption interaction of lactose with casein, milk fat, stearic acid and phosphatidyl choline respectively are shown in Figure 5. The isotherms appear to be similar to shape as that observed for the Langmuir isotherm. The values of  and
and  for higher lactose concentrations are provided in Table 1. Values of
  stand in the following order of adsorbents:
Stearic acid > phosphatidyl choline > milk fat > casein
4.1. Affinities of Adsorption
We have previously shown that values of  for adsorption of β-lactoglobulin on various types of soft organic surfaces of insoluble solid may serve as relative maximum affinities for adsorption interaction. It has also been shown that adsorption affinity can be more quantitatively expressed in terms of the decrease standard free energies of adsorption [17]. Using integrated form of Gibbs adsorption equation, the standard free energy change ΔGo for the maximum adsorption of any biopolymer per kg of soft material surfaces can be calculated as
 (8)
(8)
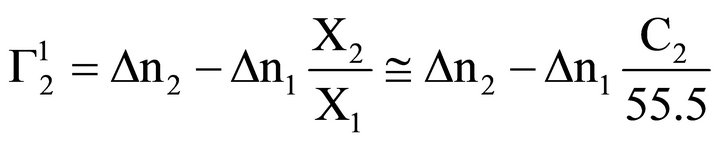
Here the mole fraction X2 equals C2/55.5 for dilute biopolymer solution. Values of −DGo for the adsorption of DNA nucleotide, lactose, hemoglobin, BSA, gelatin and lysozyme respectively on the various types of organic surfaces (e.g. cholesterol, fatty acids, fat, lipid and casein) have been evaluated. These values are presented in Table 1. It is observed that DGo for all surfaces increase with increase in . The quantity
  (called Bull’s free energy change) expressed as DGo/
 varies in the narrow range of 25 to 35 kJ per mole (Table 1) in contrast to the wide variation in the values of −DGo in kJ per kg of adsorbant. Similar variation in
  were observed for the adsorption of b-lactoglobulin for different surfaces [17]. Previously it has been shown that
  values for adsorption of proteins and nucleic acids on hard inorganic surfaces are close to 33 kJ per mole [3,4,12]. The reason for this constancy in the value of
  except for BSA adsorbed on cholesterol has

Figure 5. Isotherms for adsorption of lactose by different powder at 28˚C, pH 6.5 in presence of 0.05 M NaCl. (A) Stearic acid; (B) Phosphatidylcholine; (C) Milk fat; (D) Casein.
been qualitatively discussed elsewhere [27]. The lower value of  for BSA adsorbed on cholesterol is due to lower affinity of binding between BSA and cholesterol. This is required for biological function as BSA only acts as the carrier for cholesterol but it must release it where it is required.
4.2. General Comments on Adsorption on Hard and Soft Surfaces
Adsorption on hard surfaces is usually expressed as moles or mg or gm of adsorbate per unit square area. This is primarily because, for such rigid solid surfaces, the area of the surface remains unchanged under various conditions. However for soft matter like insoluble casein, cholesterol, and other lipids the interface with water becomes flexible because of interaction with water. Therefore the surface area does not remain constant. In such cases, adsorption cannot be expressed by conventional mole per unit area as the measurement of area in such a condition is extremely difficult. It is therefore necessary to express the adsorption as mole per unit weight of the adsorbent. Since the molecular weights of various adsorbent used here (e.g. protein, lipid etc.) differ widely, it is physico-chemically as well as thermodynamically more meaningful to compare the adsorbed amount per unit weight of the adsorbent. The thermodynamic basis of such rational has been elaborately discussed elsewhere [15,27].
• 5. CONCLUSIONS
• DNA has significant interaction with the fatty substances and the affinities in terms of  or DGo stand in the order: stearic acid > cholesterol > palmitic acid > phosphotidylcholine > milkfat
• Soluble lactose sugar also interacts with these fatty materials and the affinities follow the trend: stearic acid > phosphotidylcholine > milkfat > casein
• The protein Hb has no affinity for cholesterol but interacts with stearic acid and casein. BSA and lysozyme can interact with cholesterol. Unstructured protein gelatin is adsorbed to cholesterol with very high affinity.
• Thermodynamic analysis reveals nearly constant  for all interactions except BSA-cholesterol interaction which has slightly lower value of
 .
.
6. ACKNOWLEDGEMENTS
DKC is thankful to Indian National Science Academy for the INSA Senior Scientist support.
REFERENCES
- Bull, H.B. (1956) Adsorption of bovine serum albumin on glass. Biochimica et Biophysica Acta, 19, 464-471. doi:10.1016/0006-3002(56)90469-3
- Bull, H.B. (1957) Adsorbed monolayers of egg albumin. Archives of Biochemistry and Biophysics, 68, 102-111. doi:10.1016/0003-9861(57)90330-2
- Hajra, S. and Chattoraj, D.K. (1991) Potein adsorption at solid-liquid interfaces. 2. Affinities of proteis for alumina surface. Indian Journal of Biochemistry & Biophysics, 28, 114-123.
- Hazra, S. and Chattoraj, D.K. (1991) Protein adsorption at solid-liquid interfaces. 4. Effects of different solid-liquid systems and various neutral salts. Indian Journal of Biochemistry & Biophysics, 28, 267-279.
- Norde, W. (1986) Adsorption of proteins from solution at the solid-liquid interface. Advances in Colloid and Interface Science, 23, 267-301. doi:10.1016/0001-8686(86)80012-4
- Norde, W. (2003) Colloids and interfaces in life sciences. Marcel Dekker Inc., New York, 285. doi:10.1201/9780203912157
- Cohen, M.A. (2003) Biopolymers at interfaces. In: Malmsten, M., Ed., 2nd Edition, Marcel Dekker Inc., New York, 1.
- Norde, W., Buija, J. and Lyklema, H. (2005) Fundamentals of interface and colloid science: Soft colloids. Lyklema, J., Ed., Elsevier, Amsterdam, 5, 31.
- Gani, S.K., Mukherjee, D.C. and Chattoraj, D.K. (1999) Adsorption of biopolymer at solid-liquid interfaces. 1. Affinities of DNA to hydrophobic and hydrophilic solid surface. Langmuir, 15, 7130-7138. doi:10.1021/la970686h
- Chattoraj, D.K. and. Mitra, A. (2009) Adsorption of DNA at solid-water interfaces and DNA-surfactant binding interaction in aqueous media. Current Science, 97, 1430- 1438.
- Upadhyay, S.N. and Chattoraj, D.K. (1968) Adsorption of nucleic acids at alumina water interface. Biochimica et Biophysica Acta, 151, 561-563.
- Bull, H.B. (1971) Introduction to physical biochemistry. F. A. Davies, Philadelhia.
- Gani, S.A., Mukherjee, D.C. and Chattoraj, D.K. (1999) Adsorption of biopolymer at solid-liquid interfaces. 2. Interaction of BSA and DNA with casein. Langmuir, 15, 7139-7144. doi:10.1021/la970687+
- Halder, E., Das, K.P. and Chattoraj, D.K. (2005) Adsorption of biopolymers at hydrophilic cellulose-water interface. Biopolymers, 77, 286-295. doi:10.1002/bip.20232
- Shani, D., Chattoraj, D.K., Chattopadhyay, P. and Das, K.P. (2010) Excess adsorption of beta-lactoglobulin on the soft surfaces of casein powder. Journal of the Indian Chemical Society, 87, 205-212.
- Das, K.P. and Chattoraj, D.K. (1980) Adsorption of proteins at polar oil/water interface. Journal of Colloid and Interface Science, 78, 422-429. doi:10.1016/0021-9797(80)90582-2
- Shani Dutta, D., Chattoraj, D.K., Chattopadhyay, P. and Das, K.P. (2011) Adsorption of biopolymers and lactose sugar on soft surfaces. Adsorption of β-lactoglobulin on various types of soft surfaces. Journal of the Indian Chemical Society, 88, 1801-1810.
- Nagy, K., Váró, G. and Szalontai, B. (2012) Kappa-casein micelle build-up by its “soft” secondary structure. European Biophysics Journal, 41, 959-968. doi:10.1007/s00249-012-0854-0
- Zuyderhoff, E.M. and Dupont-Gillain, C.C. (2012) Nanoorganized collagen layers obtained by adsorption of phase-separated polymer thin films. Langmuir, 28, 2007- 2014. doi:10.1021/la203842q
- Allahverdyan, A.E., Gevorkian, Z.S., Hu, C.K. and Nieuwenhuizen, T.M. (2009) How adsorption influences DNA denaturation. Physical Review E, 79, 031903. doi:10.1103/PhysRevE.79.031903
- Hu, Q., Wang, P. and Laskin, J. (2010) Effect of surface on the secondary structure of soft landed peptide ions. Physical Chemistry Chemical Physics, 12, 12802-12810. doi:10.1039/c0cp00825g
- Binder, H. (2006) Thermodynamics of comparative surface adsorption on DNA microarrays. Journal of Physics: Condensed Matter, 18, S491-S523. doi:10.1088/0953-8984/18/18/S02
- Lowry, O.H., Rosebrough, N.J., Farr, A.L. and Randall, R.J. (1951) Protein measurement with the Folin phenol reagent. Journal of Biological Chemistry, 193, 265-275.
- Gadjos, A., Chernoff, A.I., Gray, L.H. and Lemberg, M.R. (1956) Handbook of biological data. In: Spector, W.S., Ed., WB Saunders, Philadelphia, 33-34.
- Sarkar, D. and Chattoraj, D.K. (1992) Excess adsorption of hemoglobin at solid-liquid interfaces. Journal of Surface Science and Technology, 8, 231-142.
- Mitra, A., Chakraborty, P. and Chattoraj, D.K. (2006) Thermodynamics of the interaction of globular proteins with powdered stearic acid in acid pH. Biomacromolecules, 7, 2038-2040. doi:10.1021/bm0507960
- Chattoraj, D.K. and Birdi, K.S. (1984) Adsorption at interfaces and gibbs surface excess. Plenum, New York. doi:10.1007/978-1-4615-8333-2
- McKee, G. and McKee, J.R. (2002) Biochemistry: The molecular basis of life. 3rd Edition, McGraw-Hill, New York.
NOTES
*Corresponding authors.