Open Journal of Statistics
Vol. 3 No. 5 (2013) , Article ID: 37650 , 10 pages DOI:10.4236/ojs.2013.35039
Functional Analysis of Chemometric Data*
Department of Statistics, University of Granada, Granada, Spain
Email: aaguiler@ugr.es, escabias@ugr.es, valderra@ugr.es, caguilera@ugr.es
Copyright © 2013 Ana M. Aguilera et al. This is an open access article distributed under the Creative Commons Attribution License, which permits unrestricted use, distribution, and reproduction in any medium, provided the original work is properly cited.
Received May 15, 2013; revised June 15, 2013; accepted June 22, 2013
Keywords: Functional Data Analysis; B-Splines; Functional Principal Component Regression; Functional Partial Least Squares; Functional Logit Models; Functional Linear Discriminant Analysis; Spectroscopy; NIR Spectra
ABSTRACT
The objective of this paper is to present a review of different calibration and classification methods for functional data in the context of chemometric applications. In chemometric, it is usual to measure certain parameters in terms of a set of spectrometric curves that are observed in a finite set of points (functional data). Although the predictor variable is clearly functional, this problem is usually solved by using multivariate calibration techniques that consider it as a finite set of variables associated with the observed points (wavelengths or times). But these explicative variables are highly correlated and it is therefore more informative to reconstruct first the true functional form of the predictor curves. Although it has been published in several articles related to the implementation of functional data analysis techniques in chemometric, their power to solve real problems is not yet well known. Because of this the extension of multivariate calibration techniques (linear regression, principal component regression and partial least squares) and classification methods (linear discriminant analysis and logistic regression) to the functional domain and some relevant chemometric applications are reviewed in this paper.
1. Introduction
In chemometric it is usual to have functional data whose observations are curves observed at a finite set of points (longitudinal data). In Spectroscopy, for example, we have observations of the absorbance spectrum of chemicals that is a function of wavelength. Spectroscopy is a quick and non-destructive analytical technique commonly used to measure certain parameters of interest in terms of the absorbance spectrum. In pharmaceutical industry, it is used in quality control processes to determine some variables as, for example, the amount of active ingredient of a drug. In food industry the spectrum can be used to predict the fatness of a piece of meat [1]. In medicine, fluorescence spectroscopy has been recently used for cervical pre-cancer diagnosis [2]. In other applications, the sample curves are functions of time observed in a finite set of instants. In the food industry, for example, the interest may be to classify the quality of foods made with flour according to the curves of resistance of the dough in the baking process [3].
In all the examples mentioned above, the data are curves derived from the observation of a functional variable. To analyze such data which have been developed in recent years is a branch of statistics known as Functional Data Analysis, which emerged as a generalization of the techniques of multivariate data analysis to the case of functional data [4]. Relevant applications of FDA methodologies have been first developed in different fields as economy (stock quotes), environment (temperatures and precipitations) and health sciences (degree of lupus and stress), among others [5]. Different nonparametric estimation approaches for the FDA methodologies has been developed last years [6]. Although the spectrum is clearly a functional variable, in spectroscopy there are commonly used multivariate calibration techniques that consider it as a finite set of variables associated with the observed wavelengths. But these variables are affected by multicollinearity because the spectrum is obtained as a sum of peaks of electromagnetic energy absorption by chemical substances (atoms, molecules...) so that the absorbances at two wavelengths close to each other are highly correlated. It is therefore more informative to consider the spectrum as a functional variable containing this dependence structure. When working with functional data, there are two major problems. One is the large number of variables available from discrete observation of the curves that in many cases exceed the sample size. The other is the high correlation between these variables (longitudinal data).
To solve these problems it is necessary to use statistical methods for dimension reduction such as functional principal component analysis (FPCA) [7]. The first step in FDA is to reconstruct the true functional form of the curves from discrete observations. The most common method is to assume that the sample curves belong to a finite space generated by basis functions and approximate the basic coefficients by least square approximation, in the case of noisy observed data, or interpolation when not committed error in the measurement. Thus the functional linear model becomes a multiple linear model whose design matrix is a transformation of the matrix of basis coefficients. Different applications of this model with B-splines bases have been developed in spectrometry showing improvement in the estimates when using functional modeling [8,9]. However, the design matrix of this linear model also tends to be affected by multicollinearity and high dimension when the number of basic functions used in the approximation of the curves is high. To solve these problems the techniques of principal component regression (PCR) and partial least squares (PLS) have been generalized to the functional case [4,10,11]. More recently, methods based on introducing different types of spline penalization of the roughness of the functional parameter have been introduced for the case of noisy smoothed data and applied in chemometrics [12- 15].
Another problem of interest in chemometrics is the classification of a set of curves in two or more different groups. Linear discriminant analysis (LDA) and logit models have also been generalized to the case of a functional predictor. Different estimates of these models based on PCA and PLS have been considered for the successful implementation of these techniques [3,16-19]. The lector interested in a review of functional nonparametric methods for solving the problems of regression and classification of curves, and as well as known applications in spectroscopy , must be referred to [20].
The aim of this paper is to show the potential of the FDA to solve problems in the field of chemometrics, especially in spectroscopy. To achieve this, an extensive literature review will be presented with some applications which show the good behavior of the functional methodology. Some of the calculations that appear in the research reviewed in this paper were performed in Matlab, R or SPLUS making use of the functional data analysis toolboxes that can be downloaded from Professor Ramsay’s ftp-site (ftp://ego.psych.mcgill.ca/pub/ramsay/fdafuns/). In many others the authors developed their own software.
The contents are distributed in five Sections including the introduction. Section 2 is devoted to the description of different functional chemometrics data sets analyzed by using functional data analysis methodologies, the majority of which are in the field of spectroscopy. In Sections 3 and 4, a summary of the most used FDA methods in chemometrics applications is presented. The functional linear model, functional principal component regression and functional partial least squares regression on basis expansion of sample curves are described in Section 3. Parametric methods for curve classification as functional logit regression, linear discriminat analysis and their estimation based on functional principal component analysis and functional PLS are presented in Section 4. Finally, a Section of conclusions and a list of important references related with the application of FDA methods in chemometrics are also included.
2. Examples of Functional Data Sets in Chemometrics
Functional data analysis arises mainly to address problems relating to time-like curves. However, in literature you can find numerous applications with spectrometric curves in the field of chemometrics. Spectrometry involves analyzing the spectrum of a substance measured at different wavelengths and defined as a sum of absorption peaks caused by the different chemical components present in the sample under study.
Absorption spectroscopy is employed as an analytical chemistry tool to determine the presence of a particular substance in a sample and, in many cases, to quantify the amount of the substance present. Infrared and ultraviolet-visible spectroscopy are particularly common in analytical applications. The utility of absorption spectroscopy in chemical analysis is because of its specificity and its quantitative nature. The specificity of absorption spectra allows compounds to be distinguished from one another in a mixture. The specificity also allows unknown samples to be identified by comparing a measured spectrum with a library of reference spectra. Functional statistical methods that take into account the continuous nature of the spectrum can be used to predict the amount of a substance of interest in the studied sample (functional regression) or to classify a set of spectrum curves in different groups (functional discrimination). In what follows we present different examples of chemometrics applications developed to get any of these objectives.
2.1. Predicting the Fatness from the Spectrum of Meat
This set of spectrometric data has been analyzed, among others, by [1,11,21]. The data are 215 curves of NIR spectra (recorded on a Tecator Infratec Food and Feed Analyzer by the near infrared transmission principle) that have been measured from wavelengths 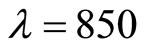 to
to 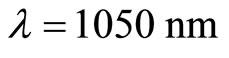 for 215 fined chopped pieces of pure meat. These curves will be denoted by
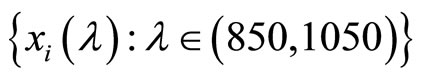
and can be seen in Figure 1. In addition to the spectrum we have the percentage of fatness that will be denoted by  for each piece of meat.
Two different problems were solved in these publications by using functional methodologies. The first was to determine the relationship between the spectrum (functional predictor) and the fatness (scalar response) by estimating a functional regression model, and to predict the amount of fat of a new piece of meat from its NIR spectrum. Functional PLS regression on basis expansion of the sampled spectra has been recently introduced in [11] to solve this problem that was previously studied in [1] by using functional nonparametric regression methods. The prediction performance of functional PLS and functional PCR has been studied on different simulated and spectrometric data sets and the results compared with those provided by discrete PLS and discrete PCR on the vectors of the observed values of the sample curves. The conclusion was that functional PLS provides better estimations of the parameter function than do functional PCR and similar predictions. In addition, it was shown that the predictive ability of discrete and functional models is almost the same. However, the ability of discrete approaches to provide an accurate estimation of the functional parameter is much lower in practice than that of functional approaches [11].
The second problem related with this data set was to classify pieces of meat in two groups  and
and . The pieces of meat with more than 20% of fatness belong to the first group and those that contain less than 20% of fatness belong to the second. This problem consists of predicting a categorical response variable
  with categories
  and
and  that represents different groups of spectra from the functional predictor
  associated to the observed NIR spectra. A nonparametric curves discrimination method was applied in [21] to solve this supervised curves classification problem. The functional PLS approach for functional linear discriminant analysis introduced in [3] and B-spline expansions of the spectra have been applied in [11] with the same objective. Both functional approaches provide good error rates in terms of misclassification error compared to other existing classification methods as CART (classification and regression tree procedure) and multivariate PLS, among others.
2.2. Classification of Biscuit Quality from the Resistance of Dough
This is other example of curves classification in food industry. The quality of a biscuit depends essentially on the quality of the flour used to make it and the producer, Danone, aims to use only flours that guarantee good product quality.
We have a set of 115 different flours. For a given flour, the resistance of dough is recorded every two seconds during the first 480 seconds of the kneading process. The results is a set of 115 curves of resistance observed at
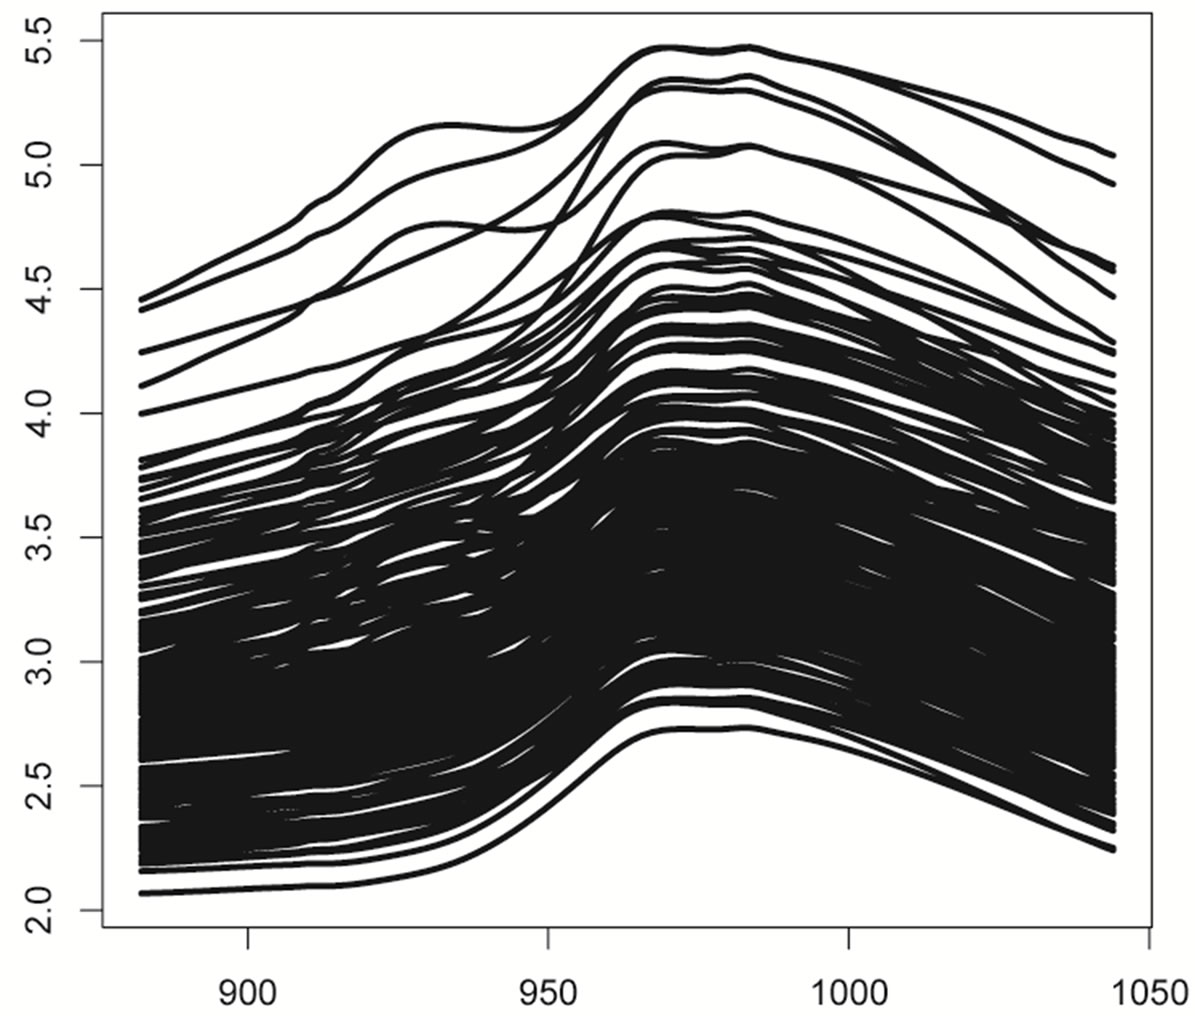
Figure 1. NIR spectra of 215 pieces of meat as functions of wavelenghts.
240 equally spaced time points in the interval  that will be denoted by
In this case the functional predictor is not the spectrum but a function of time. After kneading, the dough is processed to obtain biscuits. For each flour, we have the quality (G) of the biscuits that may be Good  Adjustable
  or Bad
  In the sample we have 50 biscuits of good quality, 25 adjustable biscuits and 40 bad biscuits (see Figure 2).
Based on the equivalence between LDA and multiple linear regression, functional PLS regression was used in [3] to estimate the discriminant function and classify the biscuits on the basis of their dough resistance curves. Bspline approximation of the sample curves were used to reduced functional PLS and functional PCR to multivariate PLS and multivariate PCR, respectively, so that the discriminant function was easily estimated [11]. Smoothed versions of functional LDA-PLS and principal component logit regression (FPCLoR) based on P-spline approximation of the sample curves with B-spline basis were recently introduced and applied to this data set to solve the problem of lack of smoothness of the estimated functional parameters [22]. A third method based on componentwise logit classification was also applied for comparison purposes [23]. From the statistical analysis of the results, it was concluded that the proposed functional methodologies (FPCLoR and LDA-FPLS) have a high classification ability with LDA-FPLS being the one that gives the highest area under ROC curve. The advantage of FPCLoR is that allows not only to solve the classification problem but also to estimate the relationship between the response variable (quality of cookies) and the predictor variable (resistance of dough during the kneading process). Several interpretations of the functional parameter based on odds ratios and principal components were proposed by concluding that good cookies have greater resistance of the dough in the late period and less resistance in the early period. The main features of the curve of resistance of good cookies were also identified by interpreting the first principal component curve [22].
2.3. Counting Data of Radioactive Isotopos
In the recent paper [24], the radioactivity of 226Ra and 137Cs is studied modeling both of them as a doubly stochastic Poisson process. This means that their intensities are also stochastic processes. Measurements were carried out with IMPO MC24E event counter, attached to a Geiger-Mullar probe supplied by Fredeiksen (Denmark). Every 10 seconds the count number has been recorded by the Datalyse software to reach 1000 data and a total of 60 of these series were recorded for each isotope. For both isotopes, the intensity process was estimated by means of functional PCA so that a stochastic estimation in terms of an expansion of uncorrelated random variables was derived without assuming any previous model for the intensity or its moments. A hypothesis test for assessing the coherence of new observed data with this continuous modeling of the intensity was also developed. This result provides a new solution to the problem of calibrating a counting device.
2.4. Other Spectrometric Applications
There are many other applications of FDA in spectrometry.
Three different instruments at Cargill Inc. (m5, mp5 and mp6 spectrometers) were used to generate the NIR spectra of 80 corn samples (see Figure 3). The spectrum was measured at 2 nm intervals in the wavelength domain  (700 observations). These NIR spectra have been used in [25] for predicting oil content of the corn samples (multivariate calibration).
In [26] the aim is to predict the composition (fat, our, sugar, and water content) of biscuit dough pieces using as predictors the NIR reflectance spectrum of dough pieces at 256 equally spaced wavelengths. This regression problem was tackled by calculating the wavelet transforms of the discrete curves and applying a Bayesian variable selection method using mixture priors to the multivariate regression of the four responses on wavelet coefficients.
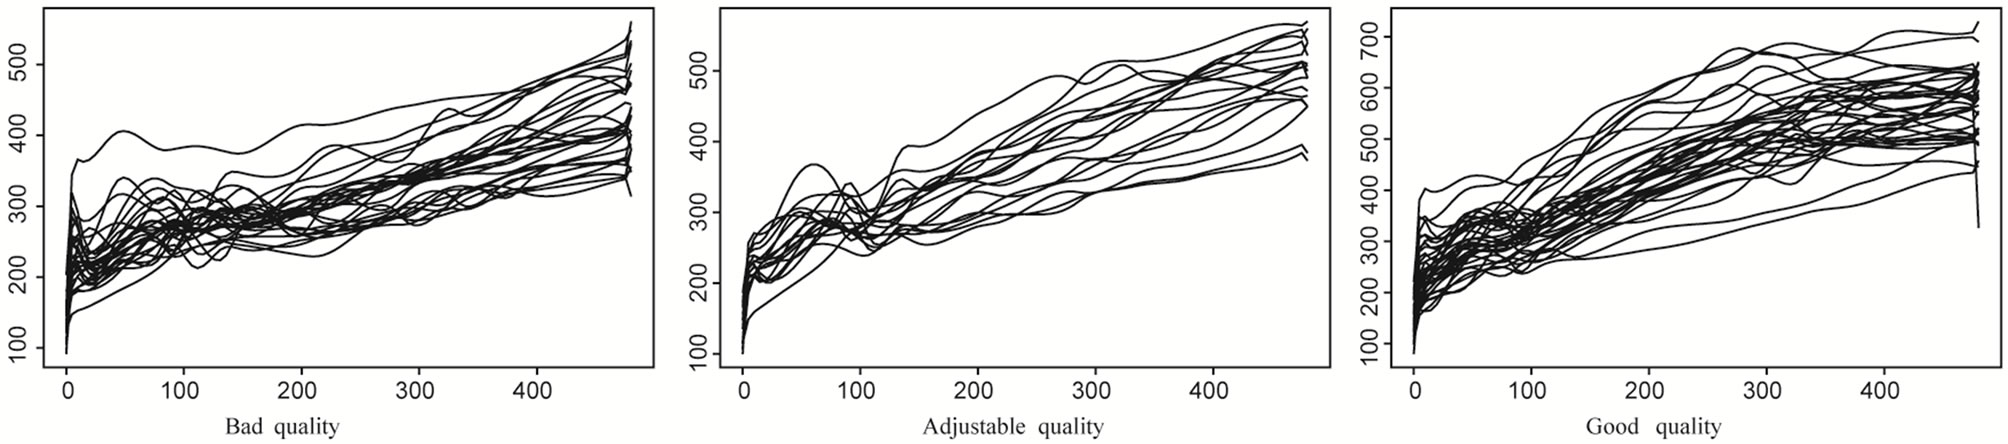
Figure 2. Curves of resistance of dough for 115 different flours.
Functional versions of PCR and PLS, which combine both using B-splines and roughness penalties, are considered in [27] to predict the response variables moisture content and protein content from NIR spectra of 100 wheat samples, measured in 2-nm intervals from 1.100 nm to 2.500 nm.
Functional linear regression and functional ANOVA on B-spline approximation of the spectrum are applied in [8] on different spectrometric data sets. In a first example, 420 NIR spectra from hog manure samples ranging from 426 to 1686 nm were used as predictor of the dry matter content (see Figure 4(a)). Different types of spline smoothing of this functional data set were compared in [13]. In a second example, the aim is to predict the cetane number of a sample of diesel from its NIR transmission spectrum. The Diesel data set was measured by the Southwest Research Institute and consists of 246 NIR spectra of 246 samples of diesel and their cetane number (see Figure 4(b)). Two different P-spline penalties for estimating functional PCA were applied to the NIR spectra of diesel data [14]. In a third example, functional analysis of variance (FANOVA) was applied to test the effect of ambient temperature and sample temperature on the spectra. The experiment followed a full factorial design with spectra from manure samples of four types of animals (dairy, beef, calf and hog), preserved at three temperatures (4, 12, +20) and measured at three ambient temperatures (4, 12, +20), having nine replicates, yielding 324 samples in total. The interpretation of the fitted FANOVA model revealed a significant effect of the ambient temperature on the intensity spectrum of manure measured using a diode array instrument. In words of the authors, this technique could be a valuable tool for the investigation and improvement of the robustness of spectroscopic techniques.
The results provided by functional linear regression and B-spline smoothing of the curves of spectrum were compared with those given by multivariate PLS regression showing that the predictive power of both, functional and discrete approaches, is similar. It was also observed that simultaneous selection of the degree of smoothness (degree of B-splines) and the dimensionality reduction (number of basis functions) based on the cross-validation prediction error may be suboptimal.
In the next Section, we are going to present a review of the main results related with the functional data analysis methodologies applied in chemometrics. These can be classified in two main groups. First, functional regression whose objective is to predict a scalar response is variable from a functional predictor whose observations are curves. Second, classification of curves in the groups is defined by the categories of a categorical response variable.
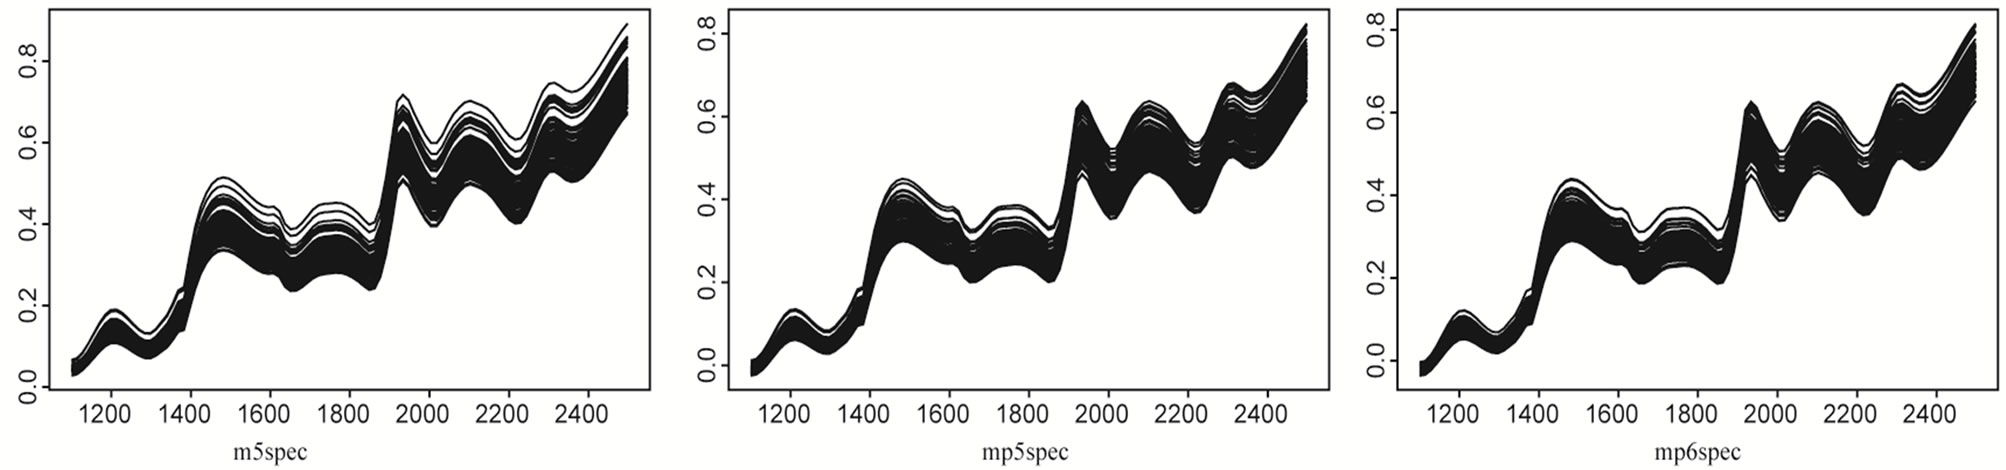
Figure 3. Curves of absorbance of 80 corn samples measured with three different spectrometers.
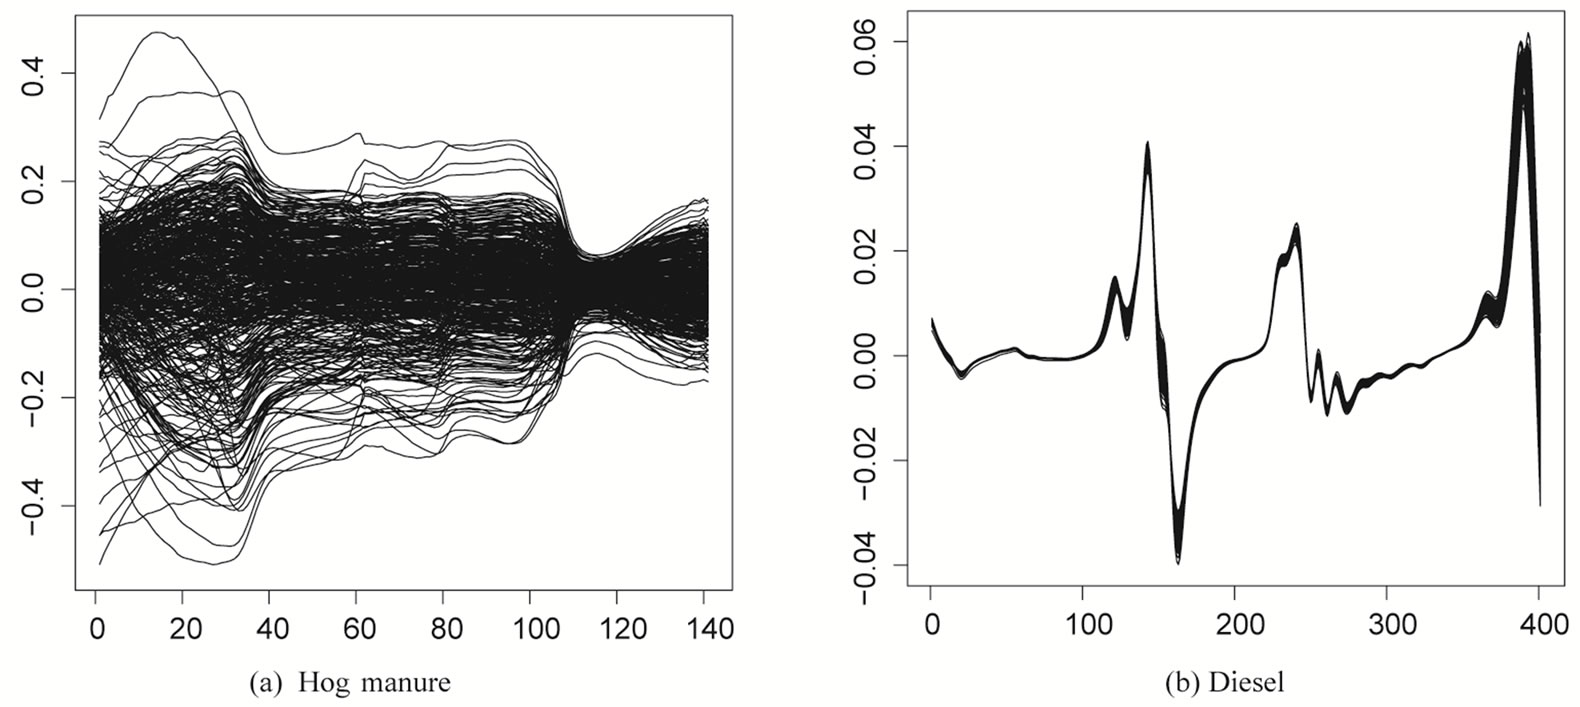
Figure 4. Absorbance spectra for samples of hog manure and diesel.
3. Functional Calibration
Let us consider the problem of predicting a scalar response variable  from a functional predictor
In spectrometry,  usually represents some chemical variable of interest and
  the NIR spectra (absorbance) of the analyzed component whose observations are really curves measured at a fine grid of wavelengths. In all the paper we will consider the usual case of a functional predictor whose realizations belong to the space
  of square integrable functions on
In applications with real data we have a random sample of pairs
that can be seen as realizations of the functional predictor  and the response variable
  respectively. The relationship between the functional predictor
  and the scalar response
  can be established from the functional regression model
 (1.1)
(1.1)
where  are independent random errors and
  is an operator that must be estimated. By assuming linearity on the operator
  we obtain the functional linear regression model with scalar response [4] given by
 (1.2)
(1.2)
If we do not assume any parametric form for  the model 0.1 is known as functional nonparametric regression model [6]. A review of the main results and spectroscopy applications of this model appears in [20].
3.1. Functional Linear Regression
The estimation of the parameters of the functional linear model 0.2 is an ill-posed problem because of the infinite dimension of the predictor space. In addition, we only have in practice discrete observations of each sample path at a finite set of knots
that could even be unequally spaced and different for the sample individuals.
A way of avoiding excessive local fluctuation in the estimated parameter function would be to use a roughness penalty approach on basis expansion of the sample curves [4,13]. One of the most common solutions to solve this problem is to assume that both the sample curves and the parameter function belong to a finite space generated by a basis of functions
so that they admit the following basis expansions:
 (1.3)
(1.3)
This way, the functional linear regression model 0.2 is equivalent to the multiple linear model
 (1.4)
(1.4)
with 
and  so that the functional calibration problem turns into multivariate calibration.
Several problems are related to the estimation of this multiple linear model. First, an appropriate basis must be selected taking into account the characteristics of the observed sample curves. In the case of absorbance spectra analyzed in spectrometric applications, the use of a B-spline basis was shown to have some similarity with the physical origin of a spectrum as the result of light absorbance by molecular bonds. The main advantage of this functional reconstruction of spectra from discrete observations lies in its combination of dimensionality reduction (number of basis functions) and smoothing (degree of B-spline basis functions). Assuming some error in the measurements (noisy data), the basis coefficients of each sampled spectrum are usually obtained by least squares approximation (spline regression) on the observed absorbance at different wavelengths [8]. Second, least squares estimation of the parameters of model 1.4 is usually affected of multicollinearity because of the high correlation between the columns of its design matrix. On the other hand, the number of basis functions needed to get an accurate approximation of the sample curves could be higher than the sample size so that a reduction dimension methodology has to be used. Both problems, high multicollinearity and high dimensionality, are usually solved by regressing the response variable on a set of orthogonal covariates as for example principal components or partial least squares components [11]. In the next Section we present the generalization of principal component regression and partial least squares regression to the case of a functional predictor.
3.2. Functional PCA and PLS Based Solutions (FPCR/FPLS)
Let us assume without loss of generality that the predictor process is center. Functional principal components and partial least squares components are uncorrelated generalized combinations of the functional predictor variables defined by
where the weight functions are the solutions to the following optimization criteria:
• Functional PCR

When the sample curves admit a basis expansion like in Equation 1.3, functional PCA is equivalent to multivariate PCA of matrix  so that the weight functions
  are computed by diagonalizing the covariance matrix of
  (see the proof in [28]).
• Functional PLS
 where
where 
 and
and . The j-th PLS step is concluded with the linear regression of
  and
and  on
on  so that
where
and
As in the case of functional PCR, functional PLS is equivalent to multivariate PLS of Y on matrix  when the sample curves are expressed in terms of basis functions (see [11] for a detailed study).
These results are very important from a computational point of view because reduce functional PCR and PLS to multivariate PCR and PLS on a transformation of the matrix of basis coefficients of the sample curves. The main problem is again to approximate the basis coefficients of sample curves from their discrete observations at a finite set of knots (times, wavelengths...) and to select an appropriate basis taking into account the main features of the observed curves. In the majority of cases it is assumed that data are observed with errors so that some type of smoothing is necessary. The most common basis are trigonometric functions used for periodic curves, B-splines for smooth curves and wavelets for curves with a strong local behavior. The basis coefficients can be approximated by using classic least squares approximation or penalizing the roughness of each sample curve [4].
In any of the two consider dimension reduction approaches, functional PCR and functional PLS, the problem has been reduced to regression of Y on a set of principal or PLS components of  In both cases the computational algorithm has the steps
• Computation and selection by cross-validation of a set of  components
• 
• Linear regression of  on the
  components
• FPCR or FPLS estimation of the parameter function
with 
4. Curves Classification
Let us now consider de problem of predicting a categorical response variable  with response categories
  from a functional predictor
  which is equivalent to the problem of classification of the sample curves in the groups defined by the response categories. Nonparametric methods for curve classification were developed in [21] and its application to classify spectrometric data revised in [20]. Functional logit regression and functional linear discriminant analysis that have been used in different applications with chemometrics data are summarized hereafter.
4.1. Functional Logit Regression
The multiple logit regression model for binary and multinomial responses has been generalized to the case of a functional response [16].
Associated to a sample of observations (curves) of the functional predictor , we have a sample of observations of the categorical response
  given by
  response vectors
  of dimension
 (1.5)
(1.5)
Each of these observations is generated by a multinomial distribution  with
with
and  Taking into account that
 is redundant, we can denote by
  the vector response for subject i, with mean vector
 Then, the multinomial response model is a particular case of generalized linear model
with link
 (1.7)
(1.7)
where  are independent and centered errors, and
  and
and  a set of parameters to be estimated. As link function components
  we can consider the classical types of logit transformations
  [16]. For example, baseline-category logits that pair each response with a baseline-category (in this case the last) are used for nominal responses
The equation that expresses baseline-category logit models directly in terms of response probabilities is
with 
The estimation of the parameter of the functional logit model presents the same problems that the functional linear model 0.2. In the case of basis expansion of the sample curves and the parameter function, the functional logit model is equivalent to a multiple logit model. In matrix form the model is given by
 (1.8)
(1.8)
for each vector of logit transformations  and each vector of parameter basis coefficients
The problems of multicollinearity and high dimension that affect this model are solved again by multinomial logit regression on a reduced set of uncorrelated principal or PLS components. As in functional linear regression, functional principal component logit regression is reduced to multiple principal component logit regression on the matrix  Different type of functional PCAs are considered in [17]. As an alternative, a functional PLS logit regression model for binary response that has as covariates a set of partial least squares components of the design matrix
  of the multiple logit model 0.8 was introduced in [18]. There are different criteria in literature to select principal components in regression methods. In the functional binary logit model, the classical method that consists of including principal components in the order given by explained variability and the one that includes them in the order given by a stepwise method based on conditional likelihood ratio test were compared on simulated data in [17]. The optimum number of principal components and PLS components (model order) is usually determined by using different criteria based on minimization the leave-one-out prediction error or the leaveone-out misclassification rate via cross-validation.
4.2. Functional Linear Discriminant Analysis
Linear discriminant analysis (LDA) in the functional data context aims to find linear combinations
so that the variance between classes is maximized with respect to the total variance
Taking into account the equivalence between LDA and multiple linear regression (binary response) and LDA and canonical correlation analysis (multiple response), a functional PLS approach for LDA with a functional predictor was proposed in [3].
• When the response  is binary
  the discriminant function
  is the parameter function of the linear regression of
  on the functional predictor
  with
with  recoded by
  if
if  and
and  if
if  Then, FPCR and FPLS regression of Y on a basis expansion of X provides different approximations for the discriminant variable (score) given by
where  is the estimation of the parameter function of the functional linear model obtained by using FPCR or FPLS in terms of a set of m components.
• When the response Y is multiple  the discriminant functions
  are the parameter functions of the linear regression of Y on the functional predictor
  with
with  defined as de vector
  of dummy variables associated to the categorical response
  and defined by expression 0.6. FPCR and FPLS on basis expansion of sample curves can be used again to obtain the discriminant variables.
5. Conclusions
A review of the FDA methodologies most used in chemometrics has been presented in this work next to different applications, most of which are in spectroscopy where the absorbance spectrum is a functional variable whose observations are functions of wavelength. The work has been divided into two main parts that can be read independently. The first part (Section 2) presents a set of chemometrics applications in most of which the aim is to either predict a variable of interest from NIR spectrum or classify a set of curves in different groups. The second part (Sections 3 and 4) gives a brief summary of the theoretical framework on functional regression and curves classification methods.
From the revised material we can conclude that functional calibration methods (functional PCR, functional PLS and functional nonparametric regression) and functional methods for curve classification (functional logit regression, functional LDA and functional nonparametric classification) have similar prediction ability for their corresponding discrete versions to analyze data that are obtained as observations of curves at a finite set of knots (wavelengths, time...). However, the FDA techniques take into account the correlation structure among the discrete observed values of a functional variable and, as a consequence, provide in many cases a more accurate estimation of the functional parameter that is very important to determine the relationship between the response and the functional predictor.
REFERENCES
- F. Ferraty and P. View, “The Functional Nonparametric Model and Application to Spectrometric Data,” Computational Statistics, Vol. 17, No. 4, 2002, pp. 545-564. http://dx.doi.org/10.1007/s001800200126
- H. Zhu and D. Cox, “A Functional Generalized Linear Model with Curve Selection in Cervical Pre-Cancer Diagnosis Using Fluorescence Spectroscopy,” IMS Lecture Notes-Monograph Series Optimality: The Third Erich L. Lehmann Symposium, Vol. 57, 2009, pp. 173-189. http://dx.doi.org/10.1214/09-LNMS5711
- C. Preda, G. Saporta and C. Lévéder, “PLS Classification for Functional Data,” Computational Statistics, Vol. 22, No. 2, 2007, pp. 223-235. http://dx.doi.org/10.1007/s00180-007-0041-4
- J. O. Ramsay and B. W. Silverman, “Functional Data Analysis,” 2nd Edition, Springer, Berlin, 2005.
- J. O. Ramsay and B. W. Silverman, “Applied Functional Data Analysis,” Springer, Berlin, 2002.
- F. Ferraty and P. View, “Nonparametric Functional Data Analysis. Theory and Practice,” Springer, Berlin, 2006.
- M. J. Valderrama, A. M. Aguilera and F. A. Ocaña, “Predicción Dinámica Mediante Análisis de Datos Funcionales, Hespérides-La Muralla,” 2000.
- W. Saeys, B. De Ketelaere and P. Dairus, “Potential Applications of Functional Data Analysis in Chemometrics,” Journal of Chemometrics, Vol. 22, No. 5, 2008, pp. 335- 344. http://dx.doi.org/10.1002/cem.1129
- C. Jiang and E. B. Martin, “Functional Data Analysis for the Development of a Calibration Model for Near-Infrared,” Computer Aided Chemical Engineering, Vol. 25, 2008, pp. 683-688. http://dx.doi.org/10.1016/S1570-7946(08)80119-8
- C. Preda and G. Saporta, “PLS Regression on a Stochastic Process,” Computational Statistics and Data Analysis, Vol. 48, No. 1, 2005, pp. 149-158. http://dx.doi.org/10.1016/j.csda.2003.10.003
- A. M. Aguilera, M. Escabias, C. Preda and G. Saporta, “Using Basis Expansions for Estimating Functional PLS Regression. Applications with Chemometric Data,” Chemometrics and Intelligent Laboratory Systems, Vol. 104, No. 2, 2010, pp. 289-305. http://dx.doi.org/10.1016/j.chemolab.2010.09.007
- N. Kramer, A.-L. Boulesteix and G. Tutz, “Penalized Partial Least Squares with Applications to B-Spline Transformations and Functional Data,” Chemometrics and Intelligent Laboratory Systems, Vol. 94, No. 1, 2008, pp. 60-69. http://dx.doi.org/10.1016/j.chemolab.2008.06.009
- A. M. Aguilera and M. C. Aguilera-Morillo, “Comparative Study of Different B-Spline Approaches for Functional Data,” Mathematical and Computer Modelling, 2013, in press. http://dx.doi.org/10.1016/j.mcm.2013.04.007
- A. M. Aguilera and M. C. Aguilera-Morillo, “Penalized PCA Approaches for B-Spline Expansions of Smooth Functional Data,” Applied Mathematics and Computation, Vol. 219, No. 14, 2013, pp. 7805-7819. http://dx.doi.org/10.1016/j.amc.2013.02.009
- M. C. Aguilera-Morillo, A. M. Aguilera, M. Escabias and M. J. Valderrama, “Penalized Spline Approaches for Functional Logit Regression,” TEST, Vol. 22, No. 2, 2013, pp. 251-277. http://dx.doi.org/10.1007/s11749-012-0307-1
- A. M. Aguilera and M. Escabias, “Solving Multicollinearity in Functional Multinomial Logit Models for Nominal and Ordinal Responses,” In: S. Dabo-Niang and F. Ferraty, Eds., Functional and Operatorial Statistics, Springer, Berlin, 2008. http://dx.doi.org/10.1007/978-3-7908-2062-1_2
- M. Escabias, A. M. Aguilera and M. J. Valderrama, “Principal Component Estimation of Functional Logistic Regression: Discussion of Two Different Approaches,” Journal of Nonparametric Statistics, Vol. 16, No. 3-4, 2004, pp. 365-384. http://dx.doi.org/10.1080/10485250310001624738
- M. Escabias, A. M. Aguilera and M. J. Valderrama, “Functional PLS Logit Regression Model,” Computational Statistics and Data Analysis, Vol. 51, No. 10, 2007, pp. 4891- 4902. http://dx.doi.org/10.1016/j.csda.2006.08.011
- M. Escabias and A. M. Aguilera, “Functional PCA and Base-Line Logit Models with Applications to the Classification of NIR Spectra,” Journal of Classification, 2013, under revision.
- F. Ferraty, A. Goia and P. Vieu, “Nonparametric Functional Methods: New Tools for Chemometric Analysis,” In: W. Hardle, M. Yuichi and P. Vieu, Eds., Statistical Methods for Biostatistics and Related Fields, Springer, Berlin, 2007, pp. 245-263.
- F. Ferraty and P. View, “Curves Discrimination: A Nonparametric Functional Approach,” Computational Statistics and Data Analysis, Vol. 44, No. 1-2, 2003, pp. 161- 173. http://dx.doi.org/10.1016/S0167-9473(03)00032-X
- M. C. Aguilera-Morillo and A. M. Aguilera, “P-Spline Estimation of Functional Classification Methods for Improving the Quality in the Food Industry,” Communications in Statistics—Simulation and Computation, 2013, in press.
- A. Delaigle, P. Hall and N. Bathia, “Componentwise Classification and Clustering of Functional Data,” Biometrika, Vol. 99, No. 2, 2012, pp. 299-313. http://dx.doi.org/10.1093/biomet/ass003
- P. R. Bouzas, N. Ruiz-Fuentes, A. Matilla, A. M. Aguilera and M. J. Valderrama, “A Cox Model for Radioactive Counting Measure: Inference on the Intensity Process,” Chemometrics and Intelligent Laboratory Systems, Vol. 103, No. 2, 2010, pp. 116-121. http://dx.doi.org/10.1016/j.chemolab.2010.06.002
- H. Tan and S. D. Brown, “Multivariate Calibration of Spectral Data Using Dual-Domain Regression Analysis,” Analytica Chimica Acta, Vol. 490, No. 1-2, 2003, pp. 291- 301. http://dx.doi.org/10.1016/S0003-2670(03)00351-9
- P. J. Brown, T. Fearn and M. Vannucci, “Bayesian Wavelet Regression on Curves with Application to a Spectroscopic Calibration Problem,” Journal of the American Statistical Association, Applications and Case Studies, Vol. 96, No. 454, 2001, pp. 398-408. http://dx.doi.org/10.1198/016214501753168118
- P. T. Reiss and R. T. Ogden, “Functional Principal Component Regression and Functional Partial Least Squares,” Journal of the American Statistical Association, Vol. 102, No. 479, 2007, pp. 984-996. http://dx.doi.org/10.1198/016214507000000527
- F. A. Ocaña, A. M. Aguilera and M. Escabias, “Computational Considerations in Functional Principal Component Analysis,” Computational Statistics, Vol. 22, No. 3, 2007, pp. 449-465. http://dx.doi.org/10.1007/s00180-007-0051-2
NOTES
*Ana M. Aguilera, Manuel Escabias, Mariano J. Valderrama, M. Carmen Aguilera-Morillo Funded by Project P11-FQM-8068 from Consejera de Innovación, Ciencia y Empresa. Junta de Andaluca, Spain and project MTM2010-20502 from Dirección General de Investigación, Ministerio de Educación y Ciencia, Spain.