Open Journal of Geology
Vol.4 No.8(2014), Article ID:49130,7 pages
DOI:10.4236/ojg.2014.48031
Radioactive Anomalies in 1:50000 Dehbakri Sheet, South of Kerman Province, Iran
Hamid Reza Jafari1, Abdollah Yazdi2*
1Islamic Azad University, Jiroft Branch, Jiroft, Iran
2Department of Geology, Kahnooj Branch, Islamic Azad University, Kerman, Iran
Email: *Yazdi_mt@yahoo.com
Copyright © 2014 by authors and Scientific Research Publishing Inc.
This work is licensed under the Creative Commons Attribution International License (CC BY).
http://creativecommons.org/licenses/by/4.0/


Received 28 June 2014; revised 25 July 2014; accepted 20 August 2014
ABSTRACT
Using airborne radiometric geophysical data, one can easily investigate a wide region in a short time and with little cost to finally find areas that are rich in radioactive elements. In this research, the uranium exploration data were first organized, filtered and classified and then the frequency distribution tables and histograms were drawn. After drawing the histograms, the statistical parameters for radioactive elements were calculated. The separation of anomaly populations was done on the basis of distribution around mean value, that is, the resulting mean, mean + 1SD, mean + 2SD, and mean + 3SD were assumed to equal to background, threshold value, the possible anomaly and the probable anomaly, respectively. In the end, representative maps of anomalies and separation of anomaly populations from the background were presented based on classical statistical calculations.
Keywords: Uranium, Anomaly, Radioactive Elements, Dehbakri, Iran

1. Introduction
In their decaying process, radioactive elements in nature radiate alpha, beta, and gamma rays. As a result of its high penetrating power, gamma-ray is used for the radiometric detection of radioactive elements particularly Uranium. Airborne gamma-ray spectrometry has been used for many years in direct prospecting for radioactive minerals and also as a tool in the delineation of lithological units, and its environmental uses have also been highly expanded. In recent years, the range of applications has been expanded including its uses in soil survey (that is in the identification of soil structure), detection of saline ground water, and determination of Uranium, Thorium, and Potassium anomalies. Recent findings include multichannel processing methods and the use of statistical methods for reducing noise in a multichannel spectrum. The valuable airborne data which have been gathered by the three companies of Prakla (from Germany), Austirx (from Australia) and C.G.G. (from France) contain very useful information for prospecting radioactive elements particularly Uranium, Thorium, and Potassium; most Uranium anomalies and deposits in Iran have been found by the analysis of these data. The use of different methods for processing and interpreting these data aimed at finding radioactive elements districts is highly important. In fact, one of the characteristics of exploration methods utilizing radioactive elements is the use of specific techniques for identifying Uranium with high accuracy in early stages of Uranium exploration as the most important of them guiding and conducting the next stages of exploration.
2. Discussion
2.1. The Study Area and Geology
The study area is located in east southern Iran in Kerman Province between 29˚15" - 29˚ southern latitudes and 58˚00 - 57˚45" eastern longitudes. The approximate extent of the study area is 614 km2 where there are various climatic conditions in different seasons of the year. Dehbakri, Morqak, Mahmood Abad, and Tavakol Abad are some of the most important villages in the area. Jebal Barez mountain ranges are visible in the eastern south of 1:50000 Dehbakri quadrangle (the study area). Access to the study area and the radioactive elements anomalies is via Jiroft main road towards Bam-Kerman road junction. After passing Dehbakri and approximately at 77 kilometers from Jiroft city towards Bam-Kerman road junction there is a dirt byroad via which and by passing a course of 7 kilometers one can reach the anomaly area. In the middle of this dirt road (approximately at the distance of 3 kilometers) is Kerman-Bam-Zahedan railroad. The region is characterized by high topographic areas in most places but the eastern and north eastern parts of the area enjoy a milder topography. However, in the environs of Jebal Barez mountain ranges the height considerably increases so that the elevations vary from 1500 m in low-altitude areas to 3168 m in high-altitude areas. In Figure 1, the schematic map of the access roads to the anomaly area has been demonstrated.
The Geology of Dehbakri and the Uranium Anomaly Area
As mentioned before the study area is located in the southern part of 1/100000 Khane Khatoon geological map. Quaternary deposits in the area include recent alluvial sediments, alluvial fans, young and old gravelly deposits and the Neogene sediments which comprise poorly lithified sandstones. Sarvestan Fault separates these sediments in the region from Eocene rhyolitic lava flows and pyroclastic deposits which form the main part of the area (Figure 2).

Figure 1. The schematic map of the access roads to the radioactive elements Anomaly areas of the Dehbakri area.

Figure 2. The boundary of Eocene pyroclastic deposits with travertine’s and quaternary sediments in the region.
The travertine deposits in the study area, located in the border between Eocene pyroclastic and quaternary deposits. Travertine deposits are highly important in that they have been formed by hydrothermal processes, the activity of thermal waters, and also the activities of travertine springs particularly in the main stream beds in the area. In the main stream beds, the travertines sometimes reach 3 meters in height appearing as massive bodies at the bottom capped by 3- to 5-cm-thick laminae in the upper parts. Although there are signs of older stone quarrying, however, the presence of crevices, cracks and also impurities make them unsuitable for use as building stones.
2.2. Analyze Method
Airborne geophysical surveys were conducted along parallel lines on a regular grid. The flight lines were surveyed at a distance of 500 m from each other. The airplane velocity for surveys conducted by steady-wing airplanes was between 50 to 60 m/s. Airborne gamma-ray spectrometric data are almost always measured along with other data obtained from indirect magnetic field measurements. The gamma-ray spectrometric data are obtained in one-second sampling intervals. In this interval, a steady-wing airplane travels a distance of 55 m along the line. This high sampling density along the flight lines and the lack of data between the lines is one of the effective airborne investigation methods. For some methods there may be a need to gather gamma-ray data in a longer distance to decrease small errors with regard to counting the channels. By the way, the final processing of the data is unchangeably done in the sampling interval of one second. Similarly, the gamma-ray spectrometric data of Dehbakri area have been obtained on this basis.
The ready to process data have been obtained from the flights done on the area. These data have been digitalized by RtiCad software and include x, y, and z components standing for longitude, latitude, and the measured concentration (criterion), respectively. For obtaining the frequency distribution of Uranium elements in Dehbakri region, the data were first organized in an ascending way from the lowest to the highest quantities. The 1/50000 geological map of Dehbakri area is numbered 7548-2 and is part of the 1/250000 geological map of Bam. The present research has been done on all the data contained in this map. The Dehbakri data include 30615 numerical data points which were organized and from which false data were omitted by filtering and were prepared for statistical calculation [1] .
2.2.1. Categorization and Frequency Distribution of Data
The airborne geophysical data were categorized in classes before doing the statistical analysis. For categorization, the range of the smallest and largest measured amounts for each class of radiometric data, including the Uranium data, were determined and divided into equal intervals. The range or interval of each class was selected based on Sturge’s rule and, as far as possible; an integer was selected [2] .
This airborne radiometric numerical data of Dehbakri area include data classes each with 30615 data points which is a wide and extended range of data. The categorization and classification of the data were done in 15 classes with 0.5 ppm intervals. The histograms of the measured data (the frequency of the elements or the factor measured) were drawn. The frequency distribution histograms of Uranium and Thorium for Dehbakri area were drawn using Excel software which is shown in Figure 3 and Figure 4, respectively.
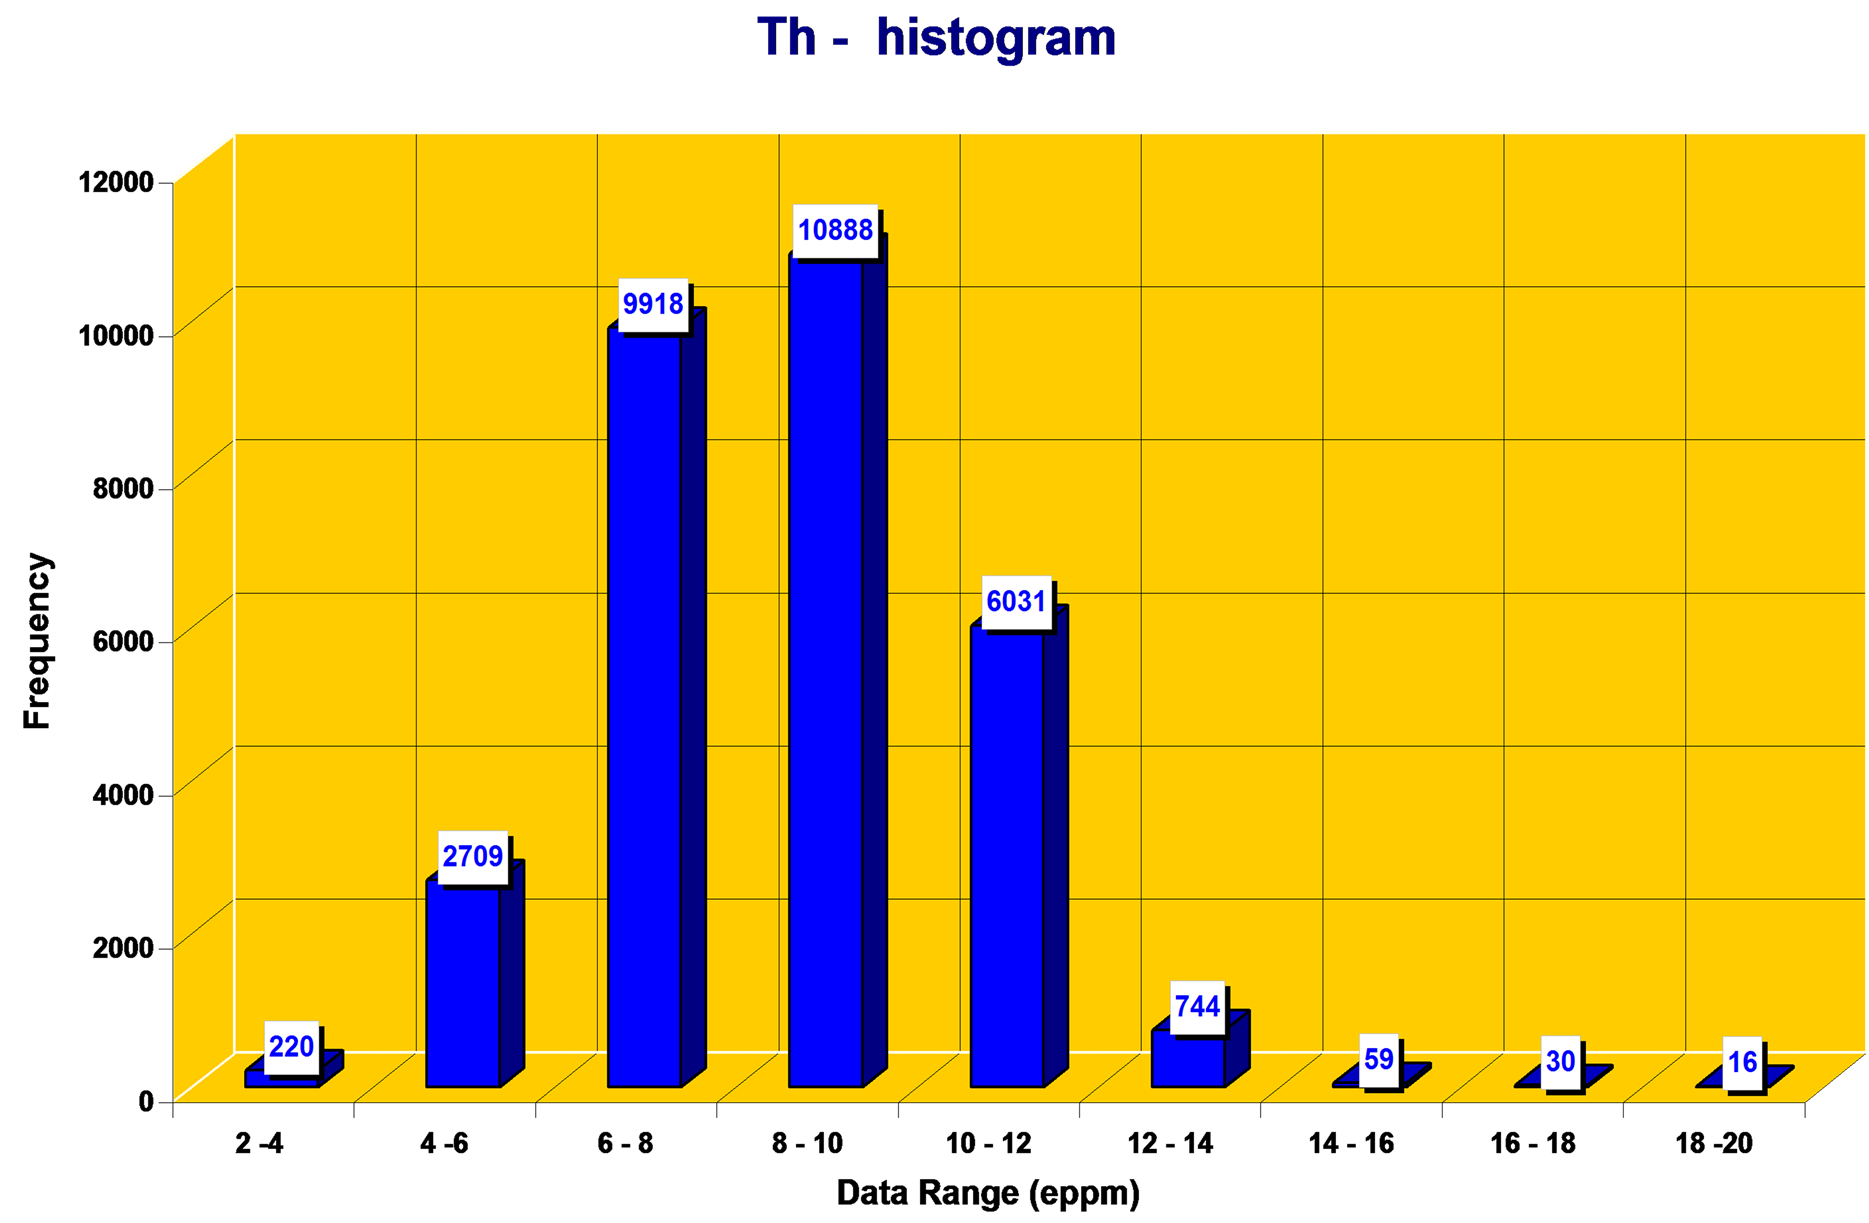
Figure 3. The frequency distribution histogram of radiometric data for the element Thorium (Th) in Dehbakri area.

Figure 4. The frequency distribution histogram of radiometric data for the element Uranium (U) in Dehbakri area.
2.2.2. Statistical Parameters and Their Calculation for Airborne Radiometric Data in Dehbakri Region
The most important statistical parameters which are used in interpreting data are mean, median, mode, variance, standard deviation, coefficient of variation, skewness and kurtosis which were calculated for airborne radiometric data of Dehbakri area for Uranium and Thorium [3] . These statistical parameters for Uranium and Thorium in Dehbakri area have been listed in Table 1 and Table 2 for separation of anomalous populations from background.
2.2.3. The Process of Separating Populations by Using Classical Statistics Based on Mean and Standard Deviation
Now by taking the calculated statistical parameters into account, we separate background
and anomaly populations for Dehbakri area. Here the mean amount ( ) is approximately indicative
of the data backgrounds. For the estimation of the threshold value, we need to calculate
standard deviation parameter (
) is approximately indicative
of the data backgrounds. For the estimation of the threshold value, we need to calculate
standard deviation parameter ( ).
). is normally considered
as the threshold value,
is normally considered
as the threshold value,
 as the possible anomaly and
 as the probable anomaly [4] . Based on the abovementioned
explanations, the separation of anomalous populations was done for Uranium and Thorium
data in Dehbakri area. Then from these values, the anomaly maps of Uranium and Thorium
from background values were prepared using Surfer software which can be seen in
Figure 5.
as the probable anomaly [4] . Based on the abovementioned
explanations, the separation of anomalous populations was done for Uranium and Thorium
data in Dehbakri area. Then from these values, the anomaly maps of Uranium and Thorium
from background values were prepared using Surfer software which can be seen in
Figure 5.
2.2.4. The Field Checking of Dehbakri Radioactive Elements Anomaly Areas
Following the areas specified based on intensity contour maps for ground-truth radiometric survey, gamma-ray spectrometry readings were done for detection of gamma-emitting elements. The geographical coordinates of each point including its longitude and latitude (X, Y) were measured by GPS and determined for all the points where gamma-ray spectrometry had been done as shown in Table3
In Table 3, the numbering of the points surveyed by gamma-ray spectrometry, geographical coordinates of spectrometric readings (X, Y), and the concentrations of the elements in eppm for the total energy of Potassium, Uranium and Thorium have been estimated.
According to the resulting measurements, the amounts of Uranium in most readings were close to background values of Uranium in lithological units. Since most anomalies are in travertine rocks (Figure 6), the probability of the existence of Radon gas in these rocks increases. No amount of Uranium was detected in the chemical analysis of samples no. 4 and 5. However, in ground-truth geophysical measurements, gamma-ray emitting from travertine rocks was recorded which can be attributed to the presence of Radon gas in these rocks.

Table 1. Statistical parameter results for Uranium (U).
Table 2. Statistical parameter results for Thorium (Th).
Table 3. Gamma-ray spectrometry readings and their separation for Uranium, Potassium and Thorium in Dehbakri area, Kerman Province.
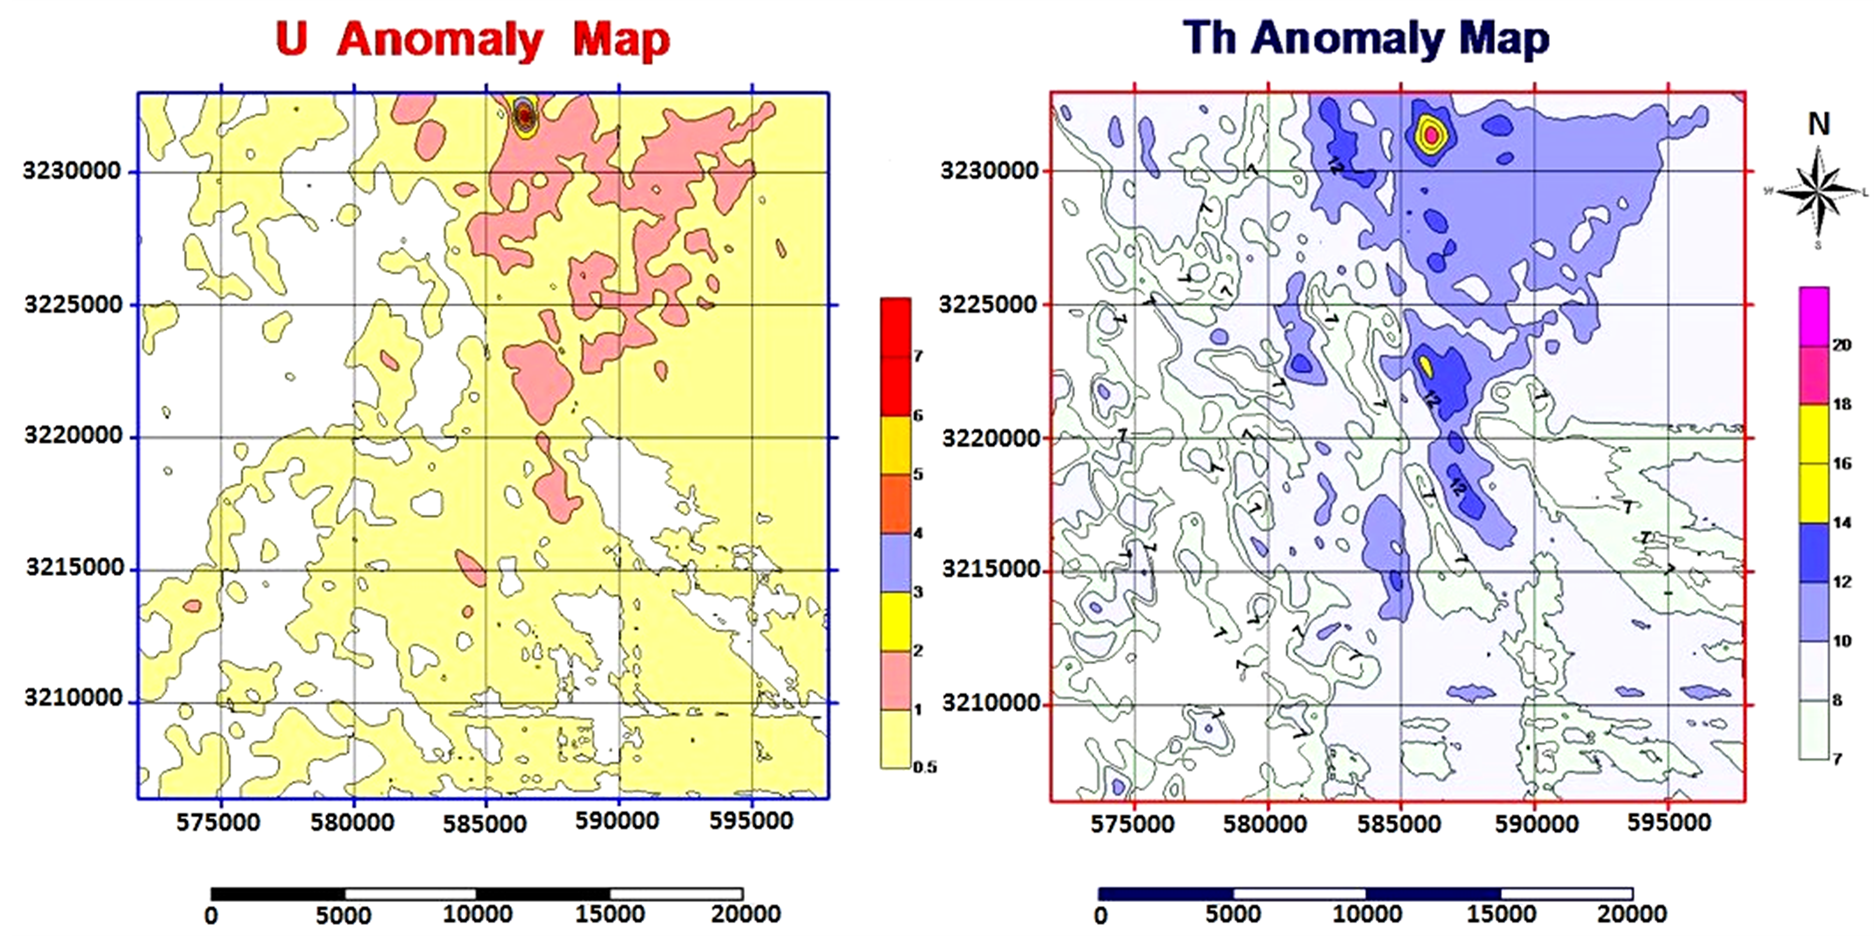
Figure 5. The Uranium and Thorium anomaly distribution map in g/t units (eppm) for Dehbakri area.

Figure 6. The sampled travertine rocks in Uranium and Thorium anomaly areas in Dehbakri area.
3. Results and Discussion
The analysis of the radiometric airborne exploration data in the Dehbakri area with the approximate data volume of 30615 radiometric airborne data was done; then, the classification and investigation of the frequency distributions of the radioactive elements in Dehbakri area with the help of the statistical methods of dissociation of anomalies and the background for thorium and uranium elements were carried out which are depicted in the Figure 5. In recent years, gamma-ray spectrometry has been used for radioactive minerals particularly those with the three radioactive elements of Uranium, Thorium and Potassium [5] . The anomaly maps of the area were prepared and the promising areas for further exploration for Uranium were introduced with acceptable accuracy. After the anomaly areas for radioactive elements were determined, the field surveys and measurements for Uranium and Thorium were done. The results did not indicate Uranium in the travertine rocks of Dehbakri anomaly areas so that the anomalies resulted from gamma-ray emissions due to the existence of Radon gas in the travertine rocks of the area. Consequently, since there is no Uranium in the travertine rocks of Dehbakri area other than Radon gas, it is suggested that further exploration for radioactive elements, specifically for Uranium, in these rocks would not be promising. Considering the results of ground-truth radiometric readings, chemical analysis, and rock petrography, no economically viable Uranium deposit was discovered in the anomaly areas of Dehbakri area.
Acknowledgements
The authors thank all editors and referee for their invaluable contributions and comments that certainly help improve the quality of this study.
References
- Hasani Pak, A.A. and Sharafoldin, M. (2001) The Analysis of Exploration Data (The Differentiation of Background Values from Anomaly, Engineering Probability and Statistics, Ore Reserve Estimation). Tehran University Press, Tehran.
- Dickson, B.L. (2004) Recent Advance in Aerial Gamma Ray Surveying. Journal of Environmental Radioactivity, 76, 225-236. http://dx.doi.org/10.1016/j.jenvrad.2004.03.028
- Hasani Pak, A.A. (1998) Geostatistics. Tehran University Press, Tehran.
- Sami, H. and Abd, N. (2001) Evaluation of Airborne Gamma Ray Spectrometric Data for the Missikat Uranium Deposit, Eastern Desert Egypt. Applied Radiation and Isotops, 54, 497-507. http://dx.doi.org/10.1016/S0969-8043(99)00255-9
- IAEA-TECDOC (2003) Guidelines for Radio Element Mapping Using Gamma Ray Spectrometry Data.
NOTES

*Corresponding author.