Journal of Surface Engineered Materials and Advanced Technology
Vol.4 No.5(2014), Article
ID:48971,14
pages
DOI:10.4236/jsemat.2014.45033
Surface Modification of Multiferroic BiFeO3 Ceramic by Argon Sputtering
Paul W. Wang1*, Matthew Guttag1, C.-S. Tu2,3
1Department of Physics, Bradley University, Peoria, IL, USA
2Graduate Institute of Applied Science and Engineering, Fu Jen Catholic University, Taipei, Taiwan
3Department of Physics, Fu Jen Catholic University, Taipei, Taiwan
Email: *pwang@bradley.edu
Copyright © 2014 by authors and Scientific Research Publishing Inc.
This work is licensed under the Creative Commons Attribution International License (CC BY).
http://creativecommons.org/licenses/by/4.0/


Received 20 June 2014; revised 24 July 2014; accepted 15 August 2014
ABSTRACT
Films fabricated by sputter deposit are extensively used in the semiconductor, optical and optoelectronic industries. However, studies to-date have focused only on analyzing the BFO films fabricated by sputter deposition. This paper’s research seeks to fill the gap in understanding the sputter effect on the target in order to fully understand the whole process of fabricating films by sputter deposition. In this study, 3 keV argon ions were continuously sputtered onto a target of multiferroic bismuth ferrite, BiFeO3, (BFO) with 5 mol% BaTiO3, in increasing time intervals. X-ray Photoelectron Spectroscopy (XPS) was applied to examine the sputtered surface after each sputter time interval. This paper makes the following findings. First, the surface-contaminant carbon was almost completely removed after 5120 seconds of sputtering. Second, the study observed twocomponent oxygen spectra remained after sputtering. Other than the chemiand physic-sorbed oxygen, these two oxygen components perhaps resulted from the short and long O-Fe bonds due to the displacement of the Fe3+ ions. Third, sputtering resulted in a change of the oxidation states of bismuth from dominant Bi3+ state to equally weighted Bi3+ state and metallic Bi˚ state. The changes of the bismuth’s oxidation states, i.e., a non-stoichiometric BFO target might alter the film compositions deposited onto the substrate. This paper shows by introducing low pressure oxygen during the sputtering, the metallic Bio on the target can be re-oxidized.
Keywords:Surface Modification by Argon Sputtering, Multiferroic BiFeO3 Ceramic, XPS

1. Introduction
Films fabricated by sputtering deposition are extensively used in the semiconductor, optical and optoelectronic industries. Many methods of sputtering deposition are available, such as RF magnetron sputtering [1] , ion beam sputtering [2] , ion-assisted deposition [3] , reactive sputtering [4] , high-power impulse magnetron sputtering [5] [6] , and gas flow sputtering [7] . Since sputtering shoots ions onto target materials before the species are deposited onto substrates, sputtering’s effect on target materials requires a detailed investigation in order to fabricate films most successfully.
Multiferroic materials [8] [9] have attracted a great deal of attention due to their unique properties and potential for multifunctional device applications [10] -[12] . Bismuth ferrite, BiFeO3 (BFO), is one of the most promising multiferroic materials due to its high ferroelectric Curie point (TC ~ 1103 K) and antiferromagnetic Neel point (TN ~ 643 K) [13] . Consequently, they are candidates for transducers, mechanical actuators, micro-electromechanical systems (MEMS), infrared sensors, and data storage applications. To enhance its ferroelectric and ferromagnetic properties, many studies have focused on BFO with various ion substitutions in the A or B sites of the perovskite structure [14] , such as BiFeO3-BaTiO3 ceramics [15] . Therefore, this study used the BFO ceramic bulk with 5 mol % BaTiO3 as the sputtering target to investigate the sputtering effect on the BFO surfaces.
2. Experiments
First, antiferromagnetic BiFeO3 ceramics were prepared from a mixture of Bi2O3 and Fe2O3 powders (purity > 99.0%). The powders were mixed with the molar ratio of 1.1 to 1 to compensate for the loss of Bi during the sintering process. After the mixture of Bi2O3 and Fe2O3, 5 mol% BaTiO3 powders were added in order to enhance the sample’s ferroelectric property. The mixed powders were then dried and calcined at 800˚C for 3 hours. High-energy ball-milling was next used to reduce powder sizes before the powders were mixed with polyvinyl acetate as a binder for granulation. The powder mixture was pressed into a 1.0 cm-diameter disk which was later sintered at 960˚C for 3 hours. Any polyvinyl acetate in the disk was evaporated after the sintering.
BFO sample was continuously sputtered by 3 keV argon ions. A X-ray Photoelectron Spectroscopy (XPS) was then applied to examine the sputtered surface and the chemical bonding environment of the elements after each sputter time interval such that a detailed sputtering effect on the stoichiometry of the target could be monitored.
The surface of the ceramic disk was contaminated by carbon as the sample was prepared in air. In order to make sure there was no surface contaminant carbon in the BFO film, a pre-sputtering is needed before the deposition. After each sputtering of the BFO target by the 3 keV argon ions at 5, 10, 20, 40, 80, 160, 320, 640, 1280, 2560, and 5120 s intervals, the XPS was applied to examine the sample surface. This study used the Perkin-Elmer 550 surface characterization system equipped with the argon sputter gun, XPS, Auger electron spectroscopy and secondary ion mass spectroscopy. All the XPS spectra were taken at room temperature (ca. 20˚C). Spectra of the core level photoelectrons of Bi 4f, Fe 2p, O 1s, C 1s, Ba 3d and Ti 2p were collected and investigated. The emission of photoelectrons was induced by Al Kα line with 1486.7 eV at 0.83386 nm. The X-rays were generated by 14 keV electrons impacting the aluminum at the power level of 225 W. The pass energy of the double-pass cylindrical analyzer was 25 eV which provided a 0.5 eV resolution. The uncertainty was ±0.5% in relative atomic concentration, and ±0.07 eV in binding energy (BE). The uncertainties were obtained by measuring the variation in Si 2p signals ten times from a high-purity fused silica sample under the same experimental conditions. Information from the XPS spectra can be obtained by use of a curve-fitting program, in which the peak position is the binding energy and the integrated area of the peak is related to the concentration of the element. By taking into account atomic sensitivity factors (ASF) of the elements and the integrated areas of the elements, the relative atomic concentrations of the surface elements could then be calculated. Two kinds of ASF of the element were provided, one with the spin-orbit splitting and the other without it. For the element with the spin-orbit splitting provided in ASF such as Bi 4f7/2 only the peak area of Bi 4f7/2 photoelectrons in all oxidation states is used to calculate the Bi concentration. However, for the element without the spin-orbit splitting provided in ASF such as Fe 2p both peak areas of 2p photoelectrons including the two sub-levels Fe 2p1/2 and Fe 2p3/2 have to be sum up in order to obtain the concentration.
The BE’s of core-level photoelectrons were calibrated according to convention by assuming that the binding energy of the adventitious surface C 1s photoelectron is 284.6 eV [16] . After long time period of sputtering little C 1s could be seen, so the O 1s signal in long O-Fe bonds was used to calibrate the binding energy. The fitting program, an AugerScan software purchased from RBD Instruments, was used to decompose the Bi 4f and O 1s XPS spectra such that the BEs of the components in Bi 4f and O 1s spectra were obtained. These BEs were then used to deduce the oxidation states of bismuth and various oxygen species, i.e., the chemical-bonding environment of the bismuth and oxygen on the surface. The pressure of the ultra-high vacuum chamber was kept at 1.0 × 10⁻⁸ Torr during the sputtering.
Two kinds of XPS spectra were taken after each sputtering. The survey spectra were wide-range scans to monitor the binding energies (BEs) of photoelectrons from 1100 to 0 eV. The multiplex ones were narrow range scans taken at more specific BE ranges to more closely observed the major core-level photoelectrons from the main elements on the sample surface, such as Bi 4f, Fe 2p, O 1s, C 1s, Ba 3d and Ti 2p.
3. Results and Discussion
Figure 1 shows the survey spectra before and after 160, 640, and 5120 s of sputtering. Each spectrum after sputtering was shifted vertically for better presentation. Since the spectrum after each sputtering was shifted vertically, the background signals at the BE of 1100 eV of all the spectra could be seen with the same intensity. The vertical axis shows the intensity of the count of photoelectrons at each binding energy during the XPS measurements, while the horizontal axis represents the binding energy of the photoelectron. The background spectrum without peaks originated from the photoelectrons via inelastic scattering. The study detected all the main elements in the sample, which included Bi, Fe, O, Ba, Ti and C, because peaks at different BEs in the spectrum resulted from the core-level photoelectrons without kinetic energy loss before being collected by the energy analyzer. The signal of the surface-contaminant carbon, C 1s, is located at 284.6 eV, which clearly decreased after the sputtering and was completely removed from the surface after 5120 s of sputtering. Several Auger signals were also detected, such as O (KLL), Ba (MNN), and Fe (LMM). The Auger Fe (LMM) signal included three Auger Fe signals, L3M23M23 (at 655.2 eV), L3M23V (at 606.1 eV), and L3VV (at 551.0 eV) [17] .
The peak heights of Fe 2p, O 1s, and Ba 3d signals increased, but the Bi 4f signal increased, then decreased, and then leveled off as the sputter time increased in Figure 1. This surface segregation of Bi has been observed and reported by other studies, for example, in the (Bi2O3)0.75(Er2O3)0.25 ceramic, titania films, and bismuthiron-garnet films [18] -[20] . In order to reconfirm this trend and understand how the surface composition/bonding environment changed as a function of sputter time, the multiplex spectra of C 1s (from 290 to 280 eV), Bi 4f5/2 and 4f7/2 (from 170 to 153 eV), Fe 2p1/2 and 2p3/2 (from to 736.2 to 700 eV), O 1s (from 535 to 525 eV), Ti 2p3/2 (from 470 to 450 eV), and Ba 3d3/2 and 3d5/2 (from 803 to 775 eV) were collected. Since the relative concentrations of Ti 2p3/2, Ba 3d3/2 and 3d5/2 on the surface were low and there were no changes in their peak positions and line-shapes after each sputtering, the multiplex spectra of Ti 2p3/2, and Ba 3d were not shown here. The detailed multiplex spectra of C 1s, Fe 2p1/2 and Fe 2p3/2, O 1s, and Bi 4f5/2 and 4f7/2, before and after 160 s, 640 s, and 5120 s sputtering were shown in Figures 2-5, respectively. Again, in order to see the changes of spectra clearly, each spectrum after sputtering was shifted vertically.
Figure 2 shows that after 5120 s of argon-ion sputtering, the surface contaminant carbon removed. As the sputtering time intervals increased, there were no changes in the peak positions and line-shapes, but the peak height reduced considerably. This decrease in the carbon caused by sputtering indicates that it is necessary to pre-sputter the BFO target in order to achieve the carbon-free BFO films on the substrate.
Figure 3 shows that the line-shapes and the peak positions of the Fe 2p1/2 and 2p3/2 spectra remained the same after the sputtering, but the intensity increased as the sputtering increased. According to Schedel-Niedrig et al. [21], the binding energy of Fe 2p3/2 located at 711.0 eV are photoelectrons from Fe3+ ions and 709.0 eV from Fe2+ ions. However, in Figure 3, this study found that the oxidation state of Fe on BFO surface before and after sputtering is 3+.
Figure 4 shows the curve-fitting that is necessary to explain how the O 1s signals exactly varied when the sputtering time interval increased. However, both the peak positions and the line-shapes depended on how long the sample was sputtered. There were O 1s photoelectrons detected at the higher BE ranges as seen in before and after the 160 s spectra. An extra component in the signal at lower BE was also observed before the sputtering.
Figure 5 shows that after sputtering, the line-shapes of the Bi 4f5/2 and 4f7/2 spectra changed and broadened in which double peaks were developed. The broadening of the Bi signal after the sputtering clearly indicates changes in the chemical bonding environment.
Figure 6 shows the relative atomic concentrations of the surface elements as functions of the sputtering time, and thus it provides a broad picture of how the sputtering affected the surface compositions. More accurate relative atomic concentrations of all the elements were calculated by use of the peak area of each signal from spe-
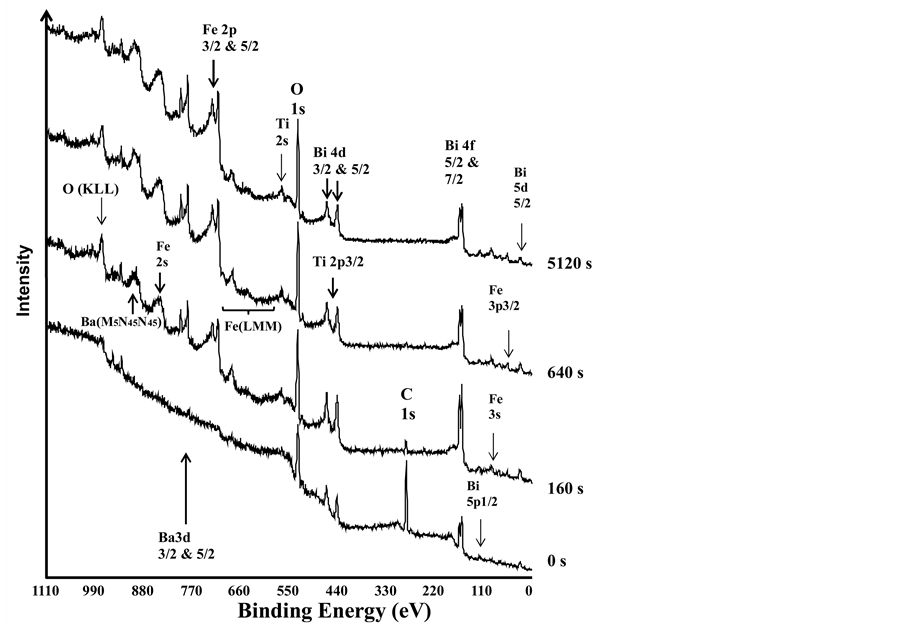
Figure 1. The survey scans of the XPS spectra of BFO before and after 160 s, 640 s, and 5120 s argon sputtering.

Figure 2. The C 1s XPS signals before and after 160, 640, 2560 and 5120 s argon sputtering. Carbon was almost completely removed after 5120 s sputtering.
cific photoelectrons determined by curve fitting, plus the atomic sensitivity factors of all the elements, ASF of C 1s = 0.205, ASF of Bi 4f7/2 = 2.8, ASF of Fe 2p = 3.8, ASF of O 1s = 0.63, ASF of Ba 3d5/2 = 6.1, ASF of Ti
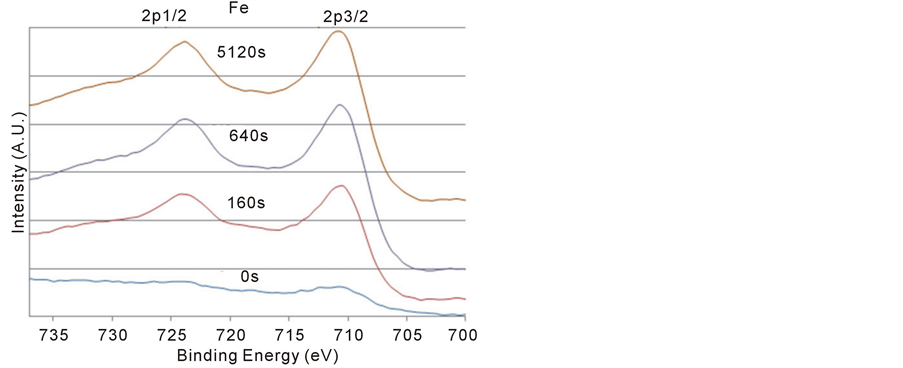
Figure 3. The Fe 2p XPS signals before and after 160, 640, and 5120 s argon sputtering. No BE shifts and changes in the line shapes after sputtering.
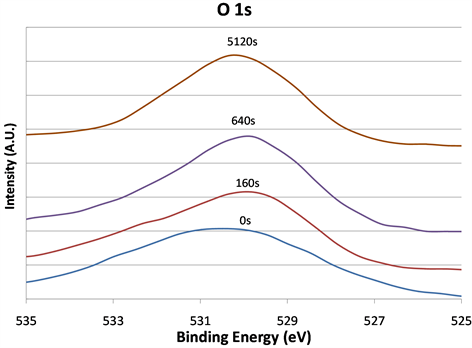
Figure 4. The O 1s XPS signals before and after 160, 640, and 5120 s argon sputtering. Shifts in peak position and changes in line shapes were observed after sputtering.
2p3/2 = 1.1 [17] . After carbon was almost completely removed, the relative concentrations of oxygen and all the metals, Bi, Fe, Ba, and Ti, reached saturation levels.
Because only O 1s and Bi 4f experienced line-shape changes after sputtering, analyzing these elements’ multiplex spectra will show how sputtering modifies the chemical environment or oxidation states. Four spectra of the O 1s and four spectra of Bi 4f were selected for investigation; they were before and after 160, 640 and 5120 s of sputtering.
First this section will discuss the changes in line shapes of the O 1s. The curve-fitting results of O 1s spectra are shown in Figures 7(a)-(d), respectively. The fitting parameters of O1s are listed in Table1 Four oxygen components located at 533.37, 531.36, 529.61, and 528.32 eV were found. The highest binding energy component (HBEC) located at 533.37 eV can be attributed to the oxygen bonded to carbon, C-OH, C-O-C, or the adsorbed oxygen linked to carbon on the surface of the film [22] -[24] . The lowest BE component (LBEC) of oxygen species at 528.32 eV was physi-sorbed surface oxygen. The BE position is similar to that reported by Barteau and Madix’s study for atomic oxygen (O˚) adsorbed onto metallic silver and copper surfaces (528.3 eV) [25] .
Figure 3 further shows that both surface-adsorbed species were sputtered off quickly; LBEC was removed after 160 s and HBEC after 640 s when the C 1s signal was significantly reduced too. That sputtering quickly
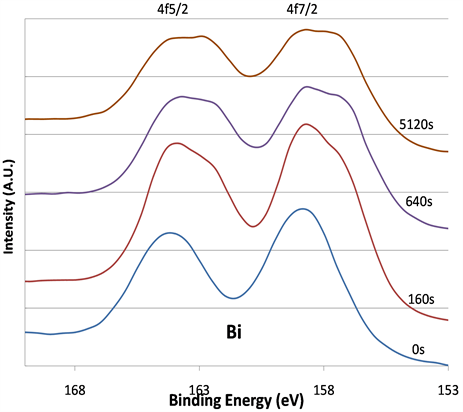
Figure 5. The Bi 4f XPS signals before and after 160, 640, and 5120 s argon sputtering. Signal at low BE range in the double peaks grow as sputtering time intervals increase.
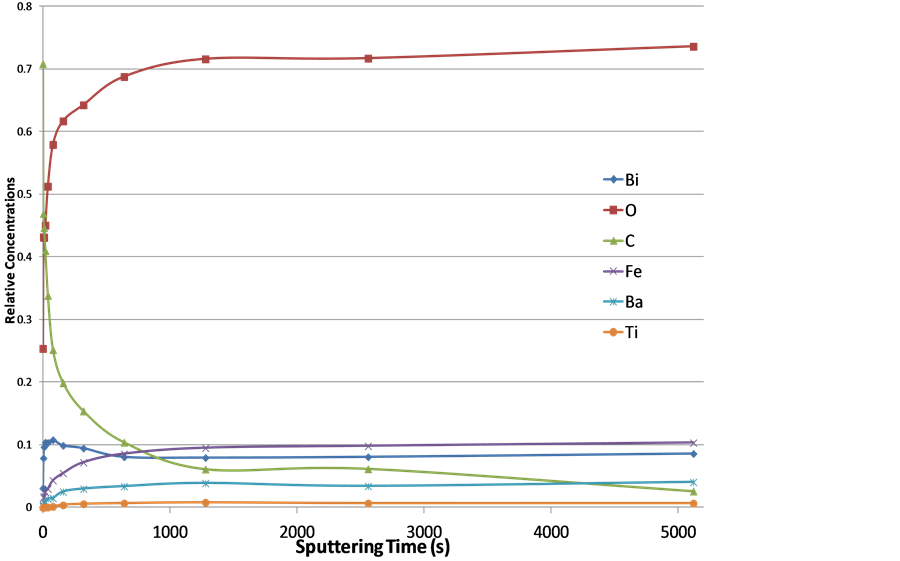
Figure 6. The relative atomic concentrations of Bi, Fe, O, Ba, Ti, and C as functions of sputtering intervals. All the elements reach the saturation levels after 1280 s sputtering.

Table 1. O 1s spectrum fitting parameters.
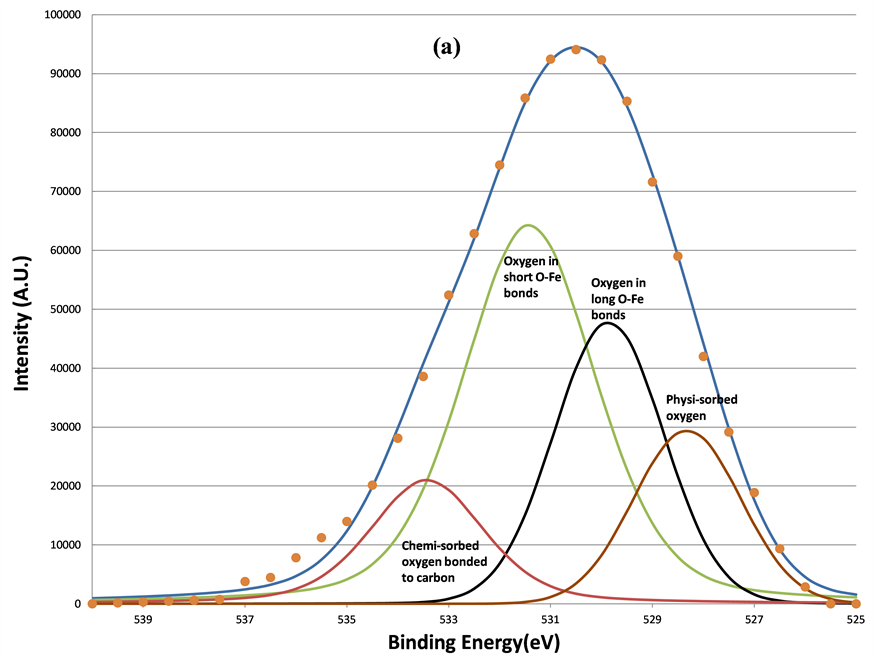
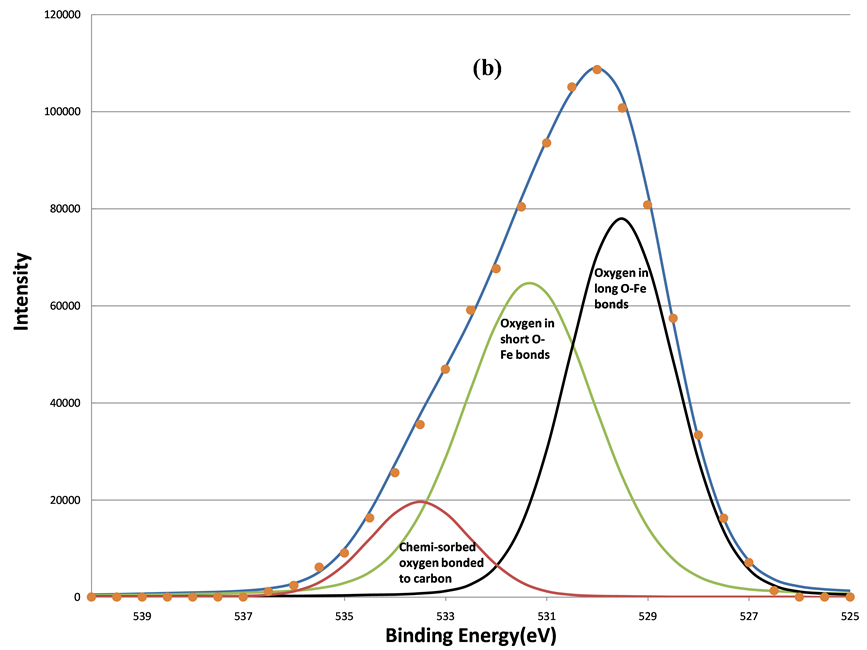
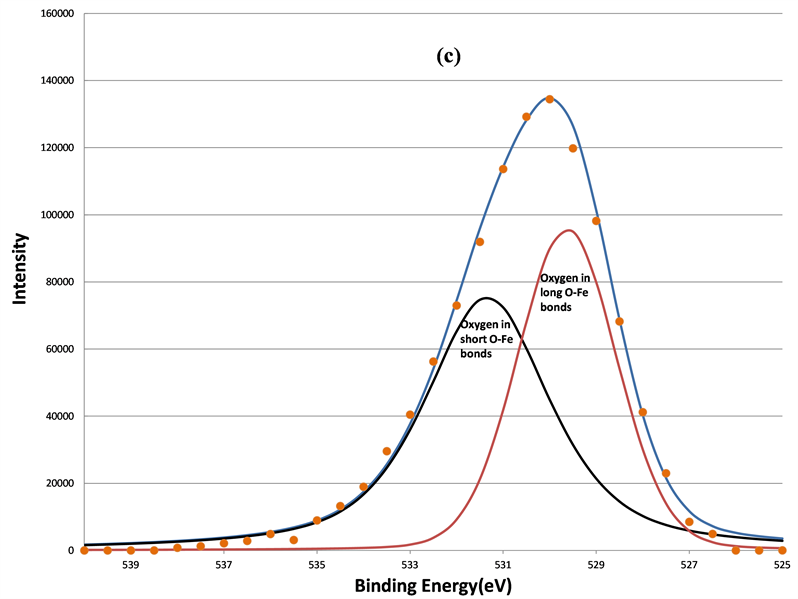
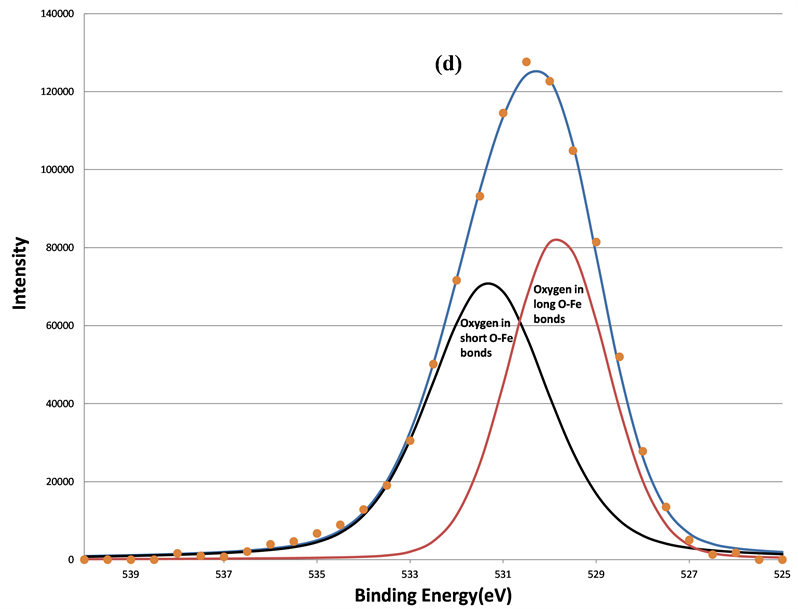
Figure 7. The decomposition of the O 1s signal by curve fitting before (a); after 160 s (b); after 640 s (c); and after 5120 s (d) sputtering. The physi-sorbed oxygen was removed first after 160 s sputtering, the chemi-sorbed oxygen bonded to carbon was removed after 640 s sputtering, two remained components are oxygen in short O-Fe and long O-Fe bonds, respectively.
eliminated the surface-adsorbed species indicates they are physi-sorbed oxygen species and oxygen bonded to surface-contaminant carbon. Only two oxygen components remained after 640 s of sputtering.
By using the charge transfer concept, Mandal et al. found that the BEs of O 1s from three different samples, Bi2O3, BFO, and Fe2O3 in an increasing order [26] . The well-known BE position of the O 1s in Fe2O3 is 530.1 eV [27] [28] . However, in this study, only two components of O 1s in BFO were observed near 530.1 eV. Since the ferroelectric property of the BFO was caused by the distortion of Fe-O bond in the unit cell, two kinds of O-Fe bonds were created. One was a long O-Fe bond and the other was a short bond. These two different bond lengths of O-Fe bonds have been confirmed by other high-resolution neutron diffraction studies [29] [30] . It is harder to emit the O 1s photoelectron from the tightly bonded O-Fe than it is to emit loosely bonded O-Fe, so O 1s photoelectrons from short O-Fe bonds have low kinetic energy, and hence a higher BE at 531.36 eV. Similarly, the lower BE O 1s component at 529.61 eV originates from oxygen in long O-Fe bonds.
Other studies have also found two components of O 1s spectra with alternative explanations. Simon et al. used bismuth germinate glasses, and they explained that the higher BE O1s component was due to the bridging oxygen and the lower BE O1s was caused by non-bridging oxygen [31] . Wang et al. studied BFO ceramic, and they attributed the higher BE component to oxygen in the BFO phase and the lower BE O 1s to the oxygen in the BFO impurity phase, Bi36Fe2O57 [32] . Wang et al. claimed the impurity phase contained Fe2+ ions and oxygen deficient species.
In this work, there were no apparent BE shifts at 710.75 eV and line-shape changes in the Fe 2p spectra as shown in Figure 3. This indicates that the Fe3+ ions were the dominant species on the BFO surfaces before and after sputtering. The significant influence of the displacement of Fe3+ ions on the BE of O 1s was obvious due to the higher Fe3+ concentration and lower Bi3+ concentration. Therefore, even though previous studies observed defects in the BFO, the displacement of Fe3+ ions played the dominant role in creating two O 1s components.
In addition to two O 1s components, increased sputtering also resulted in the broadening of the Bi 4f signals at lower BE range. This indicates the growth of the lower BE component of Bi 4f signals. Judging from the BE positions of Bi, 157.3 eV for Bio 4f7/2 [33] , 159.2 eV for Bi3+ 4f7/2 [34] , and 5.39 eV BE differences between the 5/2 and 7/2 photoelectrons due to spin-orbit split, two oxidation states of bismuth, Bi˚ and Bi3+, were applied to fit the spectra. The fitting parameters of Bi 4f5/2 and 4f7/2 are listed in Table2 That the full-width-at-half maximum (FWHM) in each Bi 4f component in Table 2 was much broader than that of pure Bi metal (~1.30 eV) in reference 15 indicates the complex bonding in BFO ceramics. The increase in the metallic Bi, i.e., Bio, by the sputtering is clearly seen from (a) to (d) in Figure 8. The percentage of the metallic Bi out of the total Bi as a function of the sputtering interval is listed Table3 Table 3 shows that the metallization of Bi induced by the sputtering increased as the sputter time interval increased. Hence fewer Bi3+ ions could interact with oxygen. In other words, approximately half of the total Bi was metallized by the sputtering such that the influence of the Bi3+ ions on the O 1s BE was no longer dominant compared to Fe3+ ions. Moreover, there were no apparent decreases of the O1s components located at 531.36 and 529.61 eV. This further supports the study’s explanation of the two components as attributable to short O-Fe and long O-Fe bonds. This evidence is consistent with the ferroelectric feature of BFO, whose spontaneous polarization is associated with the displacement of Fe3+ ions. These magnetic and electrical characteristics of the sample have been confirmed by previous studies [35] .
Table 2. Bi 4f 7/2 and 5/2 spectrum fitting parameters.
Table 3. The percentage of Bio in the total Bi signal as a function of sputtering interval.
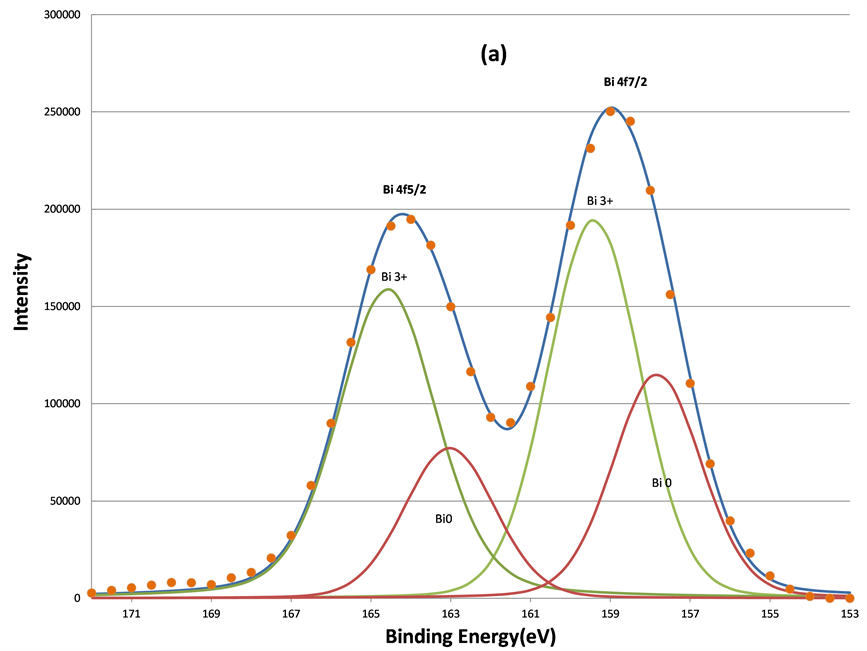
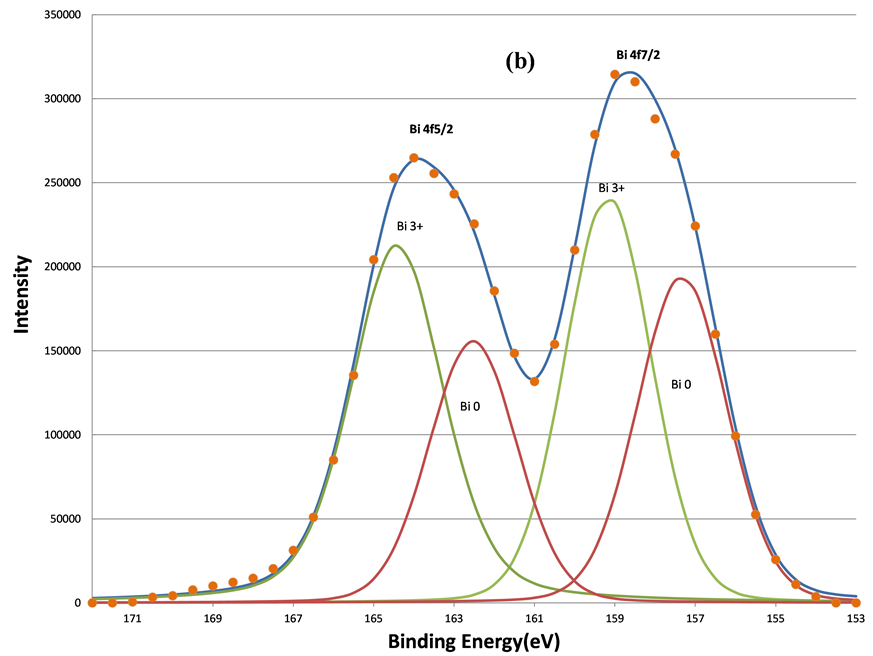
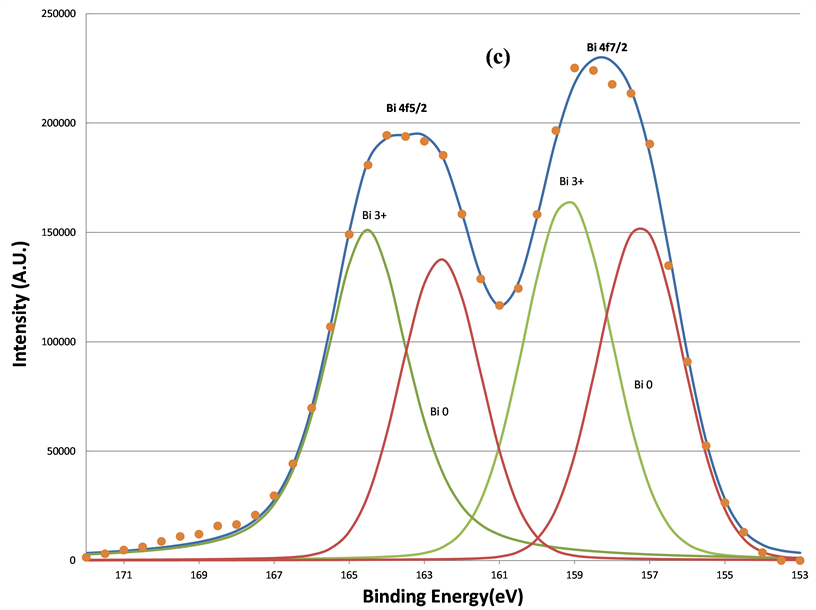
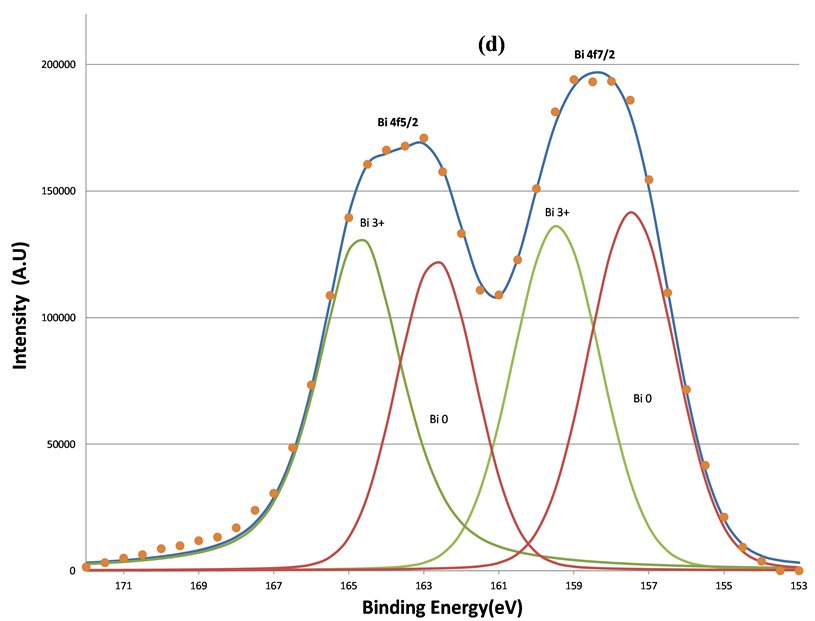
Figure 8. The decomposition of the Bi 4f signal by curve fitting before (a); after 160 s (b); after 640 s (c); and after 5120 s (d) sputtering. The metallic Bi component, Bi˚, induced by sputtering grows as the sputtering increasing.
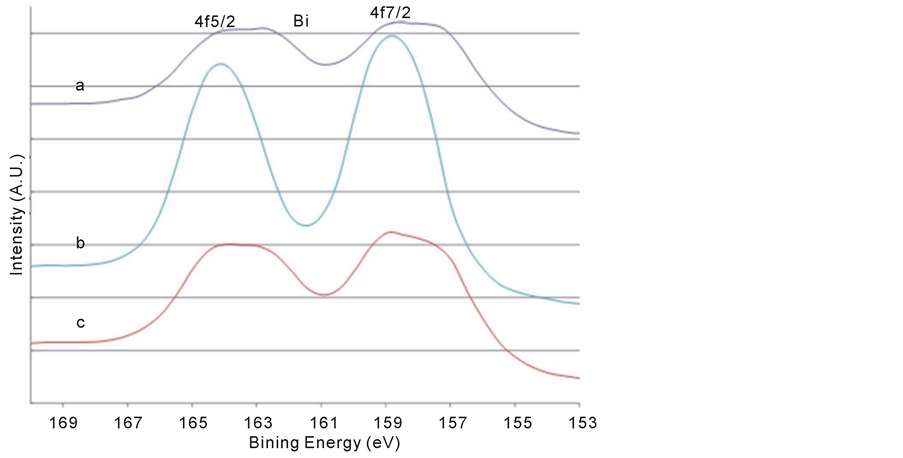
Figure 9. The Bi 4f XPS signals after various treatments: after 5120 s sputtering (a); then exposed to air for 24 hours (b); and then further sputtered for 600 s (c). It is clearly seen the re-oxidization of metallic Bi in air.
Further evidence supports the assignment of the Bio and Bi3+ components in Bi 4f spectra in Figure 8 was obtained by exposure of the 5120 s sputtered sample to air for 24 hours at room temperature as shown in Figure 9(a) and Figure 9(b). It is clear that the re-oxidization of the metallic Bi occurred, since the Bi˚ species disappeared after the exposure to air. This also indicates that the non-stoichiometric BFO films (containing the metallic Bi) prepared by the ion beam sputtering method can be eliminated by using the oxygen ambient during the sputtering deposition. Moreover, the conversion from Bi3+ ion to metallic Bi˚ in the BFO after further 600 s sputtering on the sample previously exposed in air shown in Figure 9(c) demonstrates again the metallization of Bi under argon sputtering.
4. Conclusion
This study identified two oxygen chemical states, a higher BE component at 531.36 eV due to the oxygen in O-Fe short bonds and a lower BE component at 529.61 eV due to the oxygen in O-Fe long bonds, both resulting from the displacement of Fe3+ ions. The displacement of Fe3+ ions is direct evidence of the ferroelectric properties in BFO. Other than oxygen in O-Fe bonds, this study also observed the highest BE component at 533.37 eV caused by chemi-sorbed oxygen bonded to carbon and the lowest BE component at 528.32 eV due to physi-sorbed oxygen. Both physicand chemi-sorbed species were sputtered off quickly. Sputtering induced metallization of Bi on the surface of ceramic BFO target by 3.0 keV argon ions was observed. This effect on the BFO target may affect the non-stoichiometric composition of the BFO films deposited by ion beam sputtering technique. The solution to solving this problem is not only to use the argon beam to sputter the BFO target but also to prevent the formation of the sputtering-induced metallic Bi˚ species on the target surface by introducing the oxygen in the deposition chamber. However, further investigation is necessary to conclusively determine the ideal suitable oxygen partial pressure to be used in the sputtering deposition processes to re-oxidize the metallic Bi.
Acknowledgements
Paul W. Wang acknowledges the partial support from a Research Grant of Bradley University.
References
- Zheng, R.Y., Gao, X.S., Zhou, Z.H. and Wang, J. (2007) Multiferroic BiFeO3 Thin Films Deposited on SrRuO3 Buffer Layer by rf Sputtering. Journal of Applied Physics, 101, Article ID: 054104. http://dx.doi.org/10.1063/1.2437163
- Hsu, J.-C., Chen, Y.-Y., Lin, Y.-H., Lee, C.Y., Yao, Y.D. and Wang, P.W. (2012) Post-Annealing Properties of Aluminum-Doped Zinc Oxide Films Fabricated by Ion Beam Co-Sputtering. Vacuum, 87, 227-231. http://dx.doi.org/10.1016/j.vacuum.2012.02.054
- Chen, H.-L., Hsu, J.-C., Wang, P.W., Lin, Y.-H., Wu, K.-T. and Liu, C.-R. (2009) AlF3 Film Deposited by IAD with End-Hall Ion Source Using SF6 as Working Gas. Applied Surface Science, 256, 1232-1235. http://dx.doi.org/10.1016/j.apsusc.2009.05.138
- Kelly, P.J., Abu-Zeid, O.A., Arnell, R.D. and Tong, J. (1996) The Deposition of Aluminium Oxide Coatings by Reactive Unbalanced Magnetron Sputtering. Surface and Coatings Technology, 86-87, 28-32. http://dx.doi.org/10.1016/S0257-8972(96)02997-0
- Bohlmark, J., Lattemann, M., Gudmundsson, J.T., Ehiasarian, A.P., Aranda Gonzalvo, Y., Brenning, N. and Helmersson, U. (2006) The Ion Energy Distributions and Ion Flux Composition from a High Power Impulse Magnetron Sputtering Discharge. Thin Solid Films, 515, 1522-1526. http://dx.doi.org/10.1016/j.tsf.2006.04.051
- Konstantinidis, S., Hemberg, A., Dauchot, J.P. and Hecq, M. (2007) Deposition of Zinc Oxide Layers by High-Power Impulse Magnetron Sputtering. Journal of Vacuum Science & Technology B, 25, L19. http://dx.doi.org/10.1116/1.2735968
- Ishii, K. (1989) High-Rate Low Kinetic Energy Gas-Flow-Sputtering System. Journal of Vacuum Science & Technology A, 7, 256. http://dx.doi.org/10.1116/1.576129
- Kimura, T., Goto, T., Shinatani, H., Ishizaka, K., Arima, T. and Tokura, Y. (2003) Magnetic Control of Ferroelectric Polarization. Nature, 426, 55-58. http://dx.doi.org/10.1038/nature02018
- Wang, J., Neaton, J.B., Zhang, H., Nagarajan, V., Ogale, S.B., Liu, B., Viehland, D., Schlom, D.G., Waghmare, U.V., Spaldin, N.A., Rabe, K.M., Wuttig, M. and Ramesh, R. (2003) Epitaxial BiFeO3 Multiferroic Thin Film Heterostructures. Science, 299, 1719-1722. http://dx.doi.org/10.1126/science.1080615
- Tokura, Y. and Seki, S. (2010) Multiferroics with Spiral Spin Orders. Advanced Materials, 22, 1554-1556. http://dx.doi.org/10.1002/adma.200901961
- Ramesh, R. and Spaldin, N.A. (2007) Multiferroics: Progress and Prospects in Thin Films. Nature Materials, 6, 21-29.http://dx.doi.org/10.1038/nmat1805
- Eerenstein, W., Mathur, N.D. and Scott, J.F. (2006) Multiferroic and Magnetoelectric Materials. Nature, 442, 759-765.http://dx.doi.org/10.1038/nature05023
- Lebeugle, D., Colson, D., Forget, A. and Viret, M. (2007) Very Large Spontaneous Electric Polarization in BiFeO3 Single Crystals at Room Temperature and Its Evolution under Cycling Fields. Applied Physics Letters, 91, Article ID: 022907. http://dx.doi.org/10.1063/1.2753390
- Chakrabarti, K., Das, K., Sarkar, B., Ghosh, S., De, S.K., Sinha, G. and Lahtinen, J. (2012) Enhanced Magnetic and Dielectric Properties of Eu and Co Co-Doped BiFeO3 Nanoparticles. Applied Physics Letters, 101, Article ID: 042401.http://dx.doi.org/10.1063/1.4738992
- Liu, X.H., Xu, Z., Wei, X.Y., Dai, Z.H. and Yao, X. (2010) Ferroelectric, Ferromagnetic, and Magnetoelectric Characteristics of 0.9(0.7BiFeO3-0.3BaTiO3)-0.1CoFe2O4 Ceramic Composite. Journal of the American Ceramic Society, 93, 2975-2977. http://dx.doi.org/10.1111/j.1551-2916.2010.03943.x
- Renlund, G.M., Prochazka, S. and Doremus, R.H. (1991) Silicon Oxycarbide Glasses: Part II. Structure and Properties. Journal of Materials Research, 6, 2723-2734. http://dx.doi.org/10.1557/JMR.1991.2723
- Moulder, J.F., Stickle, W.F., Scbol, P.E. and Bomben, K.D. (1995) Handbook of X-Ray Photoelectron Spectroscopy. Physical Electronic, Inc.
- Hanekamp, L.J., van der Berg, A.H.J., Bouwmeester, H.J.M., Sasse, A.G.B. and Hruidhof, H. (1990) In-Depth Compositional Analysis of Ceramic (Bi2O3)0.75(Er2O3)0.25 by AES and XPS. Microchimica Acta, 101, 189-194.http://dx.doi.org/10.1007/BF01244171
- Lin, D.J., Huang, H.L., Hsu, J.T., Shieh, T.M., Fuh, L.J. and Chen, W.C. (2012) Surface Characterization of Bismuth-Doped Anodized Titaniu. Journal of Medical and Biological Engineering, 33, 538-544. http://dx.doi.org/10.5405/jmbe.1037
- Krumme, J.P., Otterloo, A.F., Zalm, P.C. and Pertruzzello, J. (1988) Surface Segregation and Preferential Sputtering of Bismuth in rf-Magnetron-Sputtered Iron-Garnet Films. Journal of Applied Physics, 54, 3965.http://dx.doi.org/10.1063/1.341354
- Schedel-Niedrig, T., Weiss, W. and Schiogl, R. (1995) Electronic Structure of Ultrathin Ordered Iron Oxide Films Grown onto Pt(111). Physical Review B, 52, Article ID: 17449. http://dx.doi.org/10.1103/PhysRevB.52.17449
- Park, S.J. and Jung, W.Y. (2002) Effect of KOH Activation on the Formation of Oxygen Structure in Activated Carbons Synthesized from Polymeric Precursor. Journal of Colloid and Interface Science, 259, 93-98. http://dx.doi.org/10.1006/jcis.2002.8309
- Yue, Z.R., Jiang, W., Wang, L., Gardner, S.D. and Pittman Jr., C.U. (1999) Surface Characterization of Electrochemically Oxidized Carbon Fibers. Carbon, 37, 1785-1796. http://dx.doi.org/10.1016/S0008-6223(99)00047-0
- Chuang, C.H., Sow, C.H. and Lin, M.T. (2012) Spectro-Microscopic Study of Laser-Modified Carbon Nanotubes. In: Marulanda, J.M., Ed., Electronic Properties of Carbon Nanotube, Chapter 11, Intech, Published Online.
- Barteau, M.A. and Madix, R.J. (1984) A Photoelectron Spectroscopic Investigation of the Interaction between H2O and Oxygen on Ag(110). Surface Science, 140, 108-122. http://dx.doi.org/10.1016/0039-6028(84)90385-6
- Mandal, S., Ghosh, C.K., Sarkar, D., Maiti, U.N. and Chattopadhyay, K.K. (2010) X-Ray Photoelectron Spectroscopic Investigation on the Elemental Chemical Shifts in Multiferroic BiFeO3 and Its Valence Band Structure. Solid State Sciences, 12, 1803-1808. http://dx.doi.org/10.1016/j.solidstatesciences.2010.07.035
- Brundle, C.R., Chuang, T.J. and Wandelt, K. (1977) Core and Valence Level Photoemission Studies of Iron Oxide Surfaces and the Oxidation of Iron. Surface Science, 68, 459-468. http://dx.doi.org/10.1016/0039-6028(77)90239-4
- Gota, S., Moussy, J.B., Henriot, M., Guittet M.J. and Gautier-Soyer, M. (2001) Atomic-Oxygen-Assisted MBE Growth of Fe3O4 (1 1 1) on α-Al2O3(0 0 0 1). Surface Science, 482-485, 809-816. http://dx.doi.org/10.1016/S0039-6028(00)01066-9
- Palewicz, A., Przenioslo, R., Sosnowska, I. and Hewat, A.W. (2007) Atomic Displacements in BiFeO3 as a Function of Temperature: Neutron Diffraction Study. Acta Crystallographica Section B, 63, 537-544. http://dx.doi.org/10.1107/S0108768107023956
- Palewicz, A., Sosnowska, I., Przenioslo, R. and Hewat, A.W. (2010) BiFeO3 Crystal Structure at Low Temperatures. Acta Physica Polonica, 117, 296-301.
- Simon, V., Ponta, O., Simon, S. and Neumann, M. (2008) Atomic Environment Changes Induced by Rare Earths Addition to Heavy Metal Glasses. Journal of Optoelectronics and Advanced Materials, 10, 2325-2327.
- Wang, Y.P., Zhou, L., Zhang, M.F., Chen, X.Y., Liu, J.M. and Liu, Z.G. (2004) Room-Temperature Saturated Ferroelectric Polarization in BiFeO3 Ceramics Synthesized by Rapid Liquid Phase Sintering. Applied Physics Letters, 84, 1731. http://dx.doi.org/10.1063/1.1667612
- Teterin, A.Y., Teterin, Y.A., Maslakov, K.L., Yarzhemskii, V.G., Sverchkov, S.E., Umnikov, A.A., et al. (2008) X-Ray Photoelectron Study of Charge States for Bismuth and Aluminum Atoms in Glasses Luminescent in the Infrared Region. Doklady Physics, 53, 566-570. http://dx.doi.org/10.1134/S1028335808110049
- Sun, S.G., Chen, S.P., Li, N.H., Lu, G.Q., Chen B.Z. and Xu, F.C. (1998) Chemical States of Bismuth and Sulfur Adatoms on the Polycrystalline Pt Electrode Surface towards HCOOH Oxidation—Combined Studies of Cyclic Voltammetry, in Situ FTIRS and XPS on the Origin of Electrocatalytic Activity of Adatoms. Colloids and Surfaces A: Physicochemical and Engineering Aspects, 134, 207-220. http://dx.doi.org/10.1016/S0927-7757(97)00335-X
- Wang, T.H., Tu, C.S., Chen, H.Y., Ding, Y., Lin, T.C., Yao, Y.D., Schmidt, V.H. and Wu, K.T. (2011) Magnetoelectric Coupling and Phase Transition in BiFeO3 and (Bi-FeO3)0.95(BaTiO3)0.05 Ceramics. Journal of Applied Physics, 1089, Article ID: 044101. http://dx.doi.org/10.1063/1.3551578
NOTES

*Corresponding author.