Geomaterials
Vol.1 No.2(2011), Article ID:6491,8 pages DOI:10.4236/gm.2011.12009
Cam-Clay Models Using Castem 2000© and Plaxis© for the Study of the Slope Stability of the “Corniche Ouest” of the Dakar Peninsula (Senegal, West Africa)
1Laboratoire de Mécanique et Modélisation, UFR Sciences de l’Ingénieur, Université de Thiès, Sénégal
2SenLabo Sarl, Dakar, Sénégal
E-mail: Hmeissa.fall@univ-thies.sn
Received April 22, 2011; revised June 13, 2011; accepted June 25, 2011
Keywords: Corniche Ouest, Stability, Numerical Codes, Cam Clay, Movements, Natural Slopes
Abstract
The stability of the natural slopes of the “Corniche Ouest” of Dakar Capital was intensively researched by previous [1] in [2] and recent studies [3]. Soils near the surface consist of weathered lateritic cuirass, silt and marl that have been intensively altered and fractured. Below these altered layers are limestones that are interbedded with other thin volcanic layers. Prior to the 1950s the area had been less urbanized. In the 1950s demand for habitations and administrative offices led to the development of the area but, no drainage system was available. In 1984 the area began moving down slope toward the ocean. Rates of movement were the fastest several months after the end of the rainy season and the slowest during the dry season. In the next years the earthflow moved as much as some meters, but in the processes the expensive homes and administrative buildings built became uninhabitable. Movement was caused by a combination of wave erosion along the coast removing some the mass resisting flow, added water due to the disposal of wastes, watering of lawns, and rainfall causing the clays to expand and weaken, and by the added weight of development on top of the flow. The first investigations, due to a lack of geotechnical information describe a stable area even though it was observed cracks and failure in habitations. The main results obtained were specially obtained by analytical techniques of slices. It is well known that the mechanical response of a solid mass of soil depends primarily on the laws of behavior which were affected to him. The Cam-Clay model is used with two comparative numerical codes such as Castem 2000©, a non commercial code and Plaxis 7.2© so as to compare the mechanical response of the slopes. The models of Cambridge are founded as simple theory and use only some soil mechanical parameters easy to determine. The results are founded highly different from a code to another, but they attest all that the system described is non stable. Otherwise, this study has shown that Castem 2000© gives no realistic outputs as well as the soil behavior laws varies from a simple MohrCoulomb law to the softening or hardening complex laws.
1. Introduction
The stability of Dakar in general and that of the Corniche ouest in particular is a recurring problem which required several studies in regards to the importance of this site in the development of Dakar; capital city of Senegal [1] in [2] and [3]. With regards to geography, the Cape Verde peninsula is located in the edge of Atlantic Ocean and between meridian lines 1700′ and 1735′ W and parallels 1430′ and 1500′ (Figure 1).
The climate here is a Sudan-sahelian climate type, characterized by one dry season (between November and June, with an average temperature ranging from 20 to 25˚C) and a wet season (between July and October, with an average temperature ranging from 30 and 35˚C).
Climate plays a significant role in the stability of the slopes since the majority of the disorders occurring in regards to the slopes, is in relation to the hydrogeological data, in particular the infiltration, which by the medium of an underground flow, refills the groundwater. The

Figure 1. Location of the studied area [4].
western side of the “Bernard’s Crick” is the area of study. It is located in the East of Cape Verde peninsula between the “fishermen beach” and “Point Bernard” (Figure 1). Geologically speaking, we notice that the formations constituting Cape Verde peninsula include a tertiary sedimentary unit, volcanic rocks and a lateritic cuirass which have been installed during the tertiary and quaternary areas. In our sector, only the Formations of Madeleines’s Island and the Formations of the “Hospital” are met at the outcrop on the coast. The formation met in Madeleines’s Island is of Paleocene age while the unmatched formation of the hospital on that of the Madeleines, is dated between the Paleocene superior and the early lower Eocene [5,6]. However, recent works of [2] allot them a Paleocene age ranging between inferior to medium. Also, it is noticeable that as for the hydrogeological system, fracturation has much influence on stability. The fracturation system is evidenced in the Cape Verde peninsula by great faults delimiting horsts and graben which development started at the end of the Cretaceous or Paleocene periods (horst of Dias and Dakar, graben of Rufisque).
2. Topics
The study of the stability of the slopes is of paramount importance in the field of regional planning in particular for the realization of civil engineering works. Thus various studies were conducted ending to analytical calculation methods such as Fellenius vertical trenches method (1936) improved by Bishop in 1955 and the friction circle method. These methods are based on the assumption that the rock mass in rupture can be divided into sections or polygons. Their difference lies on the form of the rupture surface and the assumptions concerning the interactions between the various sections. The mechanical response of a solid mass of ground depends primarily on the laws of behavior which were affected to him. It is thus very significant to choose the rheological model which will be able to reproduce with an optimal fidelity the response of the solid mass in regards to the strains imposed to him according to the relevant scale. The models of Cambridge are based on a simple theory and use only some current mechanical parameters of soil easy to determine. The behavior of a solid mass of ground, according to these models, can be compared, with enough accuracy, to that of an elastoplastic material whose stress-strains fundamental relations, as well as the equation of limit condition surface are well defined. Castem 2000© is a structured analytical code software based on finite element method and more generally a solution of partial derivative equations by the finite element method. It has been elaborated upon by the CEA (Commissariat à l’Energie Atomique, France). The main feature of this software is to be extremely adaptable to the multiple applications specific to each user, but especially to be available for education and research purposes. Otherwise, Plaxis© is a commercial tool which is one of the best known geotechnical modeling software.
3. A Summary of the Cam Clay and the Modified Cam Clay Models
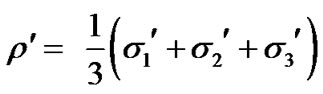
The first critical state models for describing the behavior of soft soils such as clay, the Cam-Clay (CC) and Modified Cam-Clay (MCC) were built to models the important aspects of soil behavior (the strength, the volume change and the critical states of soils) [7]. The primary assumptions of the CC and MCC models are described next. In critical state mechanics, the state of a soil sample is characterized by three parameters, the effective mean stress (p’), the deviatoric (shear stress, q’ and q) and the Specific volume (v).
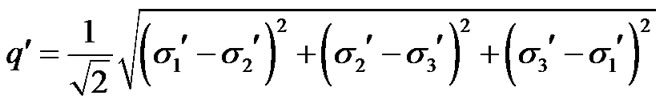
Under general stress conditions, the mean stress p’ is calculated in terms of principal stresses as
while triaxial shear stress is defined as
The models assume that when a soft soil sample is slowly compressed under isotropic stress conditions, and under perfectly drained conditions, the relationship between specific volume, n and lnp’ consists of a straight virgin consolidation line (also known as the normal compression line) and a set of straight swelling lines. Swelling lines are also called unloading-reloading lines. The virgin consolidation line is defined by the equation n = N-lnp’, while the equation for a swelling line has the form n = ns-lnp’. The values, and N are characteristic properties of a particular soil. is the slope of the normal compression (virgin consolidation) line or the critical state line in the n-lnp’ space, while is the slope of swelling line in the n-lnp’ space. N is known as the specific volume of normal compression line.
The parameter G is the specific volume of the CSL. There is a relationship between the parameter N of the normal compression line and G. For the Cam-Clay model the two parameters are related by the equation  while for the Modified Cam-Clay model the relationship is
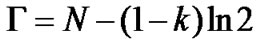 .
.
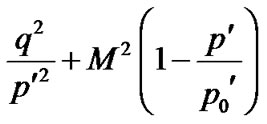
Under increasing triaxial shear loading q, the Cam Clay and the Modified Cam Clay soils behave elastically until a yield value of q is attained. The yield values are determined from the following equations:
- For Cam-Clay,
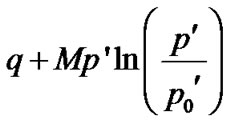
- For Modified Cam-Clay,
In geotechnical engineering, the elastic material constants commonly used to relate stresses to strains are Young’s modulus, E, shear modulus, G, Poisson’s ratio, µ, and bulk modulus, K. Only two of these parameters must be specified in an analysis. For Cam-Clay and Modified Cam-Clay soils, the bulk modulus is not a constant. It depends on mean stress, p’, specific volume, v, and the swelling line slope, and is calculated at a point in a soil as.

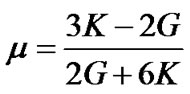
Cam-Clay and Modified Cam-Clay formulations require specification of shear modulus G or Poisson’s ratio µ, but not both. When G is supplied then m is no longer a constant, but is calculated from the formula
When m is specified then G is determined using the relationship
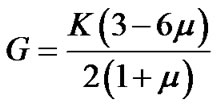
If Young’s modulus and Poisson’s ratio for a material are known, then shear modulus G can be determined from the equation

The current state of a soil can be described by its stress state (mean effective stress, p’), specific volume, v, and yield stress, p’0 (also known as preconsolidation pressure is a measure of the highest stress the soil has ever experienced). The ratio of preconsolidation pressure to current mean effective stress is known as the over consolidation ratio (OCR), i.e.

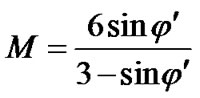
The slope M of the CSL in q-p’ space can be calculated from the friction angle j (measured in triaxial compression test) of the Mohr-Coulomb yield criterion as
The slopes and of the normal compression and swelling lines in n-lnp’ space are related to the compression index, Cc, and swelling index, Cs, measured in odometer tests through the equations

and
Often is chosen to be in the range of  to
to .
.
4. Characteristics of the soils
The formations can be divided in three principal layers which are:
• the crust or lateritic cuirass· the “silts of the Hospital” area subdivided in two sub-layers, a first sub-layer below of the groundwater table and a second entirely immerged;
• marls also distributed in two levels which geotechnical characteristics are different.
4.1 Lateritic Crust
The cuirass constitutes the summit coating of the cliff and is showed in the form of a lateritic crust. The values of the parameters found are presented in the table hereafter (Table 1).
4.2 Characteristics of Subjacent Layers
By subjacent layers, we mean the layers other than the lateritic layer that is the silts and the marls. The model

Table 1. Values of the parameters for the lateritic crust. [Castem 2000© use singular converted units such as Pa and kg/m3].
applied for these layers is the Cam-clay plastic elastic mechanical model, which requires determining the soil parameters.
Silts
The silts are the basic constituents of the Hospital formations; they are highly made of silica (60 to 80% according to [4] and have a very significant thickness (the most widespread formations in the area). Their consistency varies from top to bottom and thus two levels were distinguished with geotechnical characteristics more or less different. The first level is called surface silt and the second level, which is tenderer, is called depth silt (Table 2).
Let us note that, at the difference of surface silts, depths silts are entirely located in the groundwater whose static level was supposed as corresponding with the roof of the depths silts.
4.3 Marls
They constitute the formation of the Madeleine’s islands and outcrop only in certain places of Dakar coast (“Plage des enfants”, “Plage des pêcheurs”). They show heterogeneity materialized by an increase of the argillaceous fraction upwards. Like the silts, they were subdivided in two levels: a superficial level (roof marls) and a deeper level (depth marls). The following table gives the values of the parameters used in modeling for these marls levels (Table 3).
The following Table 4 gives the preconsolidation pressure values of the various formations following a variation of the OCR.
5. Modelisation
The modeling of Dakar Corniche stability was carried out using the education and research version for Castem 2000© [8-10] and thereafter using Plaxis© for a comparison of the results. To simplify the study, a certain num
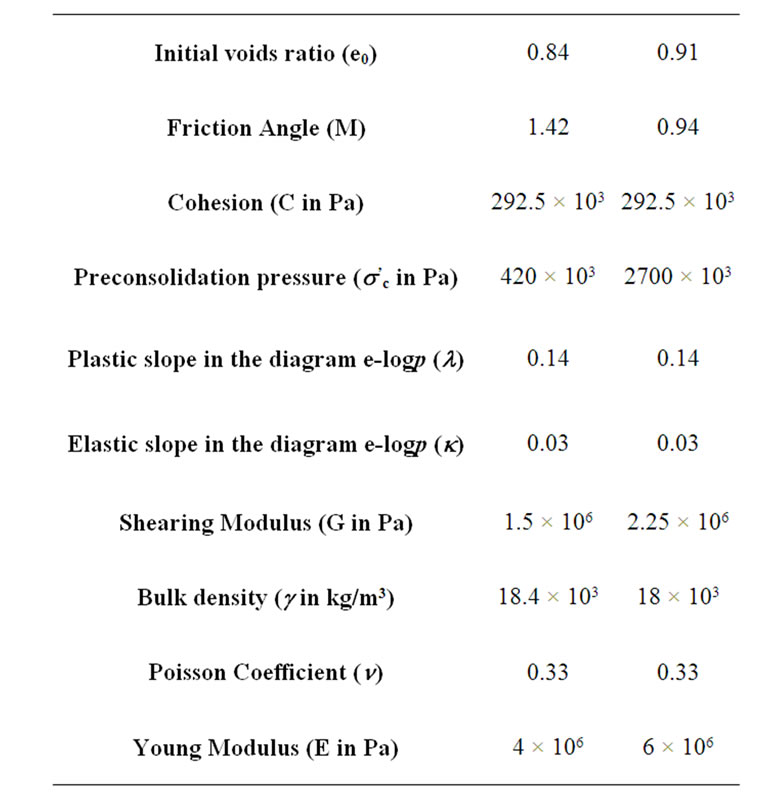
Table 2. Cam-clay model for silts parameters Values (OCR = 1). [Castem 2000© use singular converted units such as Pa and kg/m3].
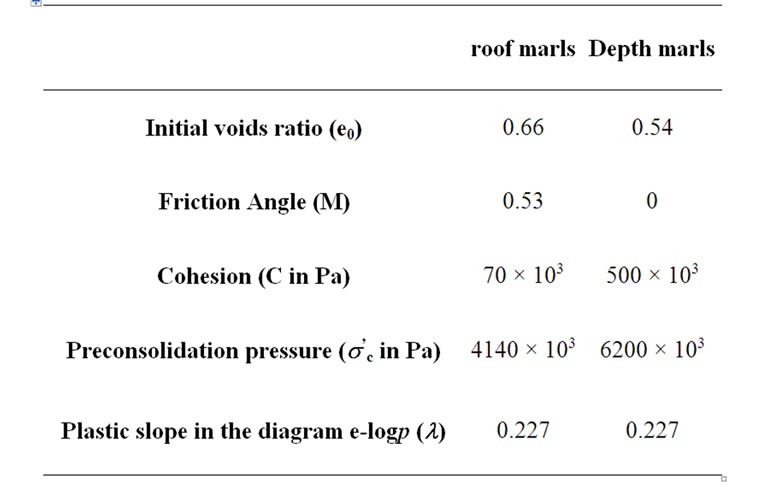
Table 3. Cam-clay model for marls Parameters values (OCR = 1). [Castem 2000© use singular converted units such as Pa and kg/m3].
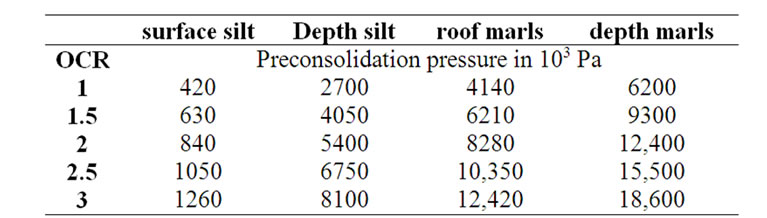
Table 4. Pre consolidation pressure for different OCR values.
ber of assumptions were made:
·
Initially the study is made while blocking only the base of the structure, in other words by blocking the base of the depth marls· Then the stability is studied by blocking only the side opposed to the slope;·
Finally the last limit condition consisted in simultaneously blocking the two previous sides i.e. the base and the side opposed to the slope.Regarding the loading conditions, we considered as loading force the own weight of the various layers which constitute the solid mass. Following these various assumptions, we worked out programs (for these three limit conditions cases) in gibiane language with parameters enabling to plot the structures before and after deformation and especially to extract the constraints and displacements field along different axis.
Figure 2 shows the geometry of the grid structure. The constituents of the elementary grid are those specified in OPTI function, i.e. of the triangular elements with three nodes (TRI3).
6. Presentation of Results
The execution of the programs gives the results. We will give here the different results step by step while trying to explain the role of certain language options in order to facilitate comprehension. If the result of the gridding is the same for the three cases studied, the deformed structures vary significantly from one case to another. These deformed structures are the result of the elaboration of mass matrixes (MASi) and rigidity matrix (RIGi) and after solution of the system made by these two matrixes. The mass matrix is built owing to the MASS operator, with precising the model and characteristics of the material. The strength of own weight which constitutes the load is calculated by multiplying the mass by the acceleration. Thus, it is manually created an acceleration field owing to the MANU CHPO operator, while precising the support grid, the number and name of the components and also the acceleration value. Figures 3, 4 and 5 respectively show the deformations for the three limit cases considered.
6.1 Deformation and Stress Fields
According to the different problems, it is necessary to calculate the deformation or stresse fields. For this purpose, SIGMA and EPSI operators are used, which respectively calculate the stress and deformations tensors on the basis of the displacement field resulting from the loading. For these operators, the syntax that is used requires the model and material and geometrical chara-
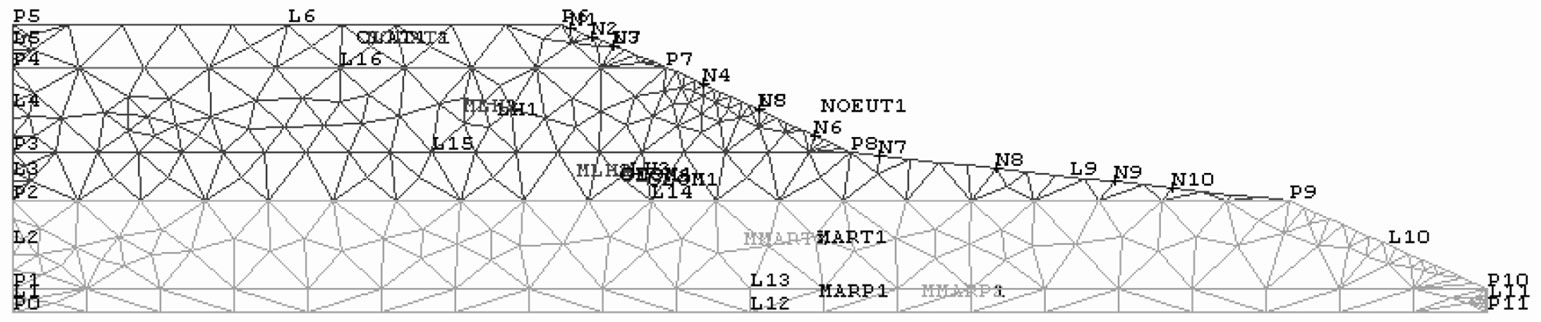
Figure 2. The system’s mesh with Castem 2000©.
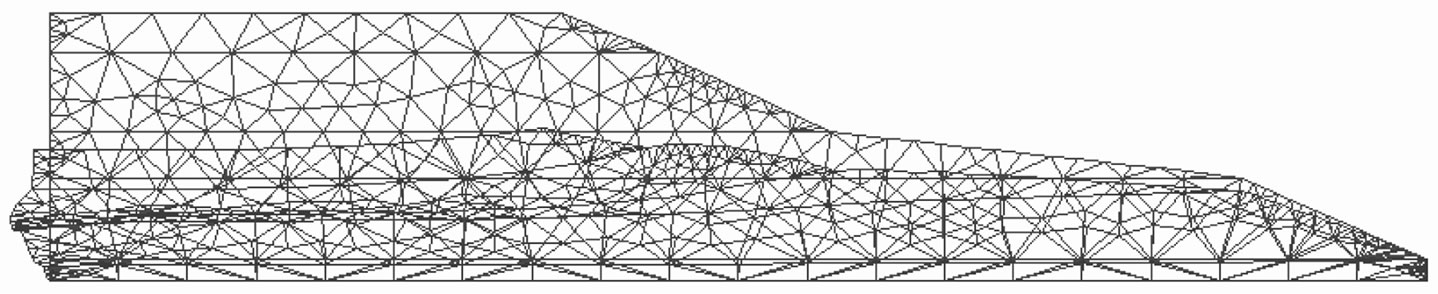
Figure 3. Case 1, Deformation with blocking of the base.

Figure 4. Case 2, Deformation with blocking of the side opposite to the slope.
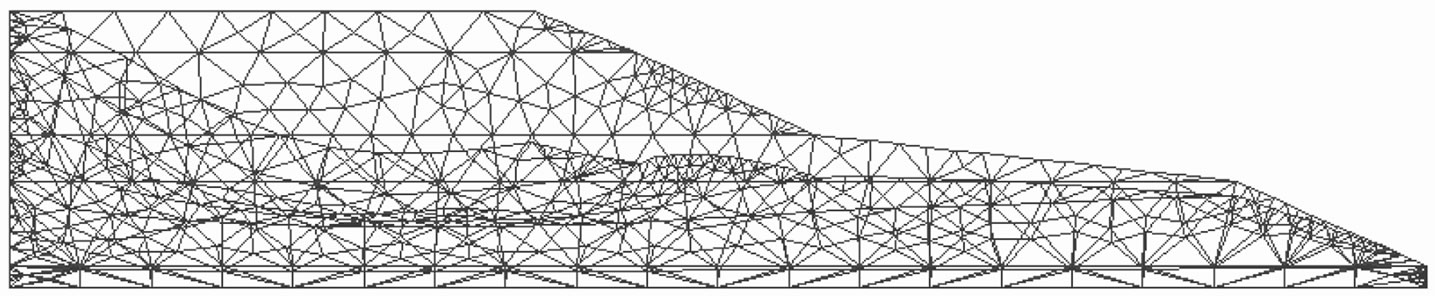
Figure 5. Case 3, Deformation with simultaneous blocking of the two sides.
cteristics data to be supply. For each limit conditions case considered, the isovalues of the stress and deformations are traced along the two axes and this enables to draw the graphics. From the graphics of the stress fields and deformations (of the isovalues) one can draw the maximum stress and deformations values. These values are given in the following table in which case 1, 2 and 3 correspond respectively to blocking of the base, of the side opposed to the slope and of the two sides simultaneously.
6.2 Analyses and Interpretations
The drawing of the deformed structures in the three cases (with Castem 2000©) enables to question the previous conceptions with regards to the stability of the solid mass. These figures show clearly that in any cases, the solid mass is prone to vertical and horizontal movements.

Figure 6. Deformation with Plaxis©.
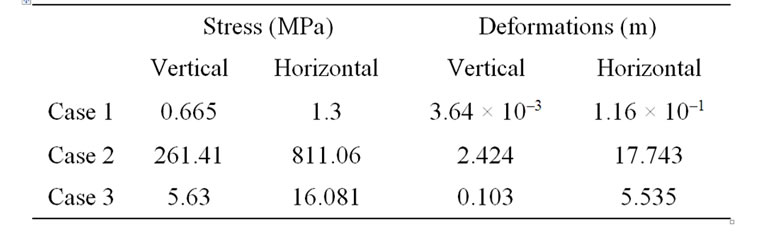
Table 5. Maximum stress and deformations values (from Castem 2000©).
isovalues graphic chart enables to determine the maximum allowable stress values as well as the final deformations. Negative stress values can be related to two phenomena. On one hand this can be due to the orientation of the axes (the y-axis is directed to the top while loading forces are directed in contrary direction) and on the other hand the areas with negative constraints may correspond to areas in traction. In the same way and according to the orientation of the axes, the negative deformations areas can correspond to compression areas and those with negative deformations to swelling areas. The analysis of different types of deformations allows saying that the condition of blocking the side opposed to the slope seems to be the most probable situation knowing that it shows clearly and without any ambiguity a slip of the solid mass along the slope. In the three studied cases (Table 5
), the stability of the solid mass is disturbed if it is subjected to conditions of vertical constraints exceeding respectively 6.65 × 10⁻³, 261.41 and 5.63 MPa. In other words, under these conditions of blockings, the solid mass could not stand loadings involving vertical constraints higher than these respective values. Otherwise, the use of Castem 2000© seems to be more difficult and needs a lot of time to analyze the systems than Plaxis©. These two results had been compare to analytical calculations and the results had shown than Plaxis© is more realistic than Castem 2000© (Figures 6) for this kind of analysis we expected to do and for the future the imple mentation of the Cam clay or modified Cam clay models in Castem 2000© must be more improved by users.7. Conclusions
The study of the results of simulation by Castem 2000© and Plaxis© shows that the solid mass submitted to the action of its own weight are the object of considerable deformations which vary according to the considered limit (boundary) conditions. The studies undertaken within the framework of this article consisted in simulating the behavior of Dakar East Cornice, using Castem 2000© and Plaxis© software’s while backing up on the results of the former studies for the choice of the input parameters values. The former studies (by the analytical methods) carried out on the site gave values of very high safety coefficient of about a 1.66 (representing the lowest Bishop safety coefficient value found in this sector) [11]. These studies enabled to affirm that regarding geotechnical results, the solid mass is stable. Contrary to these studies, the simulation carried out enabled us to visualize and appreciate the total rheological response of the solid mass and to draw the conclusion relating to the instability of the grounds.
8. Acknowledgements
The authors hold to thank the University of WisconsinMadison (Civil and Environmental Engineering) throughout the professors Craig H. Benson, late Peter Bosscher and Tuncer B. Edil for allowing us using Plaxis 7.2© and also to gave us the opportunities to check some others input parameters (mechanical and physical data) needed for this article.
9. References
[1] F. Tessier, “Contributions à la stratigraphie et à la paléontologie de la partie quest du Sénégal (Crétacé et Teritaite,” Dakar, Grande Impr.Africaine, Vol. 265, 1952, p. 63.
[2] R. Sarr, R. Khatib, P. Saint-Marc and Y. Bellion, “Nouvelles données stratigraphiques et sédimentologiques sur les formation des Madeleines et de l’Hopital de Dakar,” 8th I.A.S. Regional Meeting of Sedimentology, Sénégal, 1-3 April 1987.
[3] M. Fall, “Etude de la stabilité du versant naturel des Madeleines,” Mémoire IST, No. 41, 1993.
[4] Chatelet et K’Vadec, “Carte géotechnique de Dakar au 1/25000,” Carte n° 1 carte de documentation, Esquisse géologique et géotechnique, 1975.
[5] S. Bongnard and P. Elouard, “Nature pétrographique des formations de l’hôpital de Dakar,” Ann. Fac. Sc., No. 22, 1968.
[6] P. Elouard, “Excursion géologique à Dakar,” Notes africaines (Dakar), 1965.
[7] K. H. Roscoe, A. Schofield and A. Thurairajah, “Yielding of Clays in States Wetter than Critical,” Géotechnique, Vol. XIII, No. 3, 1963, pp. 211-240.
[8] CEA/DMT/LAMS, “CASTEM 2000 Recueil d’exemples commentés,” Edition Universitaire, 1992.
[9] E. Le Fichoux, “Présentation et utilisation de CASTEM 2000,” ENSTA-LME, avril 1998, Edition Universitaires, 1998.
[10] P. Mestat, P. Humbert and A. Dubouchet, “Recommandation pour la vérification de modèle d’élément fini en géotechnique,” Bulletin des Laboratoires des Ponts et Chaussées, 2000.
[11] S. Gladima, “Etude de la stabilité de la corniche Est de Dakar,” Mémoire IST, No. 0012, 1988.