American Journal of Operations Research
Vol. 2 No. 4 (2012) , Article ID: 25146 , 7 pages DOI:10.4236/ajor.2012.24059
Dominance-Based Rough Set Approach in Selection of Portfolio of Sustainable Development Projects
University of Quebec in Abitibi-Temiscamingue, Rouyn-Noranda, Canada
Email: kazimierz.zaras@uqat.ca, jean-charles.marin@uqat.ca, boudreab@uqat.ca
Received August 7, 2012; revised September 10, 2012; accepted September 21, 2012
Keywords: Rough Set Theory; Dominance-Based Rough Set Approach; Selection of Portfolio Projects; Multi-Criteria Analysis; Sustainable Development
ABSTRACT
In our study, the Dominance-based Rough Set Approach (DRSA) has been proposed to assist the Board of Directors of the Community Futures Development Corporations (CFDC), the sub-region of Abitibi-West (Quebec). The CFDC needs a tool for decision support to select the projects that are proposed by the contractors and partners of its territory. In decision making, a balanced set of 22 indicators is considered. These indicators derive from five perspectives: economic, social, demographic, health and wellness. The DRSA proposal is suitable for the data processing with multiple indicators providing on many examples to infer decision rules related to the preference model. In this paper we show that decision rules developed with the use of rough set theory allow us to simplify the process of selecting a portfolio for sustainable development by reducing a number of redundant indicators and identifying the critical values of selected indicators.
1. Introduction
There are several models available for portfolio managers to help select projects, prioritize and weight alternatives. The Balanced scorecard, developed by Kaplan and Norton in 1992 is now applicable in non-profit organization project management [1], the public sector [2] and municipalities [3]. When a balanced set of indicators are produced and managed over time, municipalities must use the information in order to manage the selection of projects. Rough set theory developed by [4-6] is regarded as a mathematical tool for imperfect data analysis and may be applied in engineering, banking, medicine [7]. We propose the use of Rough set theory modified by [8] and called Dominance-based Rough Set Approach (DRSA) in portfolio management, more specifically in the management of a portfolio of projects for a group of municipalities.
The DRSA based on the dominance of rough sets has been proposed to help decision-making for the Board of the Society for Futures Development Corporations (CFDC) of the MRC (Municipality Regional County) of AbitibiWest in the province of Quebec. The MRC Abitibi-West consists of 29 municipalities counting 43,000 inhabitants spread over an area of 10,240 square kilometers. The objective of this study was to provide assistance in the selection of sustainable development projects in the MRC of Abitibi-West. It is important to specify that for CFDC, the definition of sustainable development is related to projects that create long term employment. The CFDC annually reviews about 1250 investment projects of various kinds which may take the form of loans to small businesses, support job creation in the long term financial assistance in order to acquire, start, modernize or develop new businesses [9]. The maximum awarded per project is usually $150,000. In the process of project selection, the Abitibi-West CFDC uses a balanced scorecard which consists of a set of 22 indicators from five perspectives which are: economic, social, demographic, health and wellness. For each perspective, we have a number of indicators whose definitions are in Table 1.
In this paper, we started with formulation of the problem in Section 2. After, in Section 3, we explain how the DRSA is applied to determine strategy objectives for municipalities. Finally, in Section 4, a global analysis of the selection of portfolio of sustainable development projects is presented.
2. Formulation of the Problem
Using indicators of the balanced scorecard of the AbitibiWest CFDC is not obvious to the board since there are 22 indicators to be monitored for each of the 29 municipalities. These indicators are monitored by expert groups
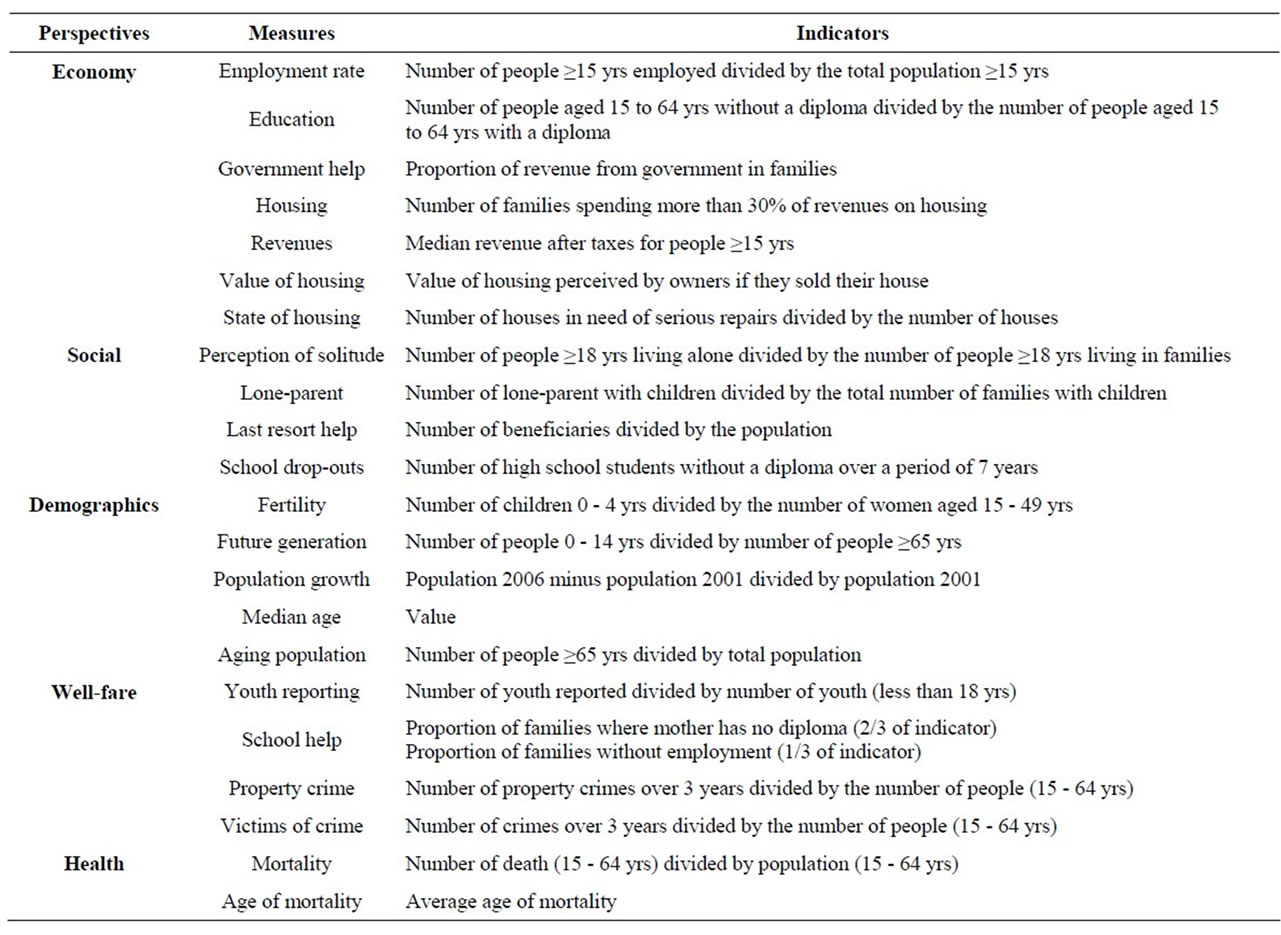
Table 1. CFDC Scorecard (summary).
responsible for regional development. In the first step, the experts must follow the evaluation process indicators and after they must monitor the progress indicators. The evaluation of each municipality in relation to each indicator of each dimension can be defined as a problem of multi-criteria analysis that belongs to a class of problems AXE where:
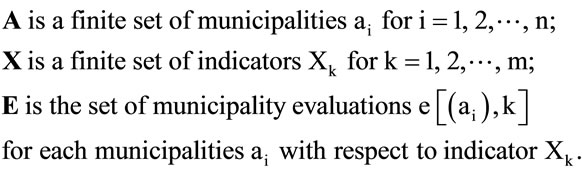 (1)
(1)
Our multi-criteria sorting problem consists of building global preferences on the set of municipalities where the performance of each municipality is evaluated with respect to each indicator.
Municipalities are assigned to one of four categories: (A)—those are the best in the region in terms of the perspective considered, (B)—those who need support to pass in the class A, (C)—those requiring assistance to be classified in category B, and (D)—those are the worst in the region and require special assistance in terms of the perspective considered. Assessments can be made directly by the experts or with the help of a well-known multicriteria method. For example, the weighted average rank method where municipalities are ranked first from the best to the worse according to each indicator for each dimension. Then, for each municipality, we calculate the weighted average rank to obtain the rank of each of the twenty-nine municipalities, using the model of weighted average ranks, we calculated:
 (2)
(2)
where: wk is the weight of the indicator k; rkj is the rank of municipality j on indicator k.
The classification of municipalities on the weighted average rank (from best to least desired) allows us to identify four categories of municipalities as shown in the example of the economic dimension of Table 2 (the name of the municipalities are coded from 1 to 29 for confidentiality reasons). The final ranking of municipalities must be validated by experts and accepted by managers.
We must do the same ranking for the other four dimensions. After completing this evaluation process, we
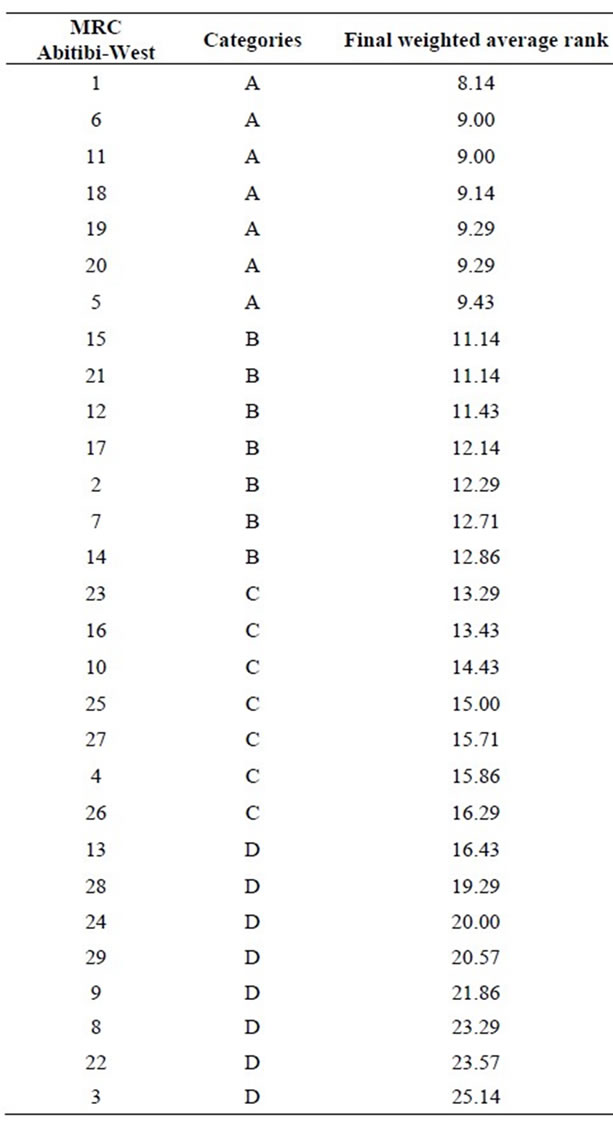
Table 2. Final ranking of the municipalities and sorting categories for economy perspective.
can proceed to the second step whose objective is the development of organizational strategy. In this step, we suggest the application of a tool for decision making called Dominance-based Rough Set Approach (DRSA) [8]. This proposal is appropriate for data processing with multiple indicators, from many examples, for deducing rules of decision on preference model. The rules developed using the Theory of Rough Sets allow us to simplify the process of selecting a portfolio of sustainable development projects by reducing a number of redundant indicators and determining the critical values of indicators measuring the development community.
In the third step, the knowledge from decision rules will be used by managers to select projects for sustainable development priorities. Funding for these priority projects will improve the performance indicators of the municipality.
3. Dominance-Based Rough Set Approach Applied to Determine Strategy Objectives for Municipalities
3.1. Description
Rough Set Theory was originally proposed by [4] before being further developed by [8,10] and others. The proposal of [8] ensures that the principle of dominance is respected and it’s called Dominance-based Rough Set Approach (DRSA). This approach consists of looking for reduced set of criteria that ensures the same quality of classification of objects as the original set of criteria. In rough set theory, the decision problem is represented by a table whose rows represent the objects while the columns represent the attributes (see Table 3 below). In our approach, note that the objects are the municipalities (we consider 29 municipalities) and we use two types of attributes: conditional and decision. Each municipality is classified according to one of four categories with respect to the decisional criterion D obtained in Table 1 {A, B, C or D}.
The conditional attributes are those of our multi-criteria problem AXE. Assessments against each conditional attribute are provided directly from a database of the dashboard of the CFDC. Table 4 shows the evaluation table of the 29 municipalities from 7 conditional criteria (indicators specific to the economic perspective in the Table 1) and the only decision criterion. We obtained the same kind of evaluation tables of the 29 municipalities with respect to the social perspective (4 conditional criteria), demographic perspective (5 conditional criteria), well-fare perspective (4 conditional criteria), health perspective (2 conditional criteria) and the only one decision criterion for each of them.
3.2. Decision Rules
To illustrate which kind of decision rules can be induced in the DRSA, let me consider an example of the problem selection of candidates to the best category of municipalities by the experts. The candidates are assigned to two disjunctive classes: accepted (A) or rejected (R). The performance of each candidate is described by four attributes: education, government help, state of housings and revenues, each taking one of three possible values on the qualitative scale: {3,4,5} with respect to two first attributes and {2,3,4} with respect to the two second attributes. The qualitative scales are ordered that grater values are better.

Table 3. Decision table.
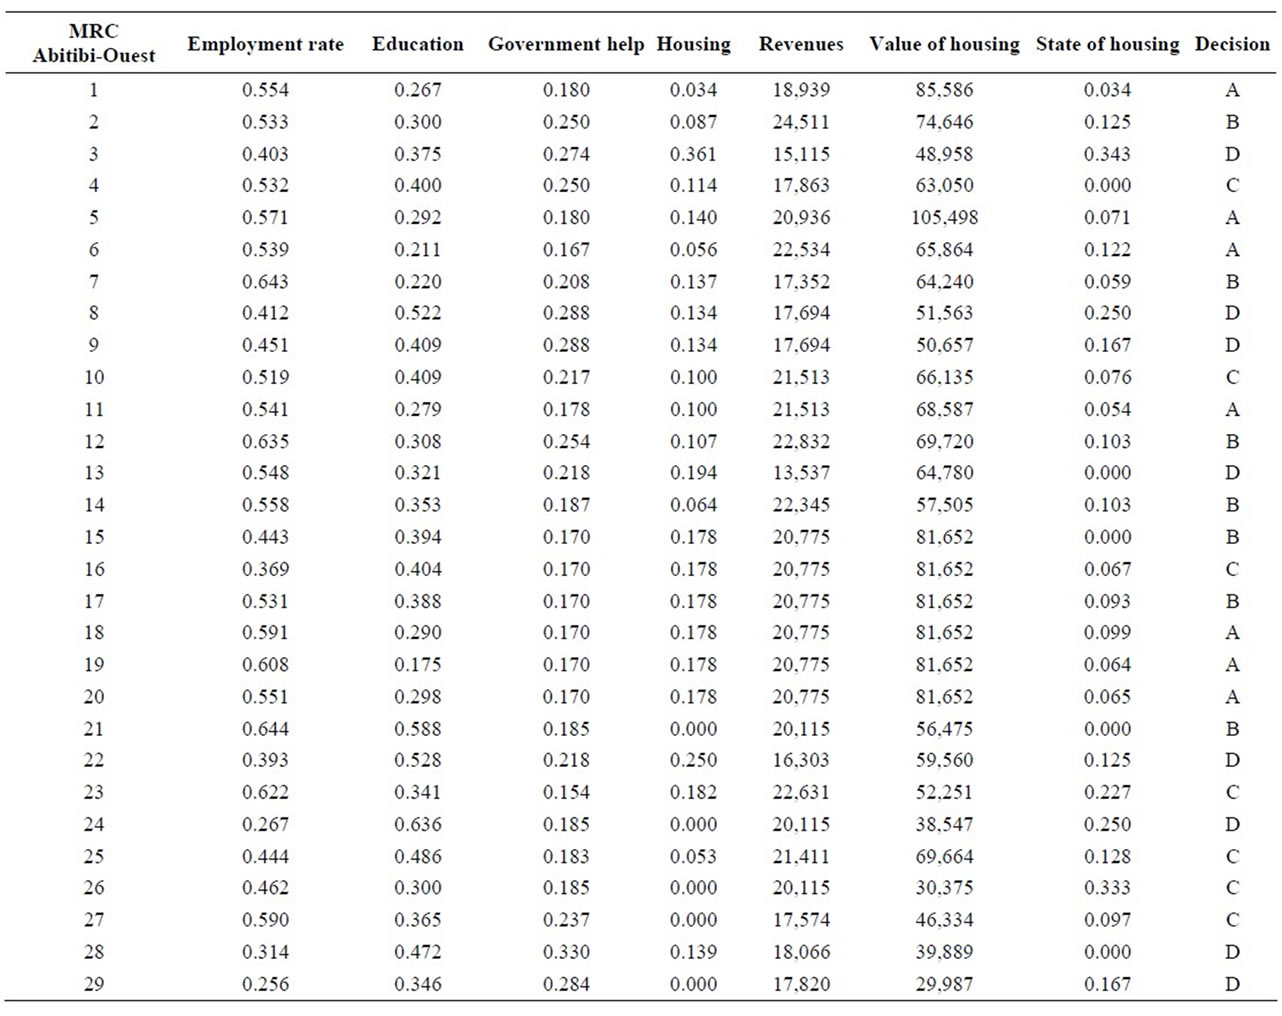
Table 4. The decision table for economy perspective.
The classical rough set approach allows us to obtain a partition of indiscernible classes of objects in the decision table. The candidates are indiscernible if their performance is described by the same conjunction of the values with respect to the conditional attributes (X). The inconsistency of the first kind is identified by the classical rough set approach if two indiscernible candidates correspond to two different disjunctive decision classes (A) and (R).
In example (Table 5), it is the case of {a3, a4}. The classical rough set approach doesn’t allow us to identify the second kind of inconsistency where a principle of dominance is not respected. In the same example, it is the case of the relation between candidate a4 which dominates and a6 which is dominated and the first one is rejected while the second one is accepted. This is why the extension of the classical rough set approach was suggested by [8].
Using the DRSA in the same example we have obtained four following rules (see [11]):
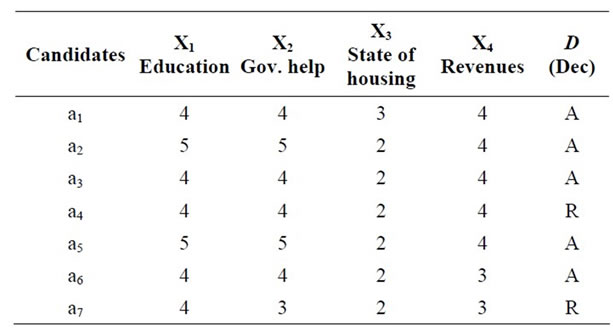
Table 5. The decision table in the example adopted from [11].
Rule 1: If X1 ≥ 4 ˄ X3 = 3 then D = A
Rule 2: If X1 = 5 then D = A
Rule 3: If X2 = 3 then D = R
Rule 4: If X1 = 4 ˄ X2 = 4 ˄ X3 = 2 then X = A ˅ D = R.
Forth rule cover three examples from the decision table where a decision of the experts was contradictory. This is uncertainty rule and this kind of rules is ignored in our proposal. We consider only certain rules which represent certain preferences of experts.
The reduced subset of the criteria, which give the same candidate classification as original set is composed of {X1, X2, X3}. The calculations were done with computer package jMAF developed by Laboratory of Intelligent Decision Support System (IDSS) in the Institute of Computing Science, Poznan University of Technology.
Economy Perspective
Now, coming back to analyze the decision table of economy perspective from Table 4 we identified with the jMAF ten reduced subsets of attributes (reducts) which gives us equivalent classification of alternatives (municipalities) to the original set of attributes from the Table 4. The 10 reducts for the economy perspective which could be give the same classification of municipality as original set of seven attributes are as follows:
1) Employment Rate, Education, Revenues and Value of housing;
2) Education, Revenues and State of housing;
3) Employment Rate, Education, Revenues and Housing;
4) Employment Rate, Government help, Revenues and Value of housing;
5) Employment Rate, Government help, Revenues and State of housing;
6) Employment Rate, Government help, Revenues and Housing;
7) Education, Housing and Value of housing;
8) Education, Government help, Housing and State of housing;
9) Employment Rate, Education, Government help and Housing;
10) Employment Rate, Housing and Value of housing.
These reducts shows the potential possibility of limitation our analysis to three or four necessary independent attributes.
The jMAF identified 17 rules for seven original conditional attributes and for four categories of decisional attribute which are presented in the Table 6.
The first two decision rules determine the strategic objectives of the economic dimension to all municipalities that have been classified in categories B, C or D.
From Rule 1, we can conclude that if in the municipality, the average value of housing is at least $85,586 while the municipality is in class A. This rule holds for municipalities 1 and 5 (see Table 4).
Rule 1: (Value of housing ≥ 85586.0) ≤ (Dec at least A) [2, 28.57%] {1, 5}.
From Rule 2, we can conclude that, if in the municipality, the education rate (which is defined by the ratio of people without qualifications compared to those with a degree between 15 and 64) is not greater than 0.298 and that the average revenues is at least $20,775, and then the municipality is in class A.
This rule holds for municipalities 6, 11, 18, 19 and 20 (see Table 4).
Rule 2: (Education ≤ 0.298) & (Revenues ≥ 20775.0) ≥ (Dec at least A) [5, 71.43%] {6, 11, 18, 19, 20}.
Comparison of these rules, which conclude the classification of category A with other rules such as “at least”, explains us the transition from a lower category to a higher category.
Rule 3: (Education ≤ 0.298) ≥ (Dec at least B) [8, 57.14%].
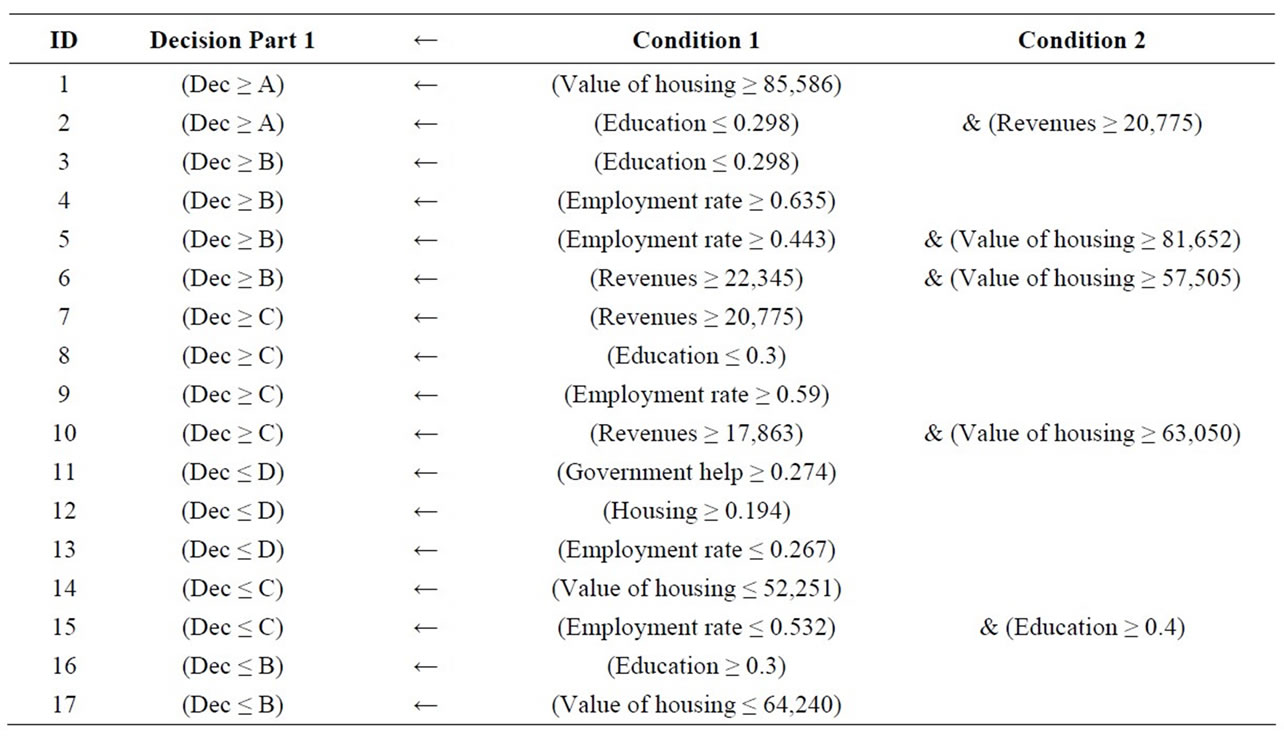
Table 6. The decision rules for economy perspective.
For example, the rule 3 which is verified by 8 municipalities compared to rule 2 allows us to conclude that if municipality verifies the rule 3 and not the rule 2 is classified to the category B. This is the case of the municipality 7 (see Table 7). If the municipality wants to be classified in category A, it should increase the value of the indicator revenues for it to be at least $20,775.
The rules from 11 to 17 give us the conditions that the decisional attribute should be “at most equal to this category”. From rule 11 to 13 we obtain the conditions which allow us to classify the municipality to the category “D”.
From rules 14 and 17 we can conclude that if the average value of housing in the municipality is between $52,251 and $62,240 then this municipality is in the category “B” from economic prospective point of view.
4. A global Analysis of the Selection of a Portfolio of Sustainable Development Projects
To illustrate the overall analysis of project selection based on the five perspectives, we selected two groups of municipalities. In the first group, we have municipalities that have at least three rankings in the category “A” on the five perspectives (bold letters “A” in the Table 8). Take the example 5 and 6 municipalities. The priority of these municipalities should be the health dimension (more precisely the improvement in mortality) (see Table 8). In this case, projects that contribute to the health network, as well as projects whose objective is to improve the fitness of individuals or eating habits should be a priority in the allocation of funding. Another example of this group, the municipality is 23. The municipality must prioritize two dimensions: the economy and demographics (see Table 8). In this sense, projects to create new businesses that would attract people looking for employment are a priority.
In the second group, we have municipalities that are most in need of assistance on a global scale. We can distinguish two dimensions for which the need of assistance is particularly important: economic and social (dominated by the bold category “D” in the Table 8). Thus, projects that would generate new jobs and/or stimulate the bustling family life should be the priority. For example: organizing soccer tournaments, family activities at

Table 7. Examples of municipalities supporting rule 3.
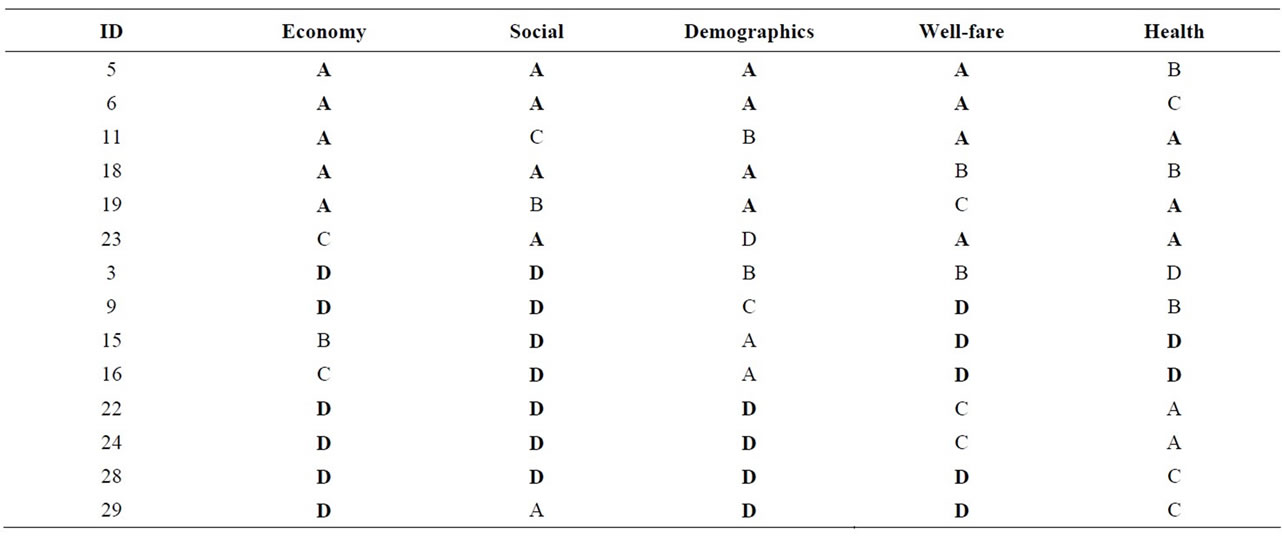
Table 8. Selecting a portfolio of sustainable development projects.
the pool or beach or projects to reduce school dropout.
Rule 1-Health: (Mortality ≤ 2.34) → (Dec ≥ A);
Rule 3-Health: (Mortality ≤ 2.73) → (Dec ≥ B);
Rule 5-Health: (Mortality ≤ 3.1) → (Dec ≥ C).
From rule 1, we can conclude that if mortality index in the municipality is at least equal to 2.34 then this municipality can be classified with respect to health perspective to the category “A”. This is the case of municipalities 11, 19, 23, 22 and 24.
From rule 2, we can conclude that if mortality index in the municipality is at least equal to 2.73 and at most equal to 2.34 then this municipality can be classified with respect to health perspective to the category “B”. This is the case of municipalities 5, 18 and 9.
5. Conclusions
This study demonstrates that the use of Rough Set Theory is useful and helps decision making for programme managers in the municipal sector. This process was done in three steps:
First, using the database of the dashboard of CFDC, we classified municipalities into four categories: A, B, C or D. This classification was performed for each of five perspectives (economic, social, demographic, health and well-being) with the help of a multi-criteria method and the active participation of experts and managers. Finally, we obtain the decision table which represents a preference model accepted by managers.
The objective of the second step was to understand the final classification of municipalities in terms of indicator values and critical values of these indicators. Why the municipality was classified into one category or another? We demonstrated in this study that the DRSA approach is very suitable for answering this question. By treatment data from several indicators (examples drawn from municipal assessment) we can induce decision rules from the decision table that represent the model of managers' preferences.
In the third step, quantitative information can be used by managers to select projects for sustainable development priorities. Funding for these priority projects will improve the performance indicators of the municipality in question. It also allows them to better quantify and monitor their strategic objectives.
Rough Set Theory provides an advantage to programme managers since it clearly helps to select what projects to prioritize and more precisely to understand the impact of the project on the global organisation.
REFERENCES
- R. S. Kaplan, “Strategic Performance Measurement and Management in Non-profit Organizations,” Non-Profit Management and Leadership, Vol. 11, No. 3, 2001, pp. 353-370.
- R. S. Kaplan and D. Norton, “The Balanced Scorecard: Translating Strategy into Action,” Harvard Business School Publishing, Boston, 1996.
- Y.-C. L. Chan, “Performance Measurement and Adoption of Balanced Scorecards: A Survey of Municipal Governments in the USA and Canada,” International Journal of Public Sector Management, Vol. 17, No. 3, 2004, pp. 204-221. doi:10.1108/09513550410530144
- Z. Pawlak, “Rough Set,” International Journal of Parallel Programming, Vol. 11, No. 5, 1982, pp. 341-356.
- Z. Pawlak, “Rough Sets: Theoretical Aspects of Reasoning About Data,” Kluwer Academic Publishing, Dordrecht, 1991.
- Z. Pawlak and R. Slowinski, “Rough Set Approach to Multi-attribute Decision Analysis,” European Journal Operational Research, Vol. 72, No. 3, 1994, pp. 443-459. doi:10.1016/0377-2217(94)90415-4
- Z. Pawlak, “Rough Set Theory and Its Applications,” Journal of Telecommunications and Information Technology, Vol. 3, 2002, pp. 7-10.
- S. Greco, B. Matarazzo and R. Slowinski, “Rough Sets Theory for Multi-Criteria Decision Analysis,” European Journal of Operational Research, Vol. 129, No. 1, 2001, pp. 1-47. doi:10.1016/S0377-2217(00)00167-3
- SADC, “Annual Report 2010-2011,” 2012. http://www.sadcao.com/images/rapports-annuels/rapport-annuel-2011-2012.pdf
- K. Zaras, “Rough Approximation of a Preference Relation by a Multi-Attribute Dominance for Deterministic, Stochastic and Fuzzy Decision Problems,” European Journal of Operational Research, Vol. 159, No. 1, 2004, pp. 196-206. doi:10.1016/S0377-2217(03)00391-6
- R. Slowinski, “Multi-Criteria Intelligent Decision Support Systems—Inteligentne Systemy Wielokryterialnego Wspomagania Decyzji,” Rapport RB-004/97, Institute of Computing Science, Poznan, 1997.