New Journal of Glass and Ceramics
Vol.3 No.1(2013), Article ID:27345,9 pages DOI:10.4236/njgc.2013.31006
3D Modelling of Thermal Replication for Designing Progressive Glass Moulds
![]()
1Pole de Recherches et d’Enseignement Supérieur, Université Lille Nord de France, Lille, France; 2University of Valenciennes and Hainaut-Cambrésis, Valenciennes, France; 3ESSILOR International, SaintMaur-des Fosses, Paris, France.
Email: dominique.lochegnies@univ-valenciennes.fr
Received July 20th, 2012; revised August 20th, 2012; accepted August 30th, 2012
Keywords: Aspherical Lens; Finite Element Model; Precision Glass Forming; Thermal Replication; Metrology
ABSTRACT
Worldwide, ESSILOR International provides customers with Progressive Addition Lenses (PAL), which replace bifocal lenses. Thermal replication is one process to produce glass moulds for PAL, using sagged glass on a ceramic slumping block. In this paper, thermal replication for producing PAL glass moulds is developed through 3D modelling and experimentation. Our numerical approach is validated by comparing it with experimentation on the global 3D topology of the sagged glass. It is also validated by using more severe optical comparison criteria, developed by ESSILOR International to analyze the conformity of their products. Through modelling, the thermal replication is analyzed by studying the evolving contact between the sagged glass and the ceramic slumping block during the thermal cycle and the glass flow on the upper side of the sagged glass.
1. Introduction
Different techniques have been developed for high-precision lens moulding [1,2]. Thermal replication is one of them and is mainly used to produce progressive glass moulds, which are later used to manufacture plastic aspherical optical lenses. By heating an initial prepolished glass preform on a ceramic slumping block, the glass progressively sags through gravity. After cooling, the objective is to obtain the progressive surface on the upper side of the sagged glass by replicating the ceramic slumping block surface, in order to use the glass as a mould for the next plastic lens production. In optical lenses, high tolerances are required on the final product; at present, less than the micron range is used. Since thermal replication combines the expansion of glass and ceramic, the glass flows, which makes the upper surface of the ceramic slumping block difficult to design. Corections have to be made by a trial-and-error process, and numerical modelling can prove effective for designing the optimum surface of the ceramic slumping block.
Modeling and experimentation have been developed for high-precision molding for optical and solar industries, considering glass [3,4] or other materials as polymers [5,6]. For thermal replication of glass, the state of the art in the last ten years is limited to papers published by Dr. Y. M. Stokes, Senior Lecturer in Applied Mathematics in the University of Adelaide (Australia). She is the first and only one to have developed numerical modelling dedicated to thermal replication. In the following paragraphs, we have provided a short summary of Stokes’ research [4-10]. Her modeling is based on an axisymmetric approach and a comparison of numerical results with the results of experimental trials.
During thermal replication, Stokes assumed that the molten glass behaves as an incompressible Newtonian flow. The density of glass, which little varies with temperature, was presumed to be constant, and the Vogel-Fulcher-Tammann (VFT) law [7] was used to approximate the glass’s viscosity temperature dependency. Stokes neglected surface tension and did not consider glass dilatation. Only the glass was modelled by six-node triangles, and the boundary of the ceramic slumping block cavity was modelled by rigid straight lines. The ceramic slumping block’s boundary was used to prevent glass penetration. No slip was assumed at the glass/ceramic interface. Relaxation effects were neglected because, with low velocities in glass during slumping, Stokes stated that relaxation didn’t affect the glass flow.
In the framework of axisymmetric modelling, Stokes used the finite element method and Euler integration to solve the creeping flow equations. The real furnace temperature curve was truncated and was introduced as input data for the model: the curve was limited to the heating stage, where the temperature passes over 600˚C (i.e., when slumping will occur) and reaches 700˚C, when the contact is completed between the glass and the ceramic, as found by experimentation. For both the isothermal and non-isothermal modelling, the time scale was considered as a constant. The temperature and the glass viscosity were updated at each time step of the simulation. Stokes’ simulation of the thermal replication ended when the contact between the glass and the ceramic slumping block was total, assuming that there is no glass flow after total contact. Glass cooling was not considered.
Stokes modeled and experimented with thermal replication cases that involved flat glass disks sagged on spherical ceramic slumping blocks, except in reference [8] in which the glass disk geometry had a small initial spherical curvature. The sagging distance between the glass and the ceramic slumping block varied from 2.0 mm to 4.5 mm, with an initial contact between the glass and the ceramic slumping block on the edges at the beginning of the process [4-10]. After slumping, which took 40 - 50 minutes, the sagged glass components were measured by a profilometer at two diameters: 0˚ and 90˚. Stokes noticed one difficulty [7,8]: determining the curvature of the sagged glass (with second derivatives) using discrete measuring points or positions of the deformed finite element mesh. She proposed using 5thorder B-splines series to permit firstand second-order derivatives.
The results for this experiment highlighted that the profiles for the 0˚ and 90˚ diameters are not symmetrical. Stokes explained these results using the experimental results and measurement procedures. In this way, a mean profile along the radius is determined by taking the four radius profiles into account. Second, there are differences between the experiment and the models, which are out of the tolerance range of ±1 μm imposed in the optical industry. The maximum difference is limited to 8 μm in the centre of the glass (for |r/R| < 0.6, where r is the position along the radius, and R is the radius of the sagged glass). On the edges (|r/R| > 0.6), Stokes suggests a possible explanation, which holds that the higher differences are due to the use of a grid that was too unrefined when measuring the sagged glass with the profilometer, thus resulting in an incorrect estimation of rapid curvature change in the edge region.
By comparing the modelling results for cases of nonuniform temperature distribution along the glass radius with experimentation [7], Stokes showed that the spatially isothermal temperature assumption best corresponds with the experiments. Stokes thought that the data collection and processing methods should be improved to see if a better correspondence could be obtained, before concluding that non-isothermal simulation was necessary. Stokes’ more recent research involves the inverse modelling technique for glass forming through gravity sagging [10]. Using the previous axisymmetric finite element models, Stokes developed iterative techniques to find the optimum shape of the ceramic slumping block.
This paper is about numerical modelling of thermal replication, so we can also note the research of Dr. A. Yi, Associate Professor in the Ohio State University, about high-precision glass compression for optical components [11-13]. The research of Dr. Yi developed a laboratory apparatus for high-precision glass compression from an experimental perspective [11]. This apparatus is used to measure glass properties and to mould aspherical glass lenses. Yi gave one example of a lens to produce: 25.0 mm outer diameter, 18.6 mm diameter for the clear aperture on the aspherical side, and ≈5.0 mm thickness.
In parallel with his experiments, Yi has developed finite element model of the high-precision glass compression process. In his first numerical approach [12], axisymmetric finite element models were developed with the commercial Finite Element code DEFORM-2D®. His main assumptions were: 1) the glass is modelled as a Newtonian viscoplastic material with a VFT model during the forming stage; 2) during the annealing stage, the glass is modelled as a elasto-viscoplatic material, and 3) the heat exchanges between glass, air and moulds are considered using constant thermal properties, independent of the temperature, using values from the literature. Sticking conditions were considered at glass/mould contact interface.
Yi proposed a second finite element model using the commercial FE code MSC MARC®, and stress relaxation effects during the forming and annealing stages were introduced in the axisymmetric modelling with a generalized Maxwell model [13]. Yi et al. [11] highlight better accuracy on predicting the moulding loads. The experimental and numerical geometries of the glass lenses at the end of the forming and annealing stages are compared using the glass profiles and not the curvatures [12,13]. Yi and Jain [13] noted that the deflection of the lens is quite constant and less than 1.00 μm for a distance of 4.0 mm from the centre of the lens. Moving further away, the deflection is gradually increased until it is more than 16.00 μm on the lens periphery.
Worldwide, ESSILOR International provides customers with Progressive Addition Lenses (PAL), which replace bifocal lenses. For this type of plastic lens, suitable for both near and far visions, the sagged glass shape is very complex and presents a 3D topology.
In this paper, we present 3D finite element model of the thermal replication of the glass moulds used in ESSILOR International to produce their PAL. First, we compare the numerical and experimental results using the global 3D topology of the sagged glass. Second, we confirm this by using more severe optic comparison criteria developed in ESSILOR International to analyze the conformity of their products. In addition, using the 3D modelling, we analyse the glass flow and the ceramic/glass contact during the thermal replication.
2. Experimental Data and Simulation Data
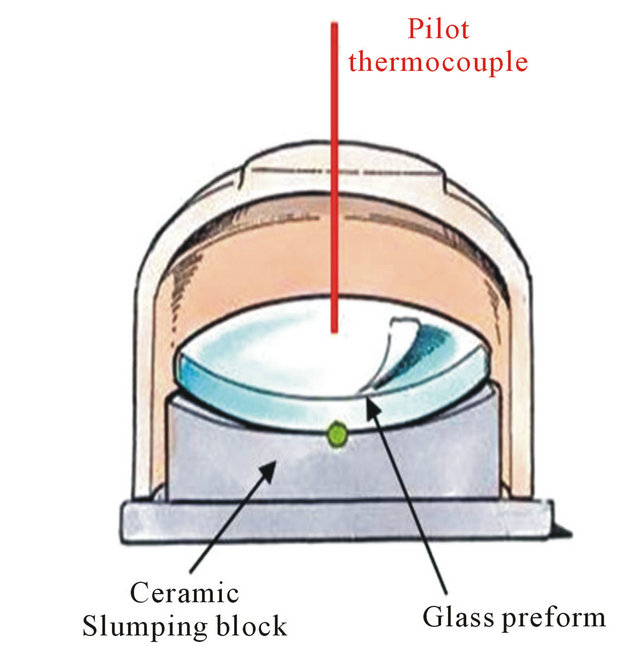
Spherical glass preforms on complex 3D ceramic slumping blocks were thermally replicated in order to produce PAL at the ESSILOR International Research Centre, which has an industrial installation in which the heating and cooling processes are completely monitored [14]. To protect the glass inside the furnace, a ceramic bowl was placed on the upper side of the ceramic slumping block and the glass preform (Figure 1(a)). Various preliminary trials were performed with thermocouples inside and outside of the bowl. From the thermocouple measurements, we concluded that a homogeneous temperature exists inside the bowl. As a result, for all the following thermal replication trials, a single thermocouple, called the pilot thermocouple, was placed inside the bowl.
The temperature curve observed at the pilot thermocouple is composed of three characteristic stages (Figure 1(b)). The first stage corresponds to heating the glass until a temperature greater than the transition temperature Tg has been reached; the second stage corresponds to the stabilization of temperature inside the bowl; the final stage corresponds to cooling the glass until an ambient temperature has been reached.
To evaluate the success of the sagging process, in addition to controlling the geometry of the sagged glass at the end of the replication process, we compared the temperature curves of the pilot thermocouple between the various trials performed with the same 3D ceramic block; this permitted us to verify the repeatability of the thermal replication. For one glass preform geometry to be sagged on a given ceramic block, six trials were completed with the same experimental conditions. The average temperature curve was computed from the six temperature curves at the pilot thermocouple. The various experimental and numerical trials have confirmed that, assuming that both glass and ceramic have a uniform temperature during the thermal replication that is equal to the temperature measured at the pilot thermocouple, the trial was valid.
To perform both the experimentation and modelling in the micron-range precision scale of the optical industry, we conducted preliminary research involving the thermal replication of the axisymmetric geometries of glass preforms and ceramic blocks [14]. In this paper, we present a reference PAL lens from ESSILOR International to illustrate our final goal, which is the 3D experimental trials and 3D modelling for the thermal replication of progressive glass moulds.
Before replication, the six spherical glass preforms were initially measured using 2D metrology on the upper and lower surfaces. For the upper and lower surfaces of each glass preform, measurement points are obtained on
 (a)
(a)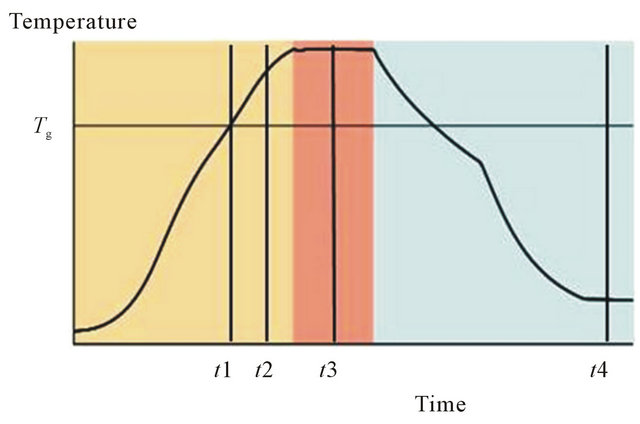 (b)
(b)
Figure 1. (a) The instrumented glass preform/ceramic slumping block/bowl set; (b) The temperature cycle at the pilot thermocouple.
two perpendicular diameters. Then, using this metrology tool, the radii of the best circles passing through the measurement points were determined. The thickness at the centre of the glass preform was also determined. Next, based on the previous data for radii and thickness, the average dimensions (i.e., upper and lower radii, thickness at the centre) were computed for the set of six glass preforms. These dimensions were used to define the axisymmetric geometry of the glass preform used in the finite element model.
The average geometrical data for the glass preform presented in this paper are: the curvature radius of the upper side is equal to 1/98.4 mm−1, the curvature of the lower side is equal to 1/98.5 mm−1, the glass thickness at the centre is equal 5.0 mm, and the diameter is equal to 80.0 mm. The topology of the upper progressive surface of the ceramic slumping block that defines the PAL is a theoretical one deduced from the optical correction produced by the lens. This geometry is directly introduced to mesh the upper surface of the ceramic block, which is defined as a cylinder.
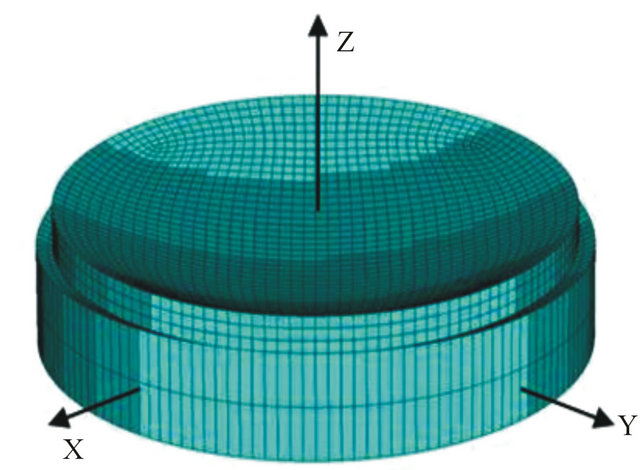
The finite element method was used to model the thermal replication. Figure 2(a) gives the 3D finite element meshes for the reference glass preform and the reference ceramic slumping block. The total mesh is composed of 10,324 8-node linear brick elements (5916 for the glass preform mesh, 4408 for the ceramic slumping block mesh) and 14,989 nodes (8164 for the glass preform mesh, 6825 for the ceramic slumping block mesh). Figure 2(b) gives the initial distance d between the glass preform and the ceramic slumping block.
Due to the complex 3D geometry of the upper surface of the ceramic slumping block, only two contact areas are initially present in the model of the edges at a diameter turned 45˚ from the X-axis (blue zones in Figure 2(b)). This line corresponds to the near vision-far vision line of the PAL reference. A maximal distance d = 1.15 mm was observed at the beginning of thermal replication. If the maximum value seems to be not large enough, this value has to be placed in the micron-range precision scale expected for the 3D finite element model, since optical glass is involved.
 (a)
(a)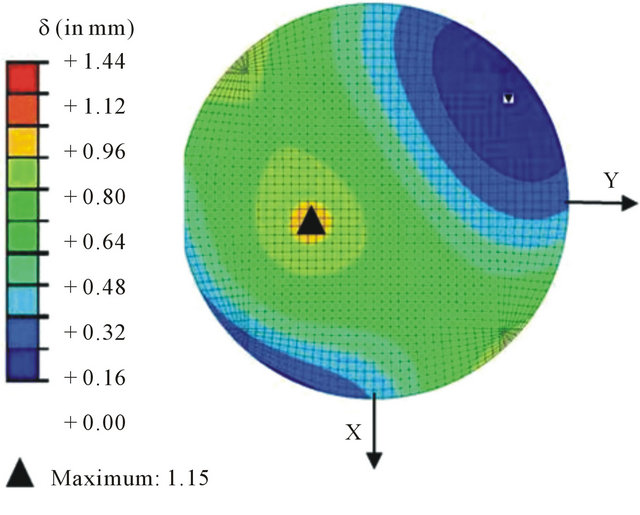 (b)
(b)
Figure 2. 3D Model of the thermal replication of glass moulds used for PAL; (a) 3D finite element model; (b) Initial contact distance δ in mm between the glass perform and the ceramic slumping block.
The evolution of the glass/ceramic contact constitutes one of the important issues in the modelling process in order to obtain a better understanding of the process. As the initial contact of the glass preform and the ceramic slumping block is located on two reduced areas on the edge of the glass preform of one diameter, the convergence in the computations is not very easy. The difficulty at the start of the sagging process is also increased also by equilibrium instabilities. In fact, in reality and in modelling, depositing a spherical geometry (e.g., the glass preform) on a complex aspherical surface (e.g., the upper surface of the ceramic slumping block) is not an easy challenge because the balance is not stable. A very reduced time step is used at the beginning of the computation, and the finite element mesh is adapted to facilitate the contact.
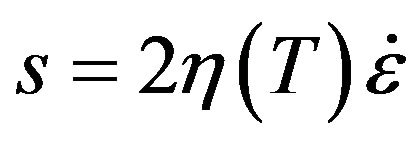
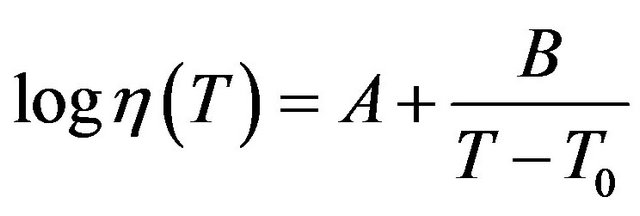
The mechanical problem was incrementally and iteratively solved, using FE code ABAQUS®. With very low strain rate during sagging, we assumed that glass behaves like a Newtonian fluid over transition temperature Tg. We used a logarithmic Vogel-Fulcher-Tammann (VFT) law to describe the dependence of the glass viscosity in regard to the temperature:
 (1)
(1)
 (2)
(2)
where s is the deviatoric part of the Cauchy stress tensor; h is the glass viscosity;  is the strain rate tensor; T is the temperature; and A, B, and T0 are used to describe the glass thermo-dependency according to VTF law.
We also considered the dilatation and elastic deformations of glass and ceramics. All the glass’s mechanical properties (e.g., viscosity, density, expansion coefficient, Young modulus) and the ceramics’ expansion coefficient are temperature-dependent. The Poisson ratio for the glass and ceramics, and the Young modulus and density of the ceramics are not temperature-dependent. All these parameters were measured by expert organizations. According to ESSILOR International confidentiality rules, the values cannot be given.
Mechanical boundary conditions were set on the mesh only to avoid any rotation of the glass and the ceramic slumping block. For this reason, no displacement in Ydirection (respectively X-direction) was imposed on the nodes of the mesh of the ceramic slumping block located on the X-axis (respectively Y-axis). X-axis and Y-axis correspond to two perpendicular diameters at the bottom of the ceramic slumping block. (The origin O of the Cartesian coordinate system for the 3D mesh is located in the centre of the lower surface of the circular ceramics.) On the glass mesh, no displacement was imposed in Y-direction (respectively X-direction) on the nodes of the mesh of the upper surface of the glass preform located on the X-axis (respectively Y-axis).
For the mechanical problem, the gravity of the glass completed the loading definition. Friction conditions were introduced at the glass/ceramic interface with a friction coefficient related to temperature [15]. During the incremental procedure in ABAQUS®, the temperature of the pilot thermocouple, which is imposed on all the mesh nodes, permitted us to adjust the temperature-dependent material properties of the glass and ceramics during the thermal replication.
3. Comparison of the Experimental Results with the Numerical Results
For our reference PAL lens, we performed 3D measurements on the sagged glass after thermal replication. We then performed two types of 3D geometrical analysis of the experimental results and the numerical results: the first analysis is a global one and consists of producing a 3D metrology of the upper surface of the sagged glass in order to obtain a set of measurement points representing the experimental upper surface. These measurement points are defined in a Cartesian coordinate system, with the origin and the axis attached to the 3D equipment. The second geometrical analysis, according to ESSILOR practice, is a local one, with the computations of the spherical and cylindrical powers expressed in Dioptre units. (Details on the computations of dioptric powers are given in Appendix). Typically, ESSILOR defines reference locations on a PAL on the line between the near vision and the far vision. Consequently, the PAL conformity after thermal replication is linked to verifying the spherical and cylindrical powers in these reference locations. In this paper, only the four main reference locations (denoted 1 - 4) are used for the discussion.
To compare the experimental upper surface of the sagged glass with the numerical one, we used an optimization tool developed by ESSILOR International. Due to the mesh discretization and 3D metrology, the measurement points cluster and the modelling points cluster are different because of the spacing between the points. More than effecting X, Y and Z translations, this optimization tool permitted us to minimize the surface of the Z-distance between the experimental points and the numerical ones, in addition to taking care of the three rotations in the space.
During the optimization, the 6 parameters (i.e., X-, Yand Z-translations and X-, Yand Z-rotations) were considered to find the optimum solution. For the reference PAL, Figure 3 shows the 3D representation of the Z-distance difference between the numerical upper surface of the sagged glass and one of the six experimental upper surfaces after optimization. We limited the analysis to a 48.0mm diameter of the sagged glass due to the importance of checking the conformity after thermal rep-
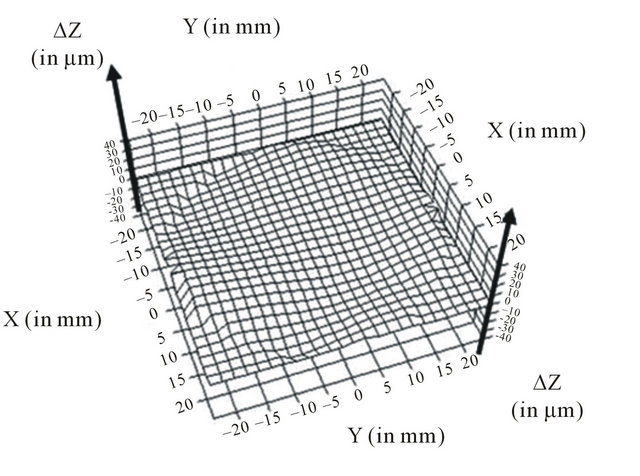
Figure 3. Z-difference in mm between the numerical upper surface of the sagged glass and the experimental one at a 48 mm analysis diameter.
lication in this analysis zone for the next PAL manufacturing process. On the 48.0 mm diameter analysis zone, the average Z-distance between the numerical and experimental upper topologies of the sagged glass is 4.04 mm for such a complex PAL geometry. The maximum Zdistance detected between experimental results and the numerical results reaches 20.42 mm.
The second local analysis computes the dioptric spherical and cylindrical powers (see Appendix) in the four main locations used by ESSILOR International to verify the conformity of the PAL. The spherical and cylindrical dioptric powers are computed in these four locations:
1) Experimental results: the spherical and cylindrical powers in each of the four locations on the line between the near vision and the far vision were computed for the six pieces of sagged glass based on the 3D metrology and the formulas in Appendix. The average value of the spherical Sm and cylindrical Cm powers and their respective standard deviations sS and sC were then computed.
2) Numerical results: the formulas in the Appendix were applied on the numerical topology to estimate the spherical Snum and cylindrical Cnum powers at the four locations of the meshed upper surface of the sagged glass.
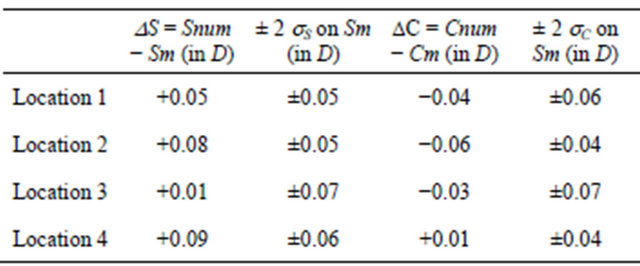
According the ESSILOR International confidentiality rules, no values are given for the spherical and cylindrical powers and for the near vision-far vision line. However, the four main locations are used to compare the experimental results and the numerical results for the reference PAL presented in this paper. Table 1 provides the differences DS = Snum − Sm (resp. DC = Cnum − Cm) in column 2 (resp. column 4) between experimental and numerical powers computed in the four locations. Table 1 also provides ± 2sS (resp. ± 2sC) where sS (resp. sC) represents the standard deviation based on the six trials for the spherical (resp. cylindrical) power in column 3 (resp. 5).
For a normal distribution of the experimental measurements of the spherical and cylindrical powers, we can expect about 95% of the values will fall within two standard deviations. With the Table 1 results, we can observe:
1) in location 1 (resp. 3), with S equal to +0.05 (resp. +0.01D) and C equal to −0.04D (resp. −0.03D) and two standard deviations equal to 0.05D (resp. +0.06D), the numerical values for the spherical power S and the cylindrical power C values fall within two standard deviations as experimental values.
2) in location 4, this is only effective for the cylindrical power Cm with a difference C equal to +0.01D in comparison to two standard deviations equal to +0.04D.
3) in location 2, the numerical results for S and C do not fall within two standard deviations, like in location 4 for Sm.
Five out of the eight numerical/experimental differences (representing 62.5%) of the spherical and cylindrical powers fall within two standard deviations obtained by experimental thermal replication for the reference PAL.
With less than 5.00 mm for the global 3D analysis between the numerical and experimental topologies and five out of the eight numerical results falling within the experimental ranges for the local analysis, the two approaches highlight the ability of the 3D finite element model to reproduce the thermal replication process. This result is confirmed by other examples of thermal replication of glass moulds for PAL in experiments and simulations conducted by ESSILOR International during this research project.
4. Numerical Analysis of the Thermal Replication of Progressive Glass Moulds for PAL
This section concerns the analysis of the thermal replication process, more precisely, the comprehension of the
Table 1. Analysis of spherical and cylindrical dioptric powers at the four main locations along the near vision-far vision line on the upper surface of the sagged glass after thermal replication: the differences between the numerical model and the experiments compared to the experimental standard deviations.
glass sagging process proposed by the numerical model. For this purpose, we consider four particular instants: at Tg during the heating process (designated t1 in Figure 1(b)), before the temperature stabilizes (designated t2 in Figure 1(b)), when the temperature stabilizes (designnated t3 in Figure 1(b)), and after the cooling process (designated t4 in Figure 1(b)).
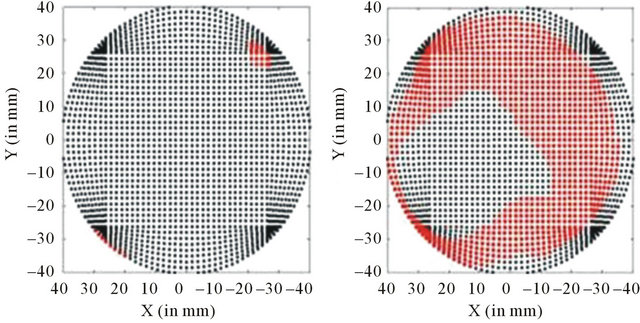
Once again, we limited the analysis to a 48.0 mm diameter of the sagged glass leading to a successful PAL production (Section 3). Figure 4 highlights the evolution of the contact between the lower side of the glass and the upper side of the ceramic slumping block during thermal replication. In Figure 4, red corresponds to an effective contact between the glass and the ceramic slumping block, a distance lower than 1.00 mm between the nodes of the lower side of the glass mesh and the ceramic slumping block mesh. The model permits us to show that, before Tg, with only the effects of glass/ceramic dilatation at this moment (time t1 in Figure 1(b)), the contact area remains still located on the edges along the same diameter as at the beginning of the process (Figure 2(b)). The near vision and far vision areas are located on this diameter.
Next, while the temperature increases, the contact from the near vision-far vision diameter edges towards a
 (a)
(a)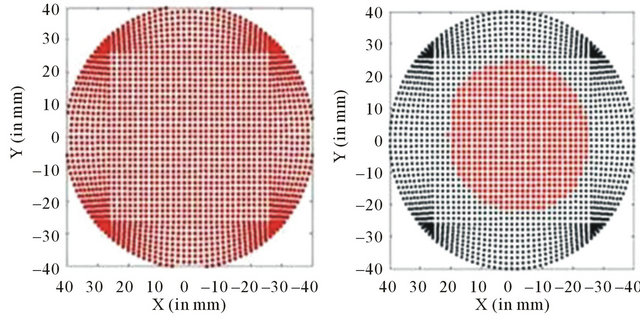 (b)
(b)
Figure 4. Evolution of the glass-ceramic contact area during the thermal replication of glass moulds used for PAL: (a) At Tg during the heating stage (t1 in Figure 1(b)); (b) Before the temperature stabilizes (t2 in Figure 1(b)); (c) When the temperature stabilizes (t3 in Figure 1(b)); (d) After cooling (t4 in Figure 1(b)). Red indicates that the contact is effective due to a distance glass-ceramic lower than 1 mm.
ring around the centre (Figure 4(b)). This numerical result agrees with industrial practice, in which an aspiration process is performed on the bottom of the ceramic slumping block to make the thermal replication more successful. (For the experiments presented in this paper, no aspiration is performed.) The explanation suggested by the numerical results is that the contact between the glass and the ceramic slumping block during the sagging process evolves from two zones on a diameter towards a circular ring. The presence of air is not considered in this simulation, but it could be a problem in real circumstances, which maybe explains why an aspiration process is performed through the ceramic slumping block on industrial lines.
When the temperature stabilizes, there is a total contact (Figure 4(c)). One of the simulation’s goals is to define the optimum temperature stabilization time (i.e., the time needed to achieve total contact between the sagged glass and the ceramic slumping block). In this case, total contact between the glass and the ceramic block was obtained at time t3 (Figure 1(b)), just in the middle of the stabilization period. Thus, we conclude from the simulation that the stabilization time may be reduced by a factor of two. During the cooling process (time t4 in Figure 1(b)), with the effects of the contraction, the contact of the sagged glass with the ceramic slumping block remains in the centre until the end of the cooling period (Figure 4(d)).
At the same temperature levels, the second analysis concerns the glass flow on the upper surface of the sagged glass obtained by the simulation. Figure 5 shows the direction and intensity of the horizontal displacement of the nodes of the glass mesh located on the upper surface, at the same four reference instants (t1, t2, t3 and t4 in Figure 1(b)). Each graph in Figure 5 corresponds to the displacement of the mesh nodes on the upper surface of the sagged glass. The arrows’ length in Figures 5(a)(d) is equal to (Ux*Ux+Uy*Uy)1/2, where Ux,Uy denote the components of the node displacement vector in Xand Y-directions for the simulation. (Uz is not considered in this analysis.) The same scale is used to show the intensity of the horizontal displacement of the upper surface of the sagged glass during thermal replication.
Figure 5(a) clearly shows the effect of glass expansion during the heating stage before Tg with a symmetry in the horizontal displacement map along near vision-far vision diameter. In Figures 5(b) and (c), the sagging effects are visible in this temperature range, in which the glass viscosity acts, in addition to the expansion effects. A certain symmetry along the near vision-far vision line is conserved at this important moment of thermal replication when the surface transfer between the ceramic slumping block surface and the glass occurs. In Figure 5(d), the definitive modification of the initial upper glass
 (a)
(a)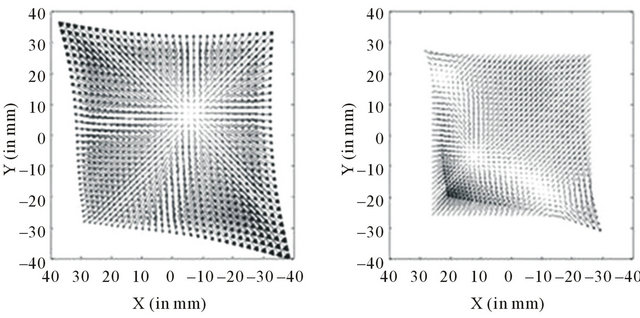 (b)
(b)
Figure 5. Evolution of the glass flow on the upper surface during the thermal replication of glass moulds used for PAL: (a) At Tg during the heating stage (t1 in Figure 1(b)); (b) Before the temperature stabilization (t2 in Figure 1(b)); (c) At temperature stabilization (t3 in Figure 1(b)); (d) After cooling (t4 in Figure 1(b)). The arrows indicate the direction and intensity of the node displacement vector in (X,Y) plane.
surface at the end of the thermal replication process is obtained after the glass has contracted. This second analysis of thermal replication by 3D finite element model highlights that it is possible for ESSILOR International to get a better understanding of the glass sagging and how the transfer of the upper side of the ceramic slumping block on the upper surface of the sagged glass is achieved.
5. Conclusions and Perspectives
In this paper, we used experiments in industrial conditions and 3D modelling to reproduce the thermal replication of complex progressive glass moulds used by ESSILOR International to produce Progressive Addition Lenses. We established the capacity of the numerical approach to reproduce the real thermal replication process:
1) the global geometrical analysis proved an average difference lower than 5.00 mm between the 3D numerical results for the upper surface of the sagged glass and the experimental results.
2) the local geometrical analysis proved that the numerical results predict 62.5% dioptric powers that are close to experimental results.
In addition, using the 3D modelling, we analysed the glass flow and the glass/ceramic contact during thermal replication of such complex glass moulds used for PAL. For current industrial manufacture, the 3D modelling offers new opportunities to access the transfer law between the 3D upper surface of the ceramic slumping block and the 3D upper surface of the sagged glass. In future research, we hope to apply 3D modelling to define the optimum design of thermal replication of new ophthalmic progressive products, thus obtaining a better understanding of the thermal replication process itself.
6. Acknowledgements
This research was supported by International Campus on Safety and Intermodality in Transportation, the Nord/ Pas-de-Calais Region, the European Community, the Regional Delegation for Research and Technology, the Ministry of Higher Education and Research, the National Center for Scientific Research. The authors gratefully acknowledge the support of these institutions.
REFERENCES
- H. M. Pollicove, “Survey of Present Lens Molding Techniques,” Proceedings of SPIE, Los Angeles, 11 January 1988, pp. 158-159.
- L. Smith, R. J. Tillen and J. Winthrop, “New Directions in Aspherics: Glass and Plastic,” Proceedings of SPIE, Los Angeles, 11 January 1988, pp. 160-166.
- M. Sellier, “Optimal Process Design in High-Precision Glass Forming,” International Journal of Forming Processes, Vol. 9, No. 1, 2006, pp. 61-78. doi:10.3166/ijfp.9.61-78
- Y. Chen and A. Y. Yi, “Design and Fabrication of Freeform Glass Concentrating Mirrors Using a High Volume Thermal Slumping Process,” Solar Energy Materials and Solar Cells, Vol. 95, No. 7, 2011, pp. 1654-1664. doi:10.1016/j.solmat.2011.01.024
- D. R. Gunasegaram, I. M. Bidhendi and J. M. McCaffrey, “Modellling of the Casting Process of Plastic Ophthalmic Lenses,” International Journal of Machine Tools and Manufacture, Vol. 40, No. 5, 2000, pp. 623-639. doi:10.1016/S0890-6955(99)00097-8
- T. S. Kwak, T. Suzuki, W. B. Bae, Y. Uhehara and H. Ohmori, “Application of Neural Network and Computer Simulation to Improve Surface Profile of Injection Molding Optic Lens,” Journal of Materials Process Technology, Vol. 170, No. 1-2, 2005, pp. 24-31. doi:10.1016/j.jmatprotec.2005.04.099
- Y. M. Stokes, “Creeping-Flow Computational Modelling of Optical Quality Free-Surfaces Formed by Slumping of Molten Glass,” In: B. J. Noye, M. D. Teubner and A. W. Gill, Eds., Proceedings of Computational Techniques and Applications: CTAC97, World Scientific, Singapore City, 1998, pp. 671-678.
- Y. M. Stokes, “Thermal Replication: A Comparison of Numerical and Experimental Results,” In: E. O. Tuck and J. A. K. Stott, Eds., Proceedings of the 3rd Biennial Engineering Mathematics and Applications Conference: EMAC98, Institution of Engineers, Adelaide, 1998, pp. 471-474.
- Y. M. Stokes, “Numerical Design Tools for Thermal Replication of Optical Surfaces,” Computers & Fluids, Vol. 29, No. 4, 2000, pp. 401-414. doi:10.1016/S0045-7930(99)00030-4
- Y. Agnon and Y. M. Stokes, “An Inverse Modelling Technique for Glass Forming by Gravity Sagging,” European Journal of Mechanics-B/Fluids, Vol. 24, No. 3, 2005, pp. 275-287. doi:10.1016/j.euromechflu.2004.10.002
- G. C. Firestone, A. Jain and A. Y. Yi, “A Precision Laboratory Apparatus for High Temperature Compression Molding of Glass Lenses,” Review of Scientific Instruments, Vol. 76, No. 6, 2005, Article ID: 063101-063108. doi:10.1063/1.1921367
- A. Y. Yi and A. Jain, “Compression Modelling of Aspherical Glass Lenses. A Combined Experimental and Numerical Analysis,” Journal of the American Ceramic Society, Vol. 88, No. 3, 2005, pp. 579-586. doi:10.1111/j.1551-2916.2005.00137.x
- A. Y. Yi and A. Jain, “Numerical Modelling of Viscoelastic Stress Relaxation during Glass Forming Process,” Journal of the American Ceramic Society, Vol. 88, No. 3, 2005, pp. 530-535.
- D. Lochegnies, P. Moreau, F.Hanriot, N. Navarudiger and P. Hugonneaux, “Experimentation and Modelling of Thermal Replication for the Design of 2D1/2 Aspherical Glass Components,” Journal of Glass Science and Technology, Vol. 51, No. 3, 2010, pp. 130-137.
- J. M. Cox and M. G. Gee, “Hot Friction Testing of Ceramics,” Wear, Vol. 203-204, 1997, pp. 404-417. doi:10.1016/S0043-1648(96)07459-5
Appendix
The local analysis of the conformity of the ESSILOR International products is based on local analysis of the curvatures. For this purpose, in a location M of the sagged glass (Figure 6), where control has to proceed, a tangent plane P is defined with the normal axis Z to the tangent plane P in M. Radii R1 and R2 are then defined in the two principal sections to compute curvatures Cu1 and Cu2 in Dioptre (D):
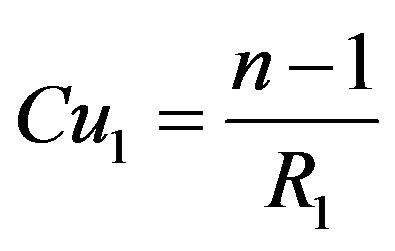 (3)
(3)
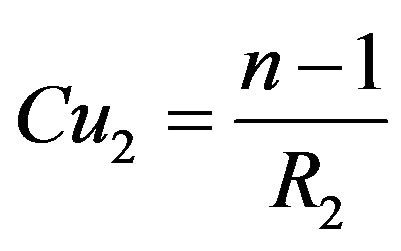 (4)
(4)
where n is the refractive index of the final plastic lens.
the spherical power S in Dioptre D is expressed as:
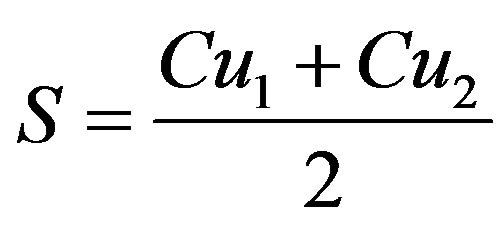 (5)
(5)
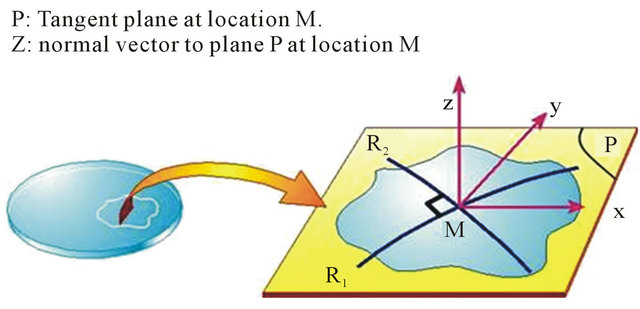
Figure 6. Radii R1 and R2 for calculating the spherical and cylindrical powers at location M on the upper surface of the sagged glass: (a) Sagged glass; (b) Local coordinate system.
and the cylindrical power C in Dioptre D as:
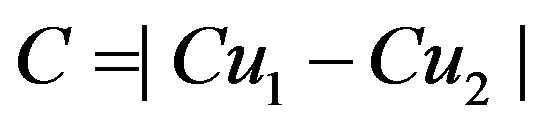 (6)
(6)
where | I | is the absolute value of x.
Nomenclature
r = position along the radius R = radius of the sagged glass d: maximum distance between the glass and the ceramic block at the beginning of the computation Tg: transition temperature of the glass s: deviatoric part of the Cauchy stress tensor h: glass viscosity T: glass temperature A, B, To: parameters of the VFT law
 : strain rate tensor S: spherical power C: cylindrical power Sm: spherical power from experimentation Cm: cylindrical power from experimentation Snum: spherical power from the modeling Cnum: spherical power from the modeling sS: standard deviation on Sm sC: standard deviation on Cm DC = Sm – Snum DS = Cm – Cnum t1,t2,t3,t4: reference times during the thermal replication X,Y,Z: global coordinates system x,y,z: local coordinate system Ux: component of the node displacement vector in X-direction Uy: component of the node displacement vector in Y-direction Uz: component of the node displacement vector in Z-direction P: tangent plane at location M of the sagged glass R1: first radius R2: second radius Cu1: curvature along radius R1
Cu2: curvature along radius R2