Int'l J. of Communications, Network and System Sciences
Vol.1 No.4(2008), Article ID:134,8 pages DOI:10.4236/ijcns.2008.14039
An Active Rule Approach for Network Intrusion Detection with Enhanced C4.5 Algorithm
College of Engineering, Guindy, Anna University, Chennai, India
E-mail: jlprema@cs.annauniv.edu, kannan@annauniv.edu
Received February 28, 2008; revised August 20, 2008; accepted August 29, 2008
Keywords: Decision Tree, Intrusion Detection, KDD Cup Dataset, Enhanced C4.5
Abstract
Intrusion detection systems provide additional defense capacity to a networked information system in addition to the security measures provided by the firewalls. This paper proposes an active rule based enhancement to the C4.5 algorithm for network intrusion detection in order to detect misuse behaviors of internal attackers through effective classification and decision making in computer networks. This enhanced C4.5 algorithm derives a set of classification rules from network audit data and then the generated rules are used to detect network intrusions in a real-time environment. Unlike most existing decision trees based approaches, the spawned rules generated and fired in this work are more effective because the information-theoretic approach minimizes the expected number of tests needed to classify an object and guarantees that a simple (but not necessarily the simplest) tree is found. The main advantage of this proposed algorithm is that the generalization ability of enhanced C4.5 decision trees is better than that of C4.5 decision trees. We have employed data from the third international knowledge discovery and data mining tools competition (KDDcup?9) to train and test the feasibility of this proposed model. By applying the enhanced C4.5 algorithm an average detection rate of 93.28 percent and a false positive rate of 0.7 percent have respectively been obtained in this work.
1.Introduction
To apply data mining techniques in intrusion detection, first, the collected monitoring data needs to be preprocessed and converted to the format suitable for mining processing. Next, the reformatted data will be used to develop a clustering or classification model. The classification model can be rule-based, decision-tree based, and association-rule based. Classification approach can be useful for both misuse detection and anomaly detection, but it is more commonly used for misuse detection.
1.1.Intrusion Detection System
Intrusion Detection Systems (IDS) have been used to monitor network traffic thereby detect if a system is being targeted by a network attacks such as a DoS, Probe, U2R and R2L. The two main intrusion detection techniques are misuse detection and anomaly detection. Misuse detection systems, for example, IDIOT [1] and STAT [2], use patterns of well known attacks or weak spots of the system to match and identify known intrusions. For example, a signature rule for the "guessing password attack"can be "there are more than four failed login attempts within two minutes".
The existing intrusion detection methods [3,4] like misuse detection and anomaly detection are generally incapable of adapting detection systems to the change of circumstances resulting in high false positive rate. The most popular ways to detect intrusions are by using audit trail data generated by operating systems. An audit trail is a record of activities on a system that are logged to file in chronologically order. Manual inspection of these logs is not feasible due to incredibly large sizes of audit data generated. Therefore, data mining is used to automate the wading through audit data [5].
1.2.Classification System
Classification is similar to clustering in that it also partitions customer records into distinct segments called classes. But unlike clustering, classification analysis requires that the end-user/analyst know ahead of time how classes are defined. It is necessary that each record in the dataset used to build the classifier already have a value for the attribute used to define classes. As each record has a value for the attribute used to define the classes, and because the end-user decides on the attribute to use, classification is much less exploratory than clustering. The objective of a classifier is not to explore the data to discover interesting segments, but to decide how new records should be classified. Classification is used to assign examples to pre-defined categories. Machine learning software performs this task by extracting or learning discrimination rules from examples of correctly classified data. Classification models can be built using a wide variety of algorithms. Classification categorizes the data records in a predetermined set of classes used as attribute to label each record; distinguishing elements belonging to the normal or abnormal class. This technique has been popular to detect individual attacks but has to be applied with complementary fine-tuning techniques to reduce its demonstrated high false positives rate. Classifications algorithms can be classified into three types [6] extensions to linear discrimination (e.g., multilayer perceptron, logistic discrimination), decision tree and rule-based methods (e.g., C4.5, AQ, CART), and density estimators (Na"ive ayes, k-nearest neighbor, LVQ).
Decision trees are among the well known machine learning techniques. A decision tree is composed of three basic elements: -A decision node is specifying a test attribute. -An edge or a branch corresponding to the one of the possible attribute values which means one of the test attribute outcomes. A leaf which is also named an answer node contains the class to which the object belongs. In decision trees, two major phases should be ensured: 1) Building the tree. 2) Classification. This process will be repeated until a leaf is encountered. The instance is then being classified in the same class as the one characterizing the reached leaf. Several algorithms have been developed in order to ensure the construction of decision trees and its use for the classification task. The ID3 and C4.5 algorithms developed by [6,7] are probably the most popular ones.
This paper proposes an enhanced C4.5 algorithm towards developing a more-robust Intrusion Detection System through the use of data-mining techniques. Signature-based intrusion-detection systems are normally known as misuse-detection systems. Misuse-detection systems apply a rule-based approach that uses stored signatures of known intrusion instances to detect attacks. The attribute selection measure allowing to choose an attribute that generates partitions where objects are distributed less randomly. In other words, this measure should consider the ability of each attribute to determine training objects?classes. The measure is the gain ratio of Quinlan, based on the Shannon entropy, where for an attribute Ak and a set of objects T. The information gain measure is used to select the test attribute at each node in the tree. Such a measure is referred to as an attribute selection measure or a measure of the goodness of split. The attribute with the highest information gain (or greatest entropy reduction) is chosen as the test attribute for the current node. This attribute minimizes the information needed to classify the samples in the resulting partitions. Such an information-theoretic approach minimizes the expected number of tests needed to classify an object and guarantees that a simple (but not necessarily the simplest) tree is found.
These data mining techniques will dynamically model what a normal network should look like and reduce the false negative alarm rates in the process. We will use classification-tree techniques to accurately predict probable attack sessions.
The subsequent sections are organized as follows. Section 2 presents a general survey in the field of misuse detection in network intrusion detection. Section 3 describes the systems architecture of the new misuse intrusion detection and Enhanced C4.5 algorithm for generating active rules. Section 4 depicts the results and its possible implications. Section 5 gives the conclusions on this work and suggests some possible future works.
2.Literature Survey
This section discusses the related works on IDS and classification for IDS and compares them with the proposed enhanced C4.5 algorithm. There are many works in the literature that deal with classification. [1,3,5,8]. Decision tree [9] is a widely used tool for classification in various domains that need to handle large data sets. One major advantage of the decision tree is its interpretability, i.e., the decision can be represented in terms of a rule set. Each leaf node of the tree represents a class and is interpreted by the path from the root node to the leaf node in terms of a rule such as: "If A1 and A2 and A3, then class C1,"where A1, A2, and A3 are the clauses involving the attributes and C1 is the class label. Thus, each class can be described by a set of rules.
Xiang et al. [8] say that intrusion detection is the process of monitoring the events occurring in a computer system or network and analyzing them for signs of intrusions.
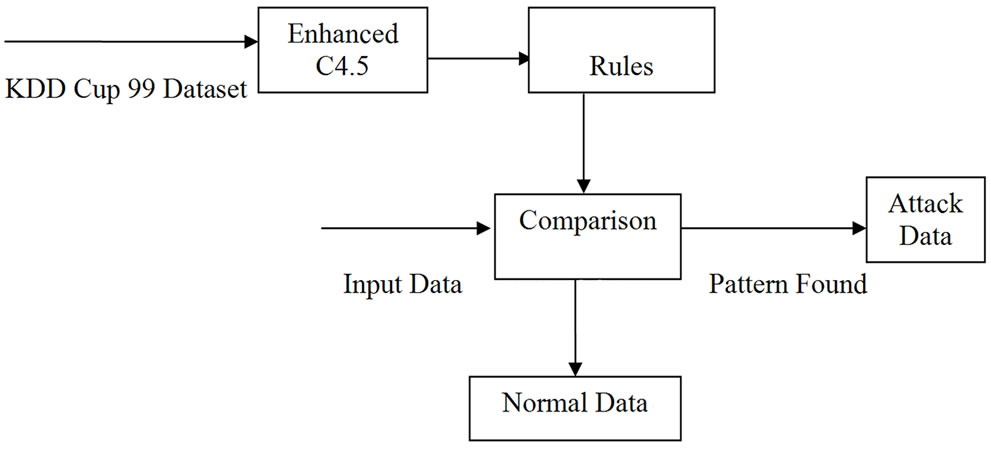
Figure 1. Misuse detection.
For accurate intrusion detection, we must have reliable and complete data about the target system activities. Similarly, routers and firewalls provide event logs for network activity. These logs might contain simple information, such as network connection openings and closings, or a complete record of every packet that appeared on the wire [10].
Decision trees are special classifiers built from instances for which the classification is known, and they are used to classify new cases taken from the same application domain [11]. Each internal node of the tree is associated to an attribute describing a feature of the dataset (domain data), and each outgoing arc is labeled with a possible value (set of values) for that feature. Each leaf node is associated to the attribute we want to predict a value for (the classification attribute), and to a value for that attribute. As stated in [12], learning algorithms based on decision trees generally adopt the divide-and-conquer strategy, i.e. they build the decision tree by recursively dividing the data set of examples into subsets according to some splitting criterion (splitting test). The splitting criterion is very important in the process of building the tree, because it determines if we must attach a node or a leaf as next element in the tree. Some of the well known splitting techniques are information Gain and Information Gain Ratio [13], Gini Criterion and Twoing rule proposed in [14].
Shavlik et al. [15] provide a framework for kdd cup 1999 dataset. The KDD 99 intrusion detection datasets are based on the 1998 DARPA initiative, which provides designers of intrusion detection systems (IDS) with a benchmark on which to evaluate different methodologies. To do so, a simulation is made of a factitious military network consisting of three" target"machines running various operating systems and services. Additional three machines are then used to spoof different IP addresses to generate traffic. Finally, there is a sniffer that records all network traffic using the TCP dump format. The total simulated period is seven weeks.
3.System Architecture
The main task of the intrusion detection system is to discover the intrusion from the network packet data or system audit data as shown in Figure 1. One of the major problems that the IDS might face is that the packet data or system audit data could be overwhelming. Some of the features of audit data may be redundant or contribute little to the detection process. The intrusions are simulated and the detection of the intrusions is done and proper alert message is displayed.
In decision trees, two major phases should be ensured:
1) Building the tree. Based on a given training set, a decision tree is built. It consists of selecting for each decision node the "oppropriate"test attribute and also to define the class labeling each leaf.
2) Classification. In order to classify a new instance, we start by the root of the decision tree, then we test the attribute specified by this node. The result of this test allows moving down the tree branch relative to the attribute value of the given instance. This process will be repeated until a leaf is encountered. The instance is then being classified in the same class as the one characterizing the reached leaf.
Several algorithms have been developed in order to ensure the construction of decision trees and its use for the classification task. Using enhanced C4.5 algorithm we have generated rules. Comparison is take place for the input data. If the pattern is found we can detect the data is an attack, otherwise the data is normal.
4.Mathematical Preliminary
In this section, a brief introduction of the classification algorithms used in the i.e., the Enhanced C4.5 algorithm for building decision trees algorithm, will be given.
4.1.Enhanced C4.5 Algorithm
In a number of applications like pattern recognition, we need to classify data items into discrete set of applicable categories. A classifier, which is a function (or model) that assigns a class label to each data item described by a set of attributes, is often needed in these classification tasks.
There are quite a few machine learning approaches for generating classification models, among which decision tree learning is a typical one. As an example, C4.5 in [6] builds a decision tree where each internal node denotes a test on an attribute, each branch represents an outcome of the test, and leaf nodes represent classes or class distributions. The top-most node in a tree is the root node. The tree is a model generated by the classification algorithm. In order to classify an unknown sample, the attribute values of the sample are tested against the decision tree. A path is traced from the root to a leaf node that holds the class prediction for that sample. The C4.5 algorithm builds a decision tree, from the root node, by choosing one remaining attribute with the highest information gain as the test for the current node. In this paper, Enhanced C4.5, a later version of the C4.5 algorithm, the gain ratio, expresses the proportion of useful information generated by split, i.e., that appears helpful for classification will be used to construct the decision trees. The specific algorithm is given below. The reader is referred to [7] for further details.
Algorithm: Generate a decision tree from the given training data.
Input: Training samples, represented by discrete/ continuous attributes; the set of candidate attributes, attribute-list.
Output: A decision tree Method:
1) Create a node N;
2) If samples are all of the same class, C, then
3) Return N as a leaf node labeled with the class C;
4) If attribute-list is empty then
5) Return N as a leaf node labeled with the most common class in samples; (majority voting)
6) Select test-attribute, the attribute among attribute-list with the highest information gain ratio;
7) Label node N with test-attribute;
8) For each known value ai of test-attribute
9) Grow a branch from node N for the condition test-attribute = ai;
10) Let si be the set of samples in samples for which test-attribute = ai;
11) If si is empty then
12) Attach a leaf labeled with the most common class in samples;
13) Else attach the node returned by Generate_decision_tree
(si, attribute-list).
Attribute Selection:
The information gain measure used in step (6) of above Enhanced C4.5 algorithm is used to select the test attribute at each node in the tree. Such a measure is referred to as an attribute selection measure or a measure of the goodness of split. The attribute with the highest information gain (or greatest entropy reduction) is chosen as the test attribute for the current node. This attribute minimizes the information needed to classify the samples in the resulting partitions. Such an information-theoretic approach minimizes the expected number of tests needed to classify an object and guarantees that a simple (but not necessarily the simplest) tree is found.
Existing Algorithm: Information Gain:
Let S be a set of training set samples with their corresponding labels. Suppose there are m classes and the training set contains si samples of class I and s is the total number of samples in the training set. Expected information needed to classify a given sample is calculated by:?
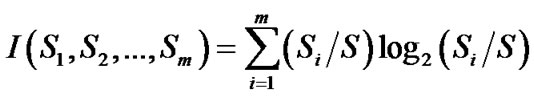 (1)
(1)
A feature F with values {f1, f2, ? fv} can divide the training set into v subsets {S1,S2,? Sv} where Sj is the subset which has the value fj for feature F [Zhi-xin, 2005]. Furthermore let Sj contain Sij samples of class i. Entropy of the feature F is
 (2)
(2)
Information gain for F can be calculated as:
 (3)
(3)
In this experiment, information gain is calculated for class labels by employing a binary discrimination for each class. That is, for each class, a dataset instance is considered in-class, if it has the same label; out-class, if it has a different label. Consequently as opposed to calculating one information gain as a general measure on the relevance of the feature for all classes, we calculate an information gain for each class. Thus, this signifies how well the feature can discriminate the given class (i.e. normal or an attack type) from other classes.
4.2.Proposed Enhancement: Gain RatioCriterion
The notion of information gain introduced earlier tends to favor attributes that have a large number of values. For example, if we have an attribute D that has a distinct value for each record, then Info(D,T) is 0, thus Gain(D,T) is maximal. To compensate for this, it was suggested in [6] to use the following ratio instead of gain.
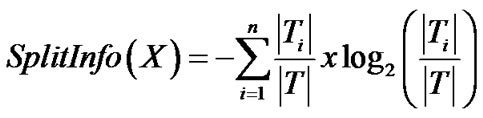
Split info is the information due to the split of T on the basis of the value of the categorical attribute D, which is defined by
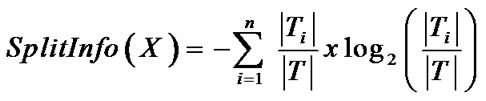 (4)
(4)
And the gain ratio is then calculated by
 (5)
(5)
The gain ratio, expresses the proportion of useful information generated by split, i.e., that appears helpful for classification. If the split is near trivial, split information will be small and this ratio will be unstable. To avoid this, the gain ratio criterion selects a test to maximize the ratio above, subject to the constraint that the information gain must be large, at least as great as the average gain over all tests examined.
5.Implementation and Results
Since information gain is calculated for discrete features, continuous features should be discretized. To this end, continuous features are partitioned into equalized partitions by utilizing equal frequency intervals [16]. In equal frequency interval method, the feature space is partitioned into arbitrary number of partitions where each partition contains the same number of data points. That is to say, the range of each partition is adjusted to contain N dataset instances. If a value occurs more than N times in a feature space, it is assigned a partition of its own. In ?0% KDD?dataset, certain classes such as denial of service attacks and normal connections occur in the magnitude of hundreds of thousands whereas other classes such as R2L and U2R attacks occur in the magnitude of tens or hundreds. Therefore, to provide sufficient resolution for the minor classes N is set to 10, (i.e. maximum 50,000 partitions).
Enhanced C4.5 Rules
Enhanced C4.5rules read the decision tree produced by Enhanced C4.5 and generates a set of production rules from each and from all trees together. Single Enhanced C4.5 acquires pruned decision tree with 117 nodes on train data. Total classification error rate is 47%. However, we found that Enhanced C4.5 has high classification capability for buffer_overflow and guess_passwd. Following results is a part of Enhanced C4.5 rules for buffer_overflow and guess_passwd on given 29313 training patterns.
Detecting Misuse Data
The anomaly data is detected using the rules generated. The rules are given as SQL queries and then the test data is given as input. The data are separated and stored in the different database either as normal or anomaly data. By
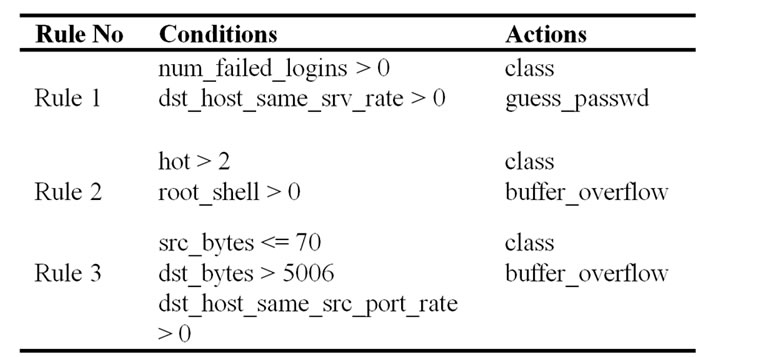
Table 1. Rules for training data.
this classification we can detect the misuse data in the testing dataset.
Different databases are created for different data. The network accepts the normal packets. The abnormal data are then detected and then deleted. As the anomaly data is detected in the network an alert message is given to the user of the system or administrator.
RESULTS
Tree Generation with Training Data
Enhanced C4.5 summarizes its results in a table of the following form:
Evaluation on training data (4000 items):
Before Pruning After Pruning
---------------- ---------------------Size Errors Size Errors
Estimate
1085 496(12.4%) 5 46(13.7%) (26.9%)
Evaluation on test data (4000 items):
Before Pruning After Pruning
---------------- --------------------Size Errors Size Errors
Estimate 1085 1232(30.8%) 873 1206(30.1%) (26.9%)
Decision Tree Generation:
Subtree[S1]
diff_srv_rate <= 0.9:portsweep< 5.0/2.3 >
diff_srv_rate> 0.9:macspoofing< 7.0/1.3 >
Subtree[S2]
dst_host_same_src_port_rate<=0.75:others
<103.0/5.0>
dst_host_same_src_port_rate>0.75:land < 4.0/2.2 >
Subtree[S3]
dst_host_src_rerror_rate<=0.5:macspoofing <14.0/1.3>
dst_host_src_rerror_rate>0.5:portsweep <4.0/1.2 >
Subtree[S4]
dst_host_src_diff_host_rate<=0.25:macspoofing
<8.0/1.3 >
dst_host_src_diff_host_rate>0.25:others <4.0/1.2 >
Evaluation on training data (105131 items):
Before Pruning After Pruning
---------------- ---------------------Size Errors Size Errors
Estimate 955 74 (0.1%) 446 109(0.1%) (0.2%)
The above rule depicts the decision tree generation. Most of this should be self-explanatory. The" Size"column gives the number of nodes in the decision tree. The "Errors"column gives the number (and percentage) of examples that are misclassified. The "Estimate"column gives the predicted error rate for new examples (this is the so-called "Pessimistic"estimate, and it is computed internally by the tree algorithm). In this case, we see that the unpruned decision tree had 1,085 nodes and made 496 errors on the training data and 1,232 errors (or 30.8%) on the test data. Pruning made the tree significantly smaller (only 873 nodes) and, while it hurt performance on the training data, it slightly improved performance on the test data. The pessimistic estimate (26.9%) was actually a bit optimistic, but not too far off the mark (30.1%). You should use the error rate on the test data to plot your learning curves.
Enhanced C4.5 also prints out a confusion matrix that has one row and column for every class. The number shown in row i, column j is the number of examples that we classified into class i but whose true class was j. The perfect confusion matrix has entries along the diagonal only.
Generation of Rules from Tree
After Enhanced C4.5 has been run, then convert the decision tree into a set of rules. To execute the program, use the following command line:
C4.5rules -f stem -u >> stem.log Enhanced C4.5rules will read the stem.names, stem.data and stem.unpruned files and append its output to the file stem.log. It will evaluate its rules on the examples in stem.test. This program can be quite slow.
This rules act as a platform for misuse detection. These rules are saved in a separate document and then they are used as SQL query. Enhanced C4.5 ules displays all of the rules and then summarizes the rule performance in the following manner
Read 105131 cases (41 attributes)
Processing tree 0 Final rules from tree 0:
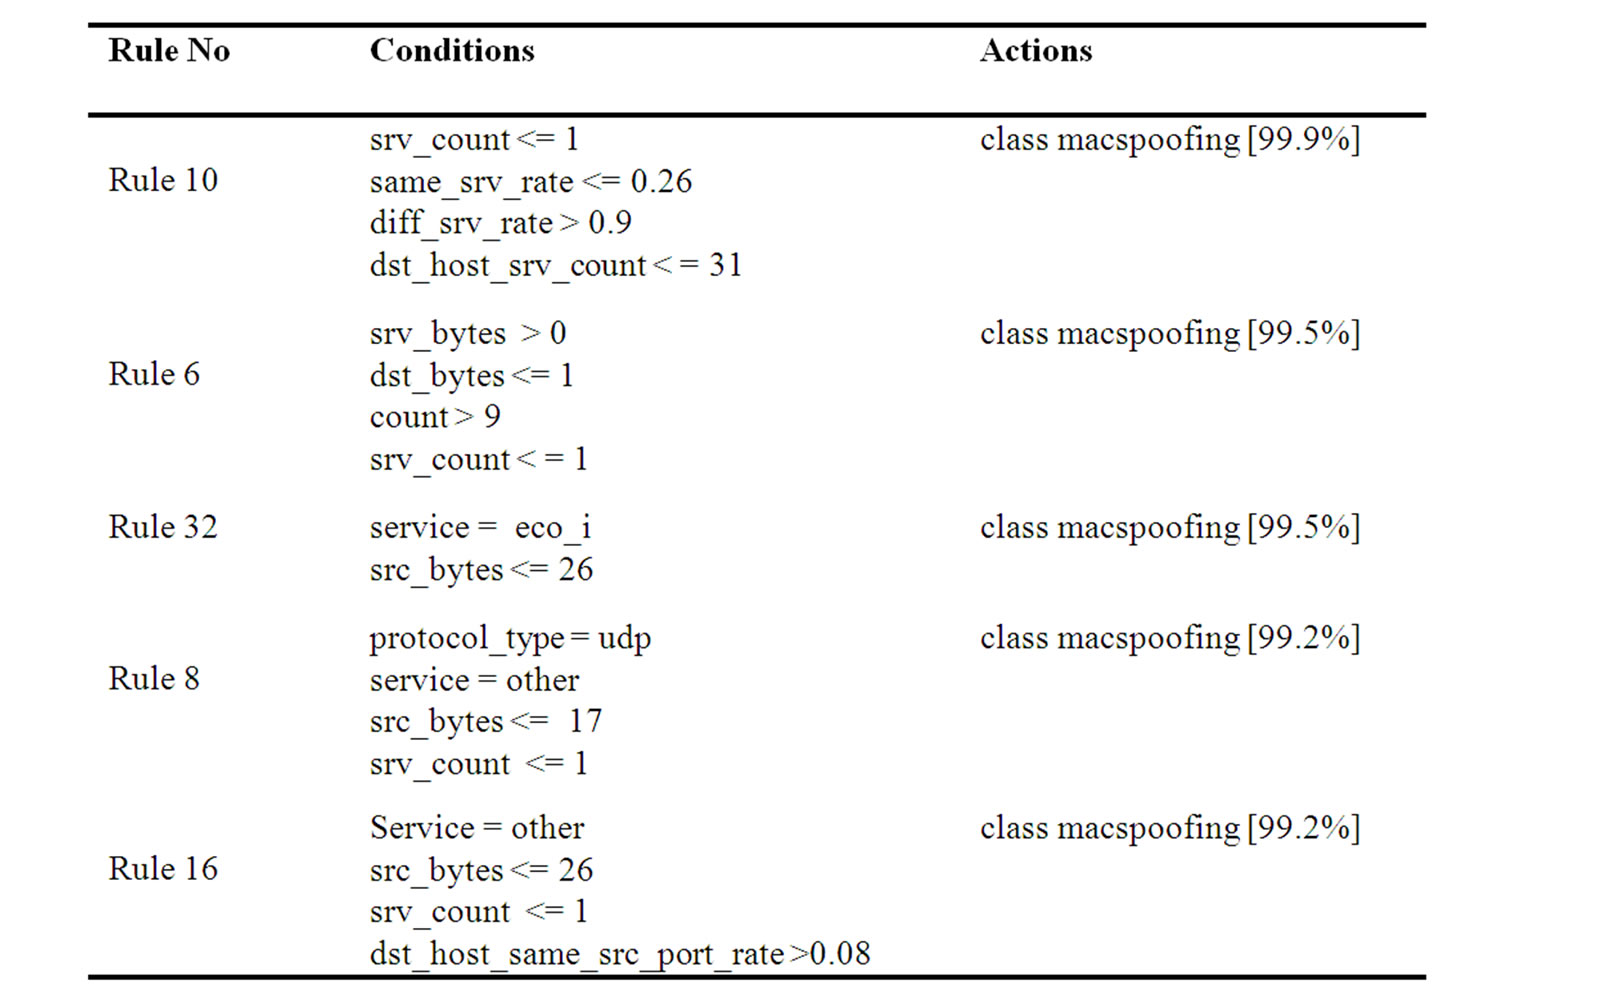
Table 2. Rules for testing data.
The columns in the confusion matrix given below have the following meaning.
♦ "Rule" The number of the rule. There is one row for each rule.
♦ "Size" The number of tests in the rule.
♦ "Wrong" The number of times the rule made an error (also expressed as a percentage).
♦ "Advantage" A heuristic quantity used by the rule to select and prune rules.
♦ The class given in the conclusion part of the rule.
♦ "Error" The estimated error rate for this rule.
The classified results, the false positive and detect rate was obtained in confusion matrix shown in the following
Default class: smurf Evaluation on training data <105131 items>:
Tested 105131, errors 18343 (17.4%)
In Table 3 we see that the rules achieved an error rate 17.4% on the test data. The rules are grouped according to their output classes. Furthermore, the classes are ordered. The rules are applied in th order given. If none of the rules applies to an example, then the example is assigned to the "Default"class. The top left entry in the confusion matrix shows that 6038 of the actual"Normal"test examples were predicted to be normal by this entry. The last column indicates that in total 99.6% of the actual
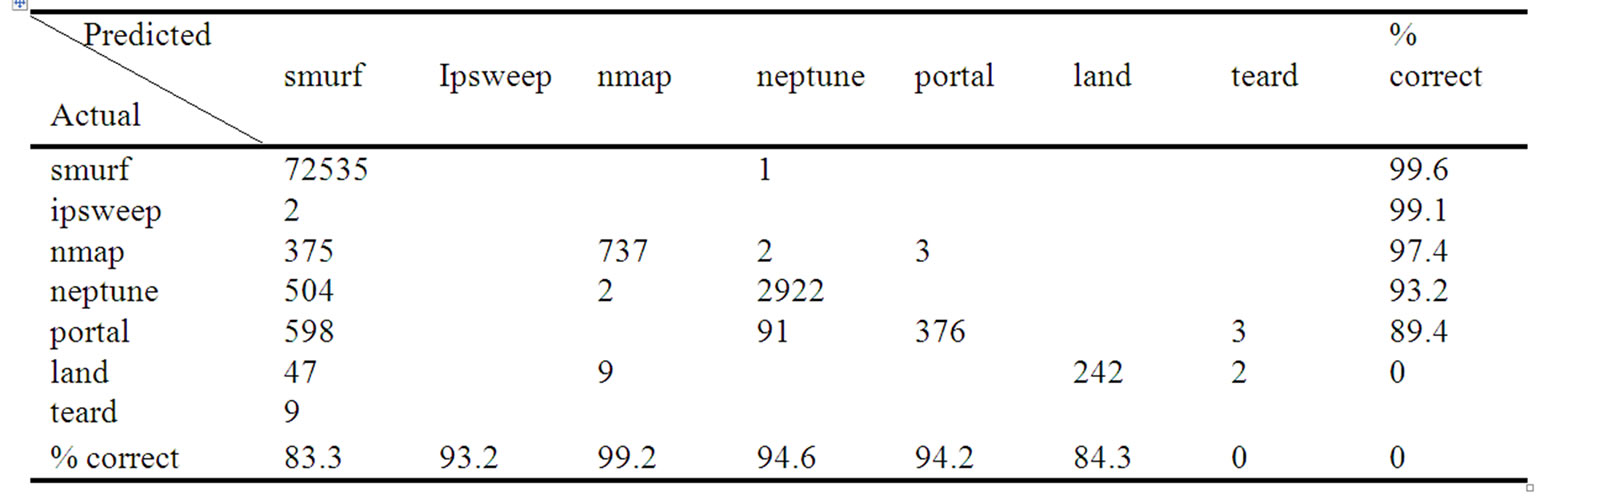
Table 3. Confusion matrix obtained by C4.5.
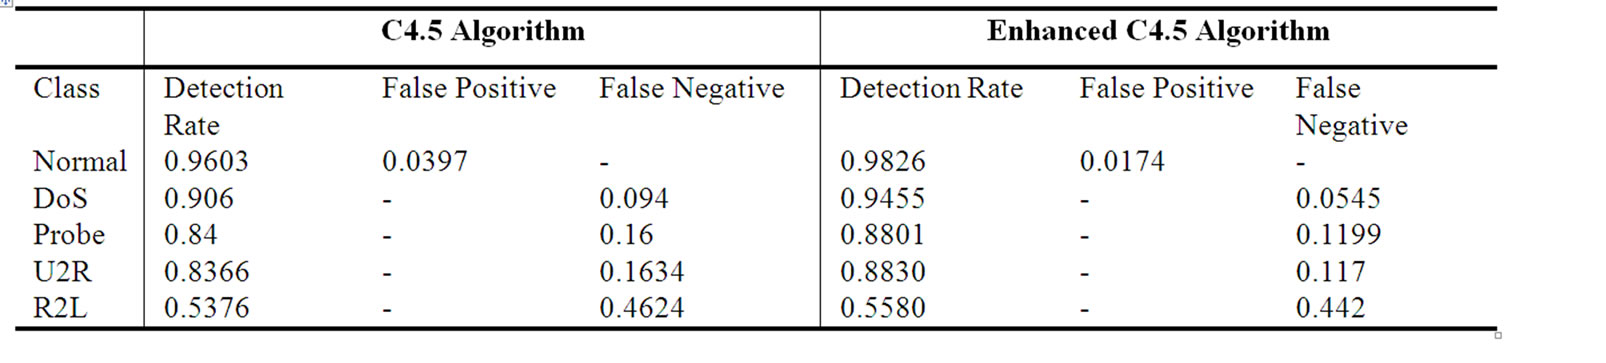
Table 4. Performance comparison of C4.5 vs enhanced C4.5.
normal examples were recognized correctly. The bottom row shows that 89.3% of test examples said to be normal were indeed normal in reality. From the last column, we can obtain the average detect rate of 84.9%, the false positive rate is 15.1%.
Classifying and Detecting Anomalies
Misuse detection is done through applying rules to the test data. Test data is collected from the DARPA. The test data is stored in the database. The rules are applied as SQL query to the database. This classifies data under different attack categories as follows:
1) DOS (Denial of Service)
2) Probe
3) U2R (User to Root)
4) R2L (Root to Local)
The C4.5 algorithm builds a decision tree, from the root node, by choosing one remaining attribute with the highest information gain as the test for the current node. In this paper, Enhanced C4.5, by choosing one remaining attribute with the highest information gain ratio as the test for current node is considered a later version of the C4.5 algorithm, will be used to construct the decision trees for classification. From the table 5.4 it is clear that Enhanced C4.5 outperforms the classical C4.5 algorithm. R2L attack was a bit challenging to Enhanced C4.5 but even in that case, it has reported a subtle improvement over its counter part.牋
Split info is the information due to the split of T on the basis of the value of the categorical attribute D, which is defined by
 (4)
(4)
And the gain ratio is then calculated by
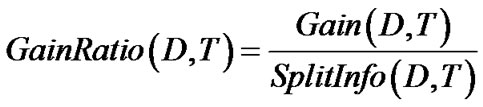 (5)
(5)
In Enhanced C4.5 the gain ratio, expresses the proportion of useful information generated by split, i.e., that appears helpful for classification. If the split is near-trivial, split information will be small and this ratio will be unstable. To avoid this, the gain ratio criterion selects a test to maximize the ratio above, subject to the constraint that the information gain must be large, at least as great as the average gain over all tests examined.
It has been observed that the class distribution in training data will affect classifier learning significantly since the decision trees are built with the statistical information of the samples, and naturally occurring class distribution may not be the best in terms of classification performance. Thus, not all the connection records from original training set were used. Some heuristics have been employed in selecting the training set. Basically, all the samples will be used if the number of samples is relatively small, and only a small subset will be randomly selected from the original training data if the size of the training data is huge.
6.Conclusions and Future Enhancement
In this paper, a novel architecture for NIDS has been proposed which uses an Enhanced C4.5 algorithm for intrusion detection in the system. The NIDS monitors network packets and connection status from the network layer to the application layer of the TCP/IP protocol stack. The NIDS detects anomaly behaviors through state transition and classification that has been carried out using Bayes-like decision. The major advantage of this architecture is that it creates profile using enhanced C4.5 algorithm and utilizes the original C4.5 algorithm to implement behavior classification. The system has been tested with a set of attacks using KDD-99 data set. The test show that this NIDS detects low-level network attacks effectively with low false positive rate, and it has a good performance in detection of unknown attacks, especially for PROBE, DOS and U2R attacks.
In the future work, number of inside attacks can be simulated and the attack can be detected. More attention shall be paid for U2R and R2L attacks. The detection of U2R and R2L attack is more difficult because of their close resemblance with the normal connections. More accurate detection methods can be used for U2R and R2L attacks. In the future work the anomaly is going to be detected by the clustering technique.
7.References
[1] S. Kumar and E. H. Spafford, 1995, "A software architecture to support misuse intrusion detection,"in Proceedings of the 18th National Conference on Information Security, pp.194-204, April 2001.
[2] K. Ilgun, R. A. Kemmerer, and P. A. Porras, 1995,"State transition analysis: A rule-based intrusion detection approach,"IEEE Transaction on Software Engineering Vol. 28, No. 2, pp. 181?99, March 2005.
[3] C. T. Lu, A. P. Boedihardjo, and P. Manalwar,"Exploiting efficient data mining techniques to enhance intrusion detection systems,"IEEE International Conference, Blacksburg, USA, pp. 512?17, April 2005.
[4] J. Zhang and M. Zulkernine, "A hybrid network intrusion detection technique using random forests,"Proceedings of the First International Conference on Availability, Reliability and Security, Vienna, University of Technology, Austria, pp. 121-232, April 2006.
[5] J. F. Tian, Y. Fu, Y. Xu, and J. L. Wang, "Intrusion detection combining multiple decision trees by fuzzy logic,"Proceedings of the Sixth International IEEE Conference on Parallel and Distributed Computing, Applications and Technologies, Dalian, China, pp. 256-258, May 2005.
[6] R. J. Henery, "Classification," Machine Learning Neural and Statistical Classification, 1994.
[7] J. R. Quinlan, "C4.5: Programs for machine learning,"Morgan Kaufmann, San Mateo, California, 1993.
[8] C. Xiang and S. M. Lim,"Design of multiple-level hybrid classifier for intrusion detection system,"in IEEE Transaction on System, Man, Cybernetics, Part A, Cybernetics, Vol. 2, No. 28, Mystic, CT, pp. 117-222, May 2005.
[9] P. Kabiri and A. A. Ghorbani,"Research on intrusion detection and response: A survey,"International Journal of Network Security, Vol. 1, No. 2, pp. 84-102, February 2005.
[10] J. Shavlik and M. Shavlik, "Selection, combination, and evaluation of effective software sensors for detecting abnormal computer usage,"Proceedings of the First International Conference on Network security, Seattle, Washington, USA, pp. 56?7, May 2003.
[11] J. R. Quinlan, "Decision trees as probabilistic classifiers," in Proceedings of the Fourth International Workshop on Machine Learning, Morgan Kaufmann, pp. 31-37, June 1987.
[12] W. Lee, S. Stolfo, and K. Mok, "A data mining framework for building intrusion detection models,"in Proceedings of IEEE Symposium on Security and Privacy, Oakland, CA, USA, pp. 120-232,1 June 1999.
[13] S. Sarasamma, Q. Zhu, and J. Huff, "Hierarchical Kohonen net for anomaly detection in network security,"IEEE Transactions on System, Man, Cybernetics, Part B, Cybernetics, Vol. 35, No. 2, pp. 302-312, April 2005.
[14] L. Breiman,"Pasting small votes for classification in large databases and on-line,"Machine Learning, Vol. 36, No. 1-2, pp. 85-103, 1999.
[15] J. W. Shavlik, S. Calcari, T. Eliassi-Rad, and J. Solock, "An instructable, adaptive interface for discovering and monitoring information on the World-Wide Web,"Intelligent User Interfaces, pp. 157-160, 1999.
[16] Z. X. Yu, J. R. Chen, and T. Q. Zhu, "A novel adaptive intrusion detection system based on data mining,"in Proceedings of the Fourth International Conference on Machine learning and Cybernetics, Guangzhou, pp. 2390-2395, June 2005.