Journal of Applied Mathematics and Physics
Vol.03 No.08(2015), Article ID:59122,10 pages
10.4236/jamp.2015.38132
Dynamics of Charge Transfer by Surface Electric Discharges in Atmospheric Air
Alec Houpt, Sergey B. Leonov
Flow PAC Institute, University of Notre Dame, Notre Dame, USA
Email: sleonov@nd.edu


Received 17 August 2015; accepted 19 August 2015; published 26 August 2015

ABSTRACT
This work reveals essential details of plasma-surface interaction in atmospheric air that are important for a wide range of applications, beginning from airflow control and up to the high-voltage insulation. The paper discusses experimental data characterizing dynamics of development and kinetics of energy coupling in surface dielectric barrier discharge (SDBD), atmospheric air plasmas sustained over dielectric surfaces, over a wide range of time scales. The experiments have been conducted using microsecond pulse voltage waveform of single and alternating polarities. Time-resolved discharge development and mechanisms of coupling with quiescent air are analyzed using nanosecond gate camera imaging, electrical measurements, and original surface charge sensors. The results demonstrate several new, critically important processes overlooked in previous studies. Specifically, it is shown that SDBD plasmas energy release may be significantly increased by using an optimized waveform.
Keywords:
Surface Barrier Plasmas, Electric Charge Transfer, Surface Potential, Dynamics of Charge Dissipation

1. Introduction
Beginning from early experiments [1]-[3], the analysis of mechanisms of a boundary-layer transition and separation control using surface dielectric barrier discharge (SDBD) actuators continues to be one of the main trends in active flow control studies. The numerous works are summarized in a set of reviews, [4]-[7] and references within. It is a commonly accepted viewpoint that in the case of AC-powered SDBD the dominant mechanism of a plasma-flow interaction is a near-wall flow entrainment by ions accelerated in a space charge region (EHD flow acceleration), which is called an “ion wind”. This phenomenon appears to be well understood [8] [9]. The magnitude of this effect is controlled by peak electric field and space charge density in the discharge (primarily in near-electrode and/or streamer head regions). However, the increase of flow control authority is limited by surface charge accumulation, which reduces the electric field in the plasma. It is also limited by the ionization instability appearing in the form of discharge contraction (constriction in some papers), potentially making localized Joule heating a more significant effect. As a result, the use of EHD acceleration for high-speed flow control, at flow velocities of a few hundred m/s, remains challenging. Determining whether the actuator effect on the flow at these conditions is caused by EHD body force or by localized Joule heating remains mostly an open question.
In SDBD plasmas powered by high-voltage nanosecond pulse waveforms EHD acceleration appears to be insignificant [10] [11]. The use of these plasma actuators in flows over airfoils at a non-zero angle of attack demonstrates significant modification in the flow pattern, resulting in boundary layer flow reattachment at high flow velocities, M = 0.17 - 0.85, and over a wide range of pulse repetition rates [10] [12]. Some papers [11] suggested that in this case the dominant effect of the plasma on the flow is caused by rapid localized heat generation in the actuator, rather than by EHD flow acceleration. Several papers [11] [13]-[15] consider the compression waves generated in nanosecond pulse DBD plasma actuators due to mechanism of fast heating [16] [17] as the major agent of the plasma control effect. In spite of these detailed studies, there appears to be no direct evidence that compression waves generated by heating on sub-acoustic time scale are indeed the dominant factor in boundary layer tripping or generation of coherent flow structures.
In [18] there was shown that nanosecond (NS) SDBD plasmas generate high-amplitude, broadband, stochastic, point-wise, near-surface perturbations on a long time scale (>100 μs) after the discharge pulse. It was demonstrated experimentally that these “slow” perturbations, entirely different from previously observed compression waves generated on a short time scale (~1 - 10 μs) after the pulse, are caused by discharge contraction and originate from the ends of individual streamers where they attach to the surface. It was also demonstrated that discharge contraction results in a significant increase of energy stored on the dielectric surface during and after the NS discharge pulse, which in this case greatly exceeds energy dissipated as Joule heat (up to a factor of 3 - 4).
2. Experimental Arrangement
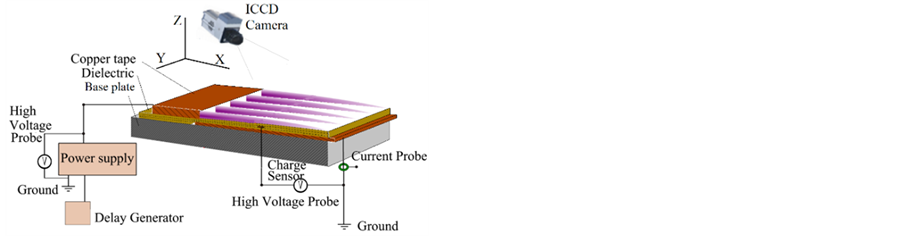
The experimental test cell is shown in Figure 1(a). The experiments have been performed in quiescent air at atmospheric pressure. The discharge electrodes are made of adhesive copper tape 36 mm thick, placed on the top and bottom of an Al2O3 dielectric plate 0.64 mm thick, used as a dielectric barrier, with the overlap between the electrodes Dx = 10 mm [18]. The bottom (encapsulated) electrode was covered by Kapton dielectric film (50 mm thick). The bottom electrode was grounded, and the top electrode was powered by a microsecond scale pulse power supply based on a TREK-20/20C high voltage amplifier. Figure 1 also illustrates the coordinate system and the notations used in the present work, with the x axis directed parallel to the surface and perpendicular to the high-voltage electrode edge, y axis parallel both to the surface and the high voltage electrode edge, and z axis perpendicular to the surface. The origin of the coordinate system is at the edge of the high-voltage electrode.
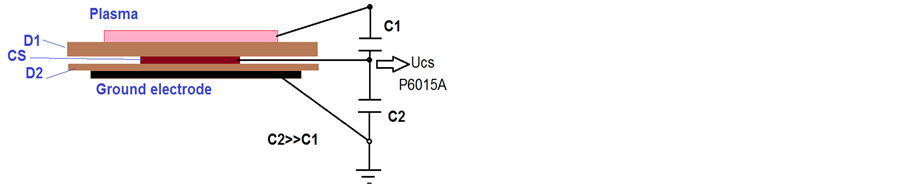
The discharge diagnostics include a high voltage probe (Tektronix P6015A), a current probe (Pearson model 2877), an ICCD camera (Andor iStar, minimum gate 10 ns), and surface charge sensors (CS). The surface charge sensors (CS) [18] are small rectangular shape copper strips with the dimensions x × y = 3 × 25 mm, placed on the bottom of the Al2O3 plate (dielectric barrier), covered by the Kapton dielectric tape layer, and then shielded by a ground electrode, as shown in Figure 1(b). Four sensors were placed on the surface in the first experimental series (Section 3.1) with the distance from the exposed electrode, x = 4, 8, 12, and 16 mm, correspondingly. Five sensors were used in the second series (Section 4) with the distance from the exposed electrode x = 3, 7.5, 12, 16, and 21 mm, correspondingly. During the discharge operation, the time-dependent potential of each sensor was measured by the high-voltage probes. Based on voltage and current waveform measurements
 (a) (b)
Figure 1.Experimental test cell layout (a); Scheme of the charge sensor assembly (b).
and ICCD plasma images, it may be concluded that the presence of a surface charge sensor has a negligible effect on DBD plasma parameters. The RC time constant of the sensor/voltage probe circuit is t = RC = 6 ms. The following equation was used to recalculate the surface electric potential Up from the measured value Um (R is the resistance of the voltage probe), taking into account slow charge removal from the sensor via the high- voltage probe:
 (1)
(1)
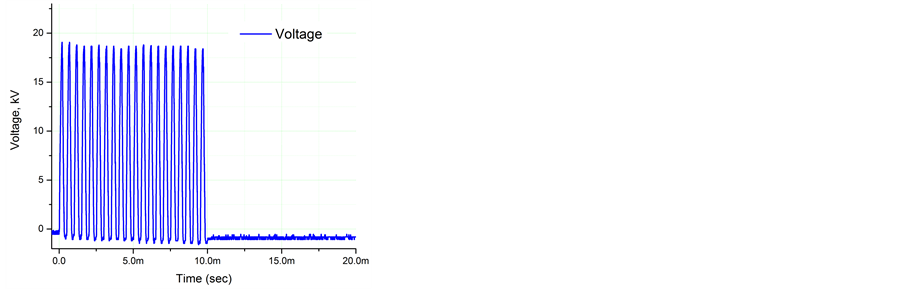
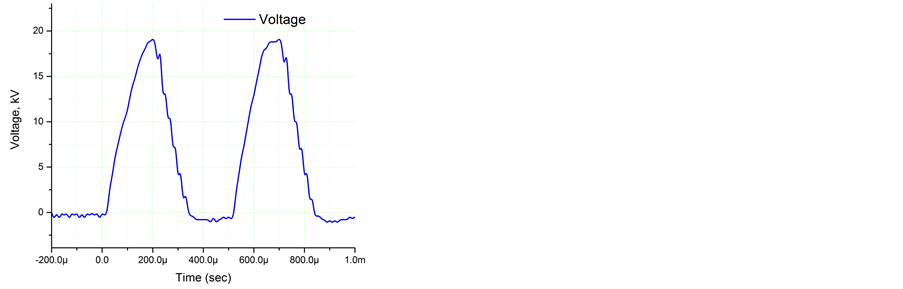
In the first experimental series (Section 3.1) the power supply (TREK 20/20C plus function generator) operates in burst mode as shown in Figure 2(a) similar for positive and negative polarity pulses. The voltage amplitude is U = 18 kV, duration of each pulse is t = 0.2 ms, repetition period T = 0.5 ms, and typical number of pulses is N = 20. Figure 2(a) right shows the waveform in a more detailed view indicating the rather long fronts of the voltage pulses dU/dt » 108 V/s.
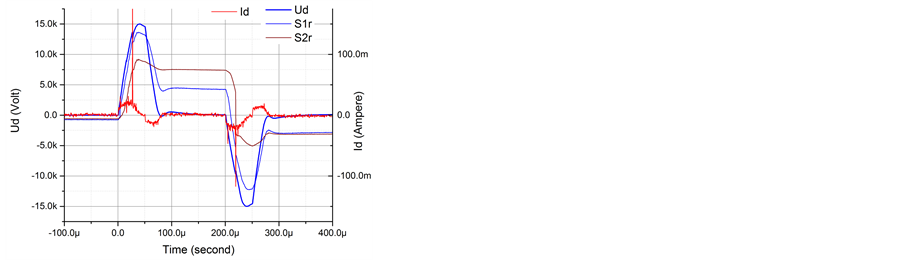
The second experimental series (Section 3.2) was performed with a new version of the HV amplifier TREK 20/20C HS. A custom designed mixer of signals was used to make a waveform of HV power supply with alternating polarity of the pulses in the burst. The typical waveform is shown in Figure 2(b). The voltage amplitude is U = 12 - 15 kV, duration of each pulse is t = 0.05 ms, repetition period T = 0.5 ms, and typical number of pulses is N = 16. Figure 2(b) right shows the waveform in a more detailed view indicating much shorter fronts of the voltage pulses, dU/dt » 5 × 10⁸ V/s, than those in the case of TREK 20/20C. Note, the pulse sequence may start with a pulse of positive or negative polarity and the delay time between individual pulses may be adjusted independently. Figure 2(b) shows a well-recognized correlation between the current peaks and the charge deposition events (charge sensors data). It is also seen that the electric charge can be deposited by some kind of wave, which has quite a low speed: Vch » 400 - 800 m/s for the positive polarity and Vch » 300 - 400 m/s for the negative polarity. The charge deposition also occurs due to a fast process related to the discharge contraction, see below.
 (a)
(a)
 (b)
(b)
Figure 2. Typical waveforms in a burst mode of single (a) and alternating (b) polarities. Discharge voltage, Ud; discharge current Id; data from the first sensor, S1; and data from the second sensor, S2.
3. Experimental Results
3.1. Single Polarity Waveform
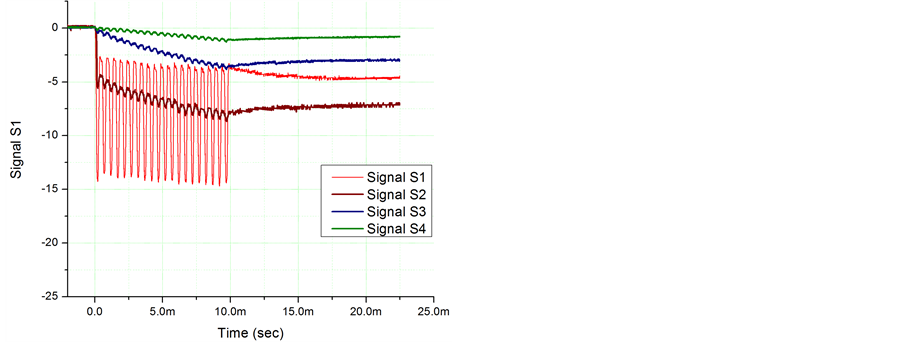
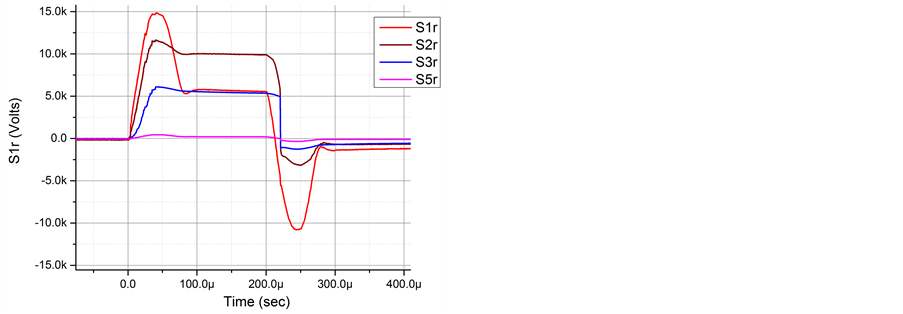
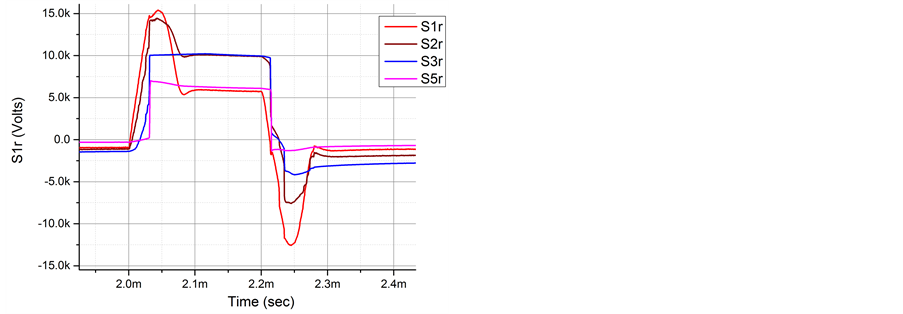
The surface charge dynamics were measured by the CSs. Typical data for the charge deposition is shown in Figure 3 at positive and negative polarity of the supplied voltage. Note that the sensor data starts from zero in each new burst. The data from the first sensor, the nearest to the high voltage electrode, is significantly different compared to the next sensors. In this area the dielectric surface is charged by the plasma and most of the charge quickly dissipates before reaching the other sensors. The amplitude of the charge oscillations is as high as DU > 10 kV at both positive and negative polarities. Contrary to the first sensor, the sensors located far from the HV electrode indicate the fast saturation of the surface charge deposited with a low magnitude of oscillations. It is important to note that between the pulses the signal taken from the second sensor, and in some cases from the third sensor (surface potential at this position), is higher than that of the first sensor, see Figure 3.
The first effect observed is that the amplitude of the surface charge is strongly influenced by a pre-history of SDBD operation. Three modes are considered for further analysis:
1) the surface is uncharged before the burst by means of application of a conducting brush;
2) the surface is charged by a previous burst of opposite polarity with no discharge contraction at negative polarity; and
3) the surface is charged by a previous burst of opposite polarity and a discharge contraction is observed at negative polarity.
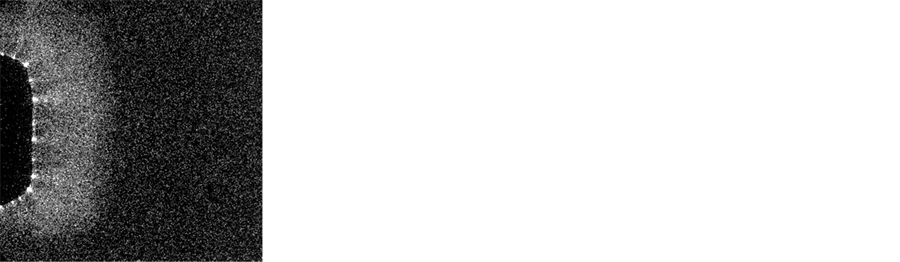
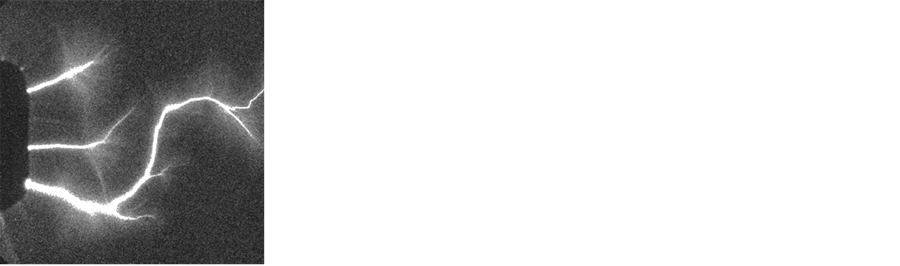
The first pulse of the burst delivers the maximal electric charge compared to the next pulses except for CS3 and CS4 for the negative polarity. In the last case some charge “bleeding” to the areas far from the HV electrode, x > 10 mm, is observed. This pattern drastically changes when the contraction of the SDBD at negative polarity takes place. The most apparent difference between surface charge density dynamics in alternating polarity mode and single polarity mode discharges is in significantly higher charge transfer to the surface in the alternating polarity discharge. There is a substantial difference in transferred charge value and dynamics in regular discharge mode (streamer type discharge at positive polarity and diffusive pattern at negative polarity) compared to contraction mode at negative polarity. The contraction is typically observed at the first pulse in the burst and only if this burst is presided by positive polarity pulses. Figure 4 shows the camera images of SDBD at the end of the first pulse in negative burst. The deposited charge distribution is considerably different in these two cases, as it is shown in Figure 5.
Several studies [19] [20] report that increasing the driving voltage above a certain threshold or increasing the pulse duration to microsecond range results in the formation of leaders, or “negative surface spark” structures in the negative polarity discharge. In nanosecond duration, negative polarity pulses (tpulse << 100 ns), the generation of “negative sparks” appears unlikely. The work [21] discussed the transition of NS SDBD to a “filamentary” mode although it looks to be a different process than considered in the current paper.

 (a) (b)
Figure 3. Surface charge sensors typical traces. S1-S4―sensor numbers from closest to exposed electrode to the furthest away. (a) Positive polarity; (b) Negative polarity.
 (a) (b)
Figure 4. ISSD camera images of the SDBD in diffusive (a) and contraction (b) mode. Negative polarity, first pulse in the burst.
 (a) (b)
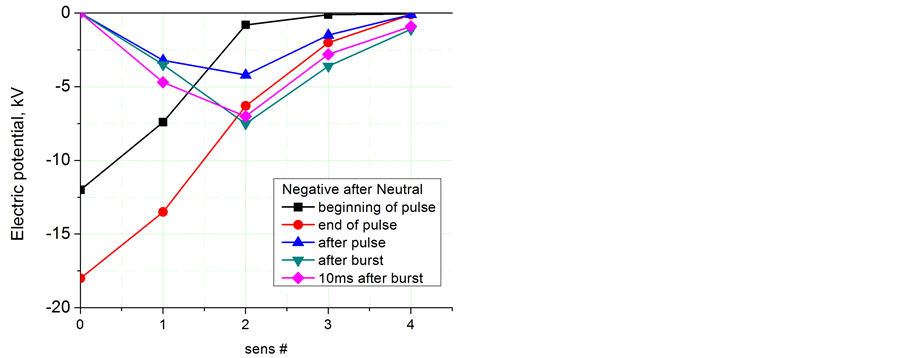
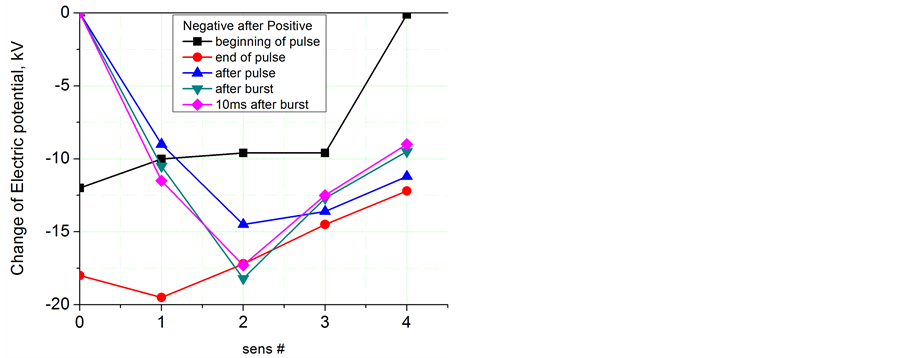
Figure 5. Electric potential distribution over the surface at and after the negative pulses. (a) No discharge contraction; (b) Discharge contraction observed.
An analysis of the data collected by the charge sensors was used to quantify the effect of discharge contraction and waveform polarity on charge transfer and energy coupled. The result of these measurements is summarized in Figure 5. The electric potential distribution is shown for five moments in time: at the beginning of the first pulse in the burst, t = 50 ms; at the end of the first pulse, t = 180 ms; after the first pulse, t = 300 ms; right after the 20th pulse, t = 10.2 ms; and 10 ms after the burst, t = 20 ms. The processes of charge accumulation and bleeding from the area in the immediate vicinity of the exposed electrode are well recognized. The result of the discharge contraction appears in a significantly more distant zone of charged surface. An integral charge deposited in the case of contraction is estimated to be as high as Q > 1 mC while it is about Q » 0.1 mC in the case of diffusive discharge. An electrostatic energy stored on the surface is estimated to be E > 10 mJ in contraction mode and ten times less in the case of the diffusive mode.
The data processing indicates that the discharge contraction significantly increases the energy stored on the dielectric surface, which in this case may exceed the energy dissipated as Joule heat. The stored energy is dissipated if the discharge pulse is followed by an opposite polarity pulse. In a single polarity discharge, on the other hand, surface charge accumulation limits energy coupled to the plasma by subsequent pulses.
3.2. Alternating Polarity Waveform
For the second experimental series with the alternating polarity of pulses the analysis of the charge deposition dynamics and distribution over the dielectric surface is fulfilled based on the data of the charge sensors. Figure 2(b) and Figure 6 presents the recalculated set of the oscilloscope records: the measured values are refined
 (a) (b)
Figure 6. The surface electric potential dynamics depending on the pulse number, detail view. (a) The first positive and negative pulses; (b) The 8th positive and negative pulses.
using Equation (1). Three datasets are shown for comparison: alternating polarity (two charts, for sensors S1-S4 and for S1-S3, S5), positive polarity, and negative polarity pulse sequences. The amplitude of the supplied voltage (HV amplifier output without the test cell) is similar for all three cases, Umax = 15 kV. Note, some residual surface charge may remain on the dielectric surface originating from a previous burst regardless of surface neutralization procedure.
An essential dissimilarity between the bipolar pulse and the single polarity pulse trains is apparent. Looking at CS2-CS4 a change of the surface potential during the single polarity pulses is negligibly small compared to alternating polarity pulses, except for the first pulse. The stepwise modulation of the surface potential for a bipolar pulse train means a significant charge transfer (read: electrical current) up to Q > 1 µC with each pulse. Second, a surface area relevant to the charge deposition is bigger for the bipolar pulses than for the single polarity, especially the negative polarity pulses. The length of the charge deposition area is x < 12 mm in the case of single polarity while for the bipolar pulsing it is x > 21 mm. The third important feature of the discharge operation is a “swing” effect of the surface potential. This phenomenon appears as a result of an increase of the amplitude of charge deposition during a few first pulses, see Figure 6. The nature of the swing effect is an increase of effective longitudinal electric field Ex = (Ux − Up)/x per pulse due to a rise of the charge of opposite polarity deposited in the previous pulse. All features described above are closely related to the process of the discharge contraction.
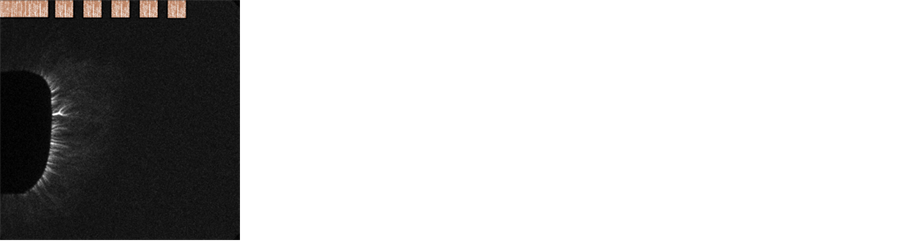
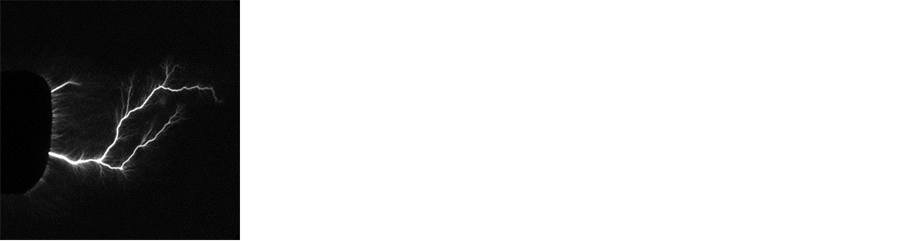
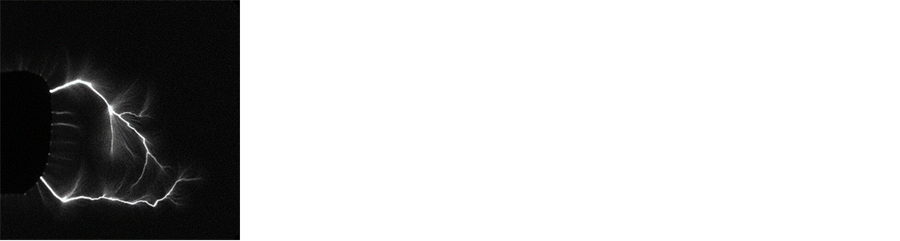
Detailed data on the surface charge dynamics is presented in Figure 6 for the first pair of pulses, and for the 8th pairs of pulses taken in two realizations. These data are complemented with the images in Figure 7 synchronized to the HV pulses and taken with exposure time t = 100 µs. The first positive pulse leads to a more or less slow and gradual charging of the dielectric surface. The discharge looks to be diffusive, as it is shown in Figure 7(a). The first negative pulse demonstrates a two-stage process of the surface “recharging”: a slow charge deposition followed by a stepwise process of charge transfer up to the position of CS3. This second stage correlated well to the start of the discharge contraction, see Figure 7(d). The contraction process is observed to be stronger during the latter pulses for both polarity pulses. Finally the discharge propagates far from the HV electrode by a single stroke at positive polarity pulses and by 2 or several strokes at negative polarity pulses, as it is shown in Figure 6(b) and Figure 7(c) and Figure 7(f).
As it was shown in previous work [18], surface charge decay occurs on three significantly different time scales: t » 1 μs, t » 100 μs, and t > 102 s. The t ~ 1 μs time scale process is likely to be controlled by near-surface charge drift in the plasma in the “reverse” electric field sustained during the voltage reduction on the electrode. This fast process could not be observed in current experimental series because of the HV pulses time scale. The slower surface charge removal process is likely caused by an ion drift and a drift of surface-trapped charges. In the current test this time scale occurs a bit shorter, t » 30 µs, and may be explained by a replacement of the dielectric material, Alumina ceramics vs Kapton. Both these processes result in additional energy release near and at the dielectric surface. The time scale for the rapid process of surface charge decay depends strongly on the distance from the electrode, as illustrated in Figure 6. Basically, surface charge is removed more rapidly from

 (a) (b) (c)
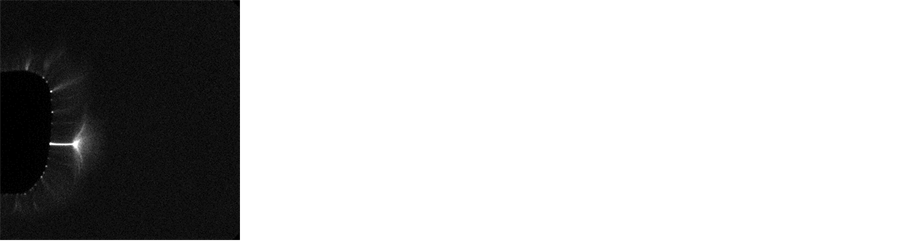

 (d) (e) (f)
Figure 7. Discharge images, taken sequentially in the burst. Top row ((a)-(c)) positive polarity; bottom row ((d)-(f)) negative polarity. The pulse pair number is #1 ((a) and (d)), #2 ((b) and (e)), and #8 ((c) and (f)). The HV electrode and CS positions are indicated by insertion in (b) and (e) images.
the region close to the high-voltage electrode, and the asymptotic surface charge density is typically lower compared to regions further away from the electrode. The charge deposited on the dielectric surface further away from the electrode stays there for a longer time, and a significant fraction of it, up to s » 0.2 mC/cm2, remains there until arrival of an opposite polarity pulse. The last time scale is approximate and strongly depends on the ambient conditions, such that the residual charge can be detected on the surface after several hours.
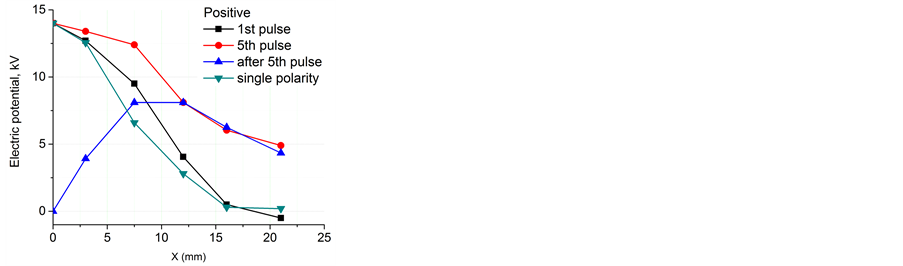
The distribution of the electric potential over the dielectric surface is shown in Figure 8 for the positive and the negative polarities of the supplied voltage. It is acquired from the charge sensor data and is shown for three moments in time: 1) maximal voltage at the first pulse in the burst, t = 50 µs and 250 µs; 2) maximal voltage at the fifth pulse in the burst, t = 2550 µs and 2750 µs; and after the fifth pulse in the burst, t = 2650 µs and 2850 µs. For comparison, the distribution of the surface potential for single polarity pulses are shown as well.
The discharge contraction, which is observed to begin on the 3rd pulse at the latest, significantly increases the surface area charged by the plasma. No less important to the energy balance is that those portions of the electric charge (deposited far from the HV electrode) are not being removed from the surface after the pulse but remain there before the pulse of opposite polarity comes.
The analysis performed above allows us to quantify the energy balance of the discharge in the considered configuration. The total energy coupled at the regular pulse (after, at least, 5 pairs of pulses) is calculated by means of a typical method [18] using the data on the discharge voltage and current. The electrostatic energy stored on the dielectric surface is estimated based on the data of the charge sensors. The potential of the surface at x > 35 mm is assumed to be negligibly small. Note, the discharge demonstrates a significant scattering in the parameters especially when the contraction takes place. Some data in Table 1, such as the total energy release during the pulse, reflect statistically processed values. Most data, such as an electrostatic energy which is stored on the surface between the pulses, is acquired in an individual run which possesses typical parameters for this test series.
An observation of Table 1 allows for a few conclusions to be made. The total energy coupled during the HV pulse for the alternating polarity supplying pattern is 2 - 4 times higher than that of the single polarity pulses. The electrostatic energy stored on the dielectric surface is significantly higher as well mainly because of the remarkably bigger area of charged surface. In the case of single polarity some portion of this energy remains on
 (a) (b)
Figure 8. Typical distribution of the electric potential over the surface for the 1st pulse in the burst, at the 5th pulse, after the 5th pulse, and for a single polarity at the 8th pulse. (a) Positive polarity; (b) Negative polarity.

Table 1. Energy balance of the SDBD powered by 50 µs pulses of alternating and single polarity, U = 14 kV.
the surface between the pulses but most of it dissipates with a time scale of t » 30 µs. Contrary to that, in the case of alternating polarity a significant fraction of the energy is conserved on the surface in the electrostatic form. It partially releases at an opposite polarity pulse.
The dynamics of the surface potential distribution during an individual pulse and after it is presented in Figure 9. An initial distribution at t = 0 is established by the previous pulse of opposite polarity. Before the discharge contraction t < 40 µs the potential grows almost linearly in the area x < 16 mm. This pattern roughly corresponds to the semi-empirical phenomenological models considered in [22] [23]. Then, at t ≥ 40 µs, the process of the discharge contraction modifies the surface potential to have a more flatprofile. After the decrease of the HV electrode voltage, the surface potential distribution relaxes in the near-electrode zone but remains stable at x > 10 mm. The “flash” of the discharge contraction occurs at the time of maximal value of the electric field. The spatial resolution of the CSs does not allow a real value of the local electric field to be measured but does allow for an estimate of the lower limit of the electric field for the contraction development, Emax > 15 kV/cm. Based on the experimental data of this test series the contraction “flash” may be roughly characterized by the following parameters: duration of current peak t £ 100 ns, electric charge deposited 0.1 µC £ Q £ 1 µC, and electric current I ≥ 1 A.
4. Summary
This experimental study of atmospheric SDBD examines different supplied voltage waveforms in terms of surface charge dynamics and energy release in the near-surface gas. It also extends the experimental findings of previous work [18] from nanosecond time scale pulses to microsecond time scale pulses. There appears to be little difference in the physical processes between these time scales. But this variance in time scale may be apparent in the dynamics of interaction with high-speed flow. The time scales discussed in this paper (>10 µs) are higher than a characteristic gas dynamic time in high-speed flow (~10 µs) whereas previous works are on a scale smaller (~10 - 100 ns) than this.
The time-dependent distribution of the surface electric potential is measured by means of original charge sensors. It is shown that the alternating polarity of the supplied voltage gives a significant benefit in the

Figure 9. Dynamics of the X-distribution of the surface potential during and after the t = 50 µs positive pulse following the negative pulse, Umax = 15 kV.
discharge area and the power deposition, increasing it by a factor of 2 - 4. The key factor of the discharge dynamics is the development of ionization instability that appears in the contraction of the discharge current and formation of the filamentary structure of the plasma for both positive and negative polarities. The contraction significantly increases the effective area of the electric charge deposition. A main criterion of the discharge contraction is the generation of a zone with a high level of longitudinal electric field, not less than 15 kV/cm, realized at a change of the sign of the surface charge.
The results demonstrate that surface plasma actuator control authority may be remarkably increased by using an alternating polarity pulse waveform, which is more effective than the removal of surface charge between the pulses.
Acknowledgements
This work was supported by the FlowPAC Institute, Department of Aerospace and Mechanical Engineering, University of Notre Dame. Authors express their gratitude to Professors Igor Adamovich and Victor Soloviev for multiple discussions.
Cite this paper
Alec Houpt,Sergey B. Leonov, (2015) Dynamics of Charge Transfer by Surface Electric Discharges in Atmospheric Air. Journal of Applied Mathematics and Physics,03,1062-1071. doi: 10.4236/jamp.2015.38132
References
- 1. Mhitaryan, A.M., Labinov, S.D. and Fridland, V.Ya. (1964) Electro-Hydrodynamic Method of Boundary Layer Control. In Paper Collection: Some Problems of Aerodynamics and Electrohydrodynamics, Vol. 1, Kiev’s Institute of Civil Aviation Engineers, Kiev.
- 2. Kurjachi, A.P. (1985) Boundary Layer Transition by Means of Electrodynamics Method. Prikl. Math. I Mech., 49. Kazakov, A.V. and Kuryachii, A.P. (1986) Electrogasdynamic Influence on the Development of the Small Disturbances in a Boundary Layer in the Thin Profile. Izv. АN USSR, Mekhanika Zhidkosti i Gaza, 1.
- 3. Roth, J.R., Sherman, D.M. and Wilkinson, S.P. (1998) Boundary Layer Flow Control with a One Atmosphere Uniform Glow Discharge Surface Plasma. AIAA Meeting (Reno USA January 1998) AIAA Paper 1998-0328. http://dx.doi.org/10.2514/6.1998-328
- 4. Corke, T.C., Enloe, C.L. and Wilkinson, S.P. (2010) Dielectric Barrier Discharge Plasma Actuators for Flow Control. Annual Review of Fluid Mechanics, 42, 505-529. http://dx.doi.org/10.1146/annurev-fluid-121108-145550
- 5. Benard, N. and Moreau, E. (2014) Electrical and Mechanical Characteristics of Surface AC Dielectric Barrier Discharge Plasma Actuators Applied to Airflow Control. Exp Fluids, 55, 1846. http://dx.doi.org/10.1007/s00348-014-1846-x
- 6. Wang, J.-J., Choi, K.-S., Feng, L.-H., Jukes, T.N. and Whalley, R.D. (2013) Recent Developments in DBD Plasma Flow Control. Prog. Aerospace Sci, 62, 52-78. http://dx.doi.org/10.1016/j.paerosci.2013.05.003
- 7. Kriegseis, J., Duchmann, A., Tropea, C. and Grundmann, S. (2013) On the Classification of Dielectric Barrier Discharge Plasma Actuators: A Comprehensive Performance Evaluation Study. Journal of Applied Physics, 114, Article ID: 053301. http://dx.doi.org/10.1063/1.4817366
- 8. Corke, T.C., Post, M.L. and Orlov, D.M. (2009) Single Dielectric Barrier Discharge Plasma Enhanced Aerodynamics: Physics, Modeling and Applications. Exp Fluids, 46, 1. http://dx.doi.org/10.1007/s00348-008-0582-5
- 9. Benard, N. and Moreau, E. (2014) Electrical and Mechanical Characteristics of Surface AC Dielectric Barrier Discharge Plasma Actuators Applied to Airflow Control. Exp Fluids, 55, 1846. http://dx.doi.org/10.1007/s00348-014-1846-x
- 10. Little, J., Takashima, K., Nishihara, M., Adamovich, I. and Samimy, M. (2012) Separation Control with Nanosecond Pulse Driven Dielectric Barrier Discharge Plasma Actuators. AIAA Journal, 50, 350-365. http://dx.doi.org/10.2514/1.J051114
- 11. Roupassov, D.V., Nikipelov, A.A., Nudnova, M.M. and Starikovskii, A.Yu. (2009) Flow Separation Control by Plasma Actuator with Nanosecond Pulsed-Periodic Discharge. AIAA Journal, 47, 168-185. http://dx.doi.org/10.2514/1.38113
- 12. Correale, G., Popov, I., Rakitin, A., Starikovskii, A., Hulshoff, S. and Veldhuis, L. Flow Separation Control on Airfoil with Pulsed Nanosecond Discharge Actuator. AIAA Paper 2011-1079.
- 13. Benard, N., Zouzou, N., Claverie, A., Sotton, J. and Moreau, E. (2012) Optical Visualization and Electrical Characterization of Fast-Rising Pulsed Dielectric Barrier Discharge for Airflow Control Applications. Journal of Applied Physics, 111, Article ID: 033303. http://dx.doi.org/10.1063/1.3682568
- 14. Dawson, R. and Little, J. (2013) Characterization of Nanosecond Pulse Driven Dielectric Barrier Discharge Plasma Actuators for Aerodynamic Flow Control. Journal of Applied Physics, 113, Article ID: 103302. http://dx.doi.org/10.1063/1.4794507
- 15. Zhao, Z., Li, J.-M., Zheng, J., Cui, Y.D. and Khoo, B.C. Study of Shock and In-duced Flow Dynamics by Pulsed Nanosecond DBD Plasma Actuators. AIAA Paper 2014-0402.
- 16. Popov, N. (2011) Fast Gas Heating in a Nitrogen-Oxygen Discharge Plasma: I. Kinetic Mechanism. J. Phys. D: Appl. Phys, 44, Article ID: 285201.
- 17. Flitti, A. and Pancheshnyi, S. (2009) Gas Heating in Fast Pulsed Discharges in N2-O2 Mixtures. Eur. Phys. J. Appl. Phys, 45, Article ID: 21001. http://dx.doi.org/10.1051/epjap/2009011
- 18. Leonov, S.B., Petrishchev, V. and Adamo-vich, I.V. (2014) Dynamics of Energy Coupling and Thermalization in Barrier Discharges over Dielectric and Weakly Con-ducting Surfaces on μs to ms Time Scales. J. Phys. D: Appl. Phys, 47, Article ID: 465201. http://dx.doi.org/10.1088/0022-3727/47/46/465201
- 19. Joussot, R., Boucinha, V., Weber, R. and Hong, D. (2011) Negative Spark Leaders on a Surface dbd Plasma Actuator. Plasma Science, IEEE Transactions on Plasma Science, 39, 2194-2195. http://dx.doi.org/10.1109/TPS.2011.2160096
- 20. Akishev, Yu., Aponin, G., Balakirev, A., Grushin, M., Petryakov, A., Karalnik, V. and Trushkin, N. (2013) Stepwise Expansion of a Surface Dielectric Barrier Discharge as a Result of Alternation in Formation of Streamers and Leaders. J. Phys. D: Appl. Phys, 46, Article ID: 135204. http://dx.doi.org/10.1088/0022-3727/46/13/135204
- 21. Stepanyan, S.A., Starikovskiy, A.Yu., Popov, N.A. and Starikovs-kaia, S.M. (2014) A Nanosecond Surface Dielectric Barrier Discharge in Air at High Pressures and Different Polarities of Applied Pulses: Transition to Filamentary Mode. Plasma Sources Sci. Technol, 23, Article ID: 045003. http://dx.doi.org/10.1088/0963-0252/23/4/045003
- 22. Takashima, K., Yin, Z. and Adamovich, I.V. (2013) Measurements and Kinetic Modeling of Energy Coupling in Volume and Surface Nanosecond Pulse Discharges. Plasma Sources Science and Technology, 22, Article ID: 015013. http://dx.doi.org/10.1088/0963-0252/22/1/015013
- 23. Enloe, C.L., Font, G.I., McLaughlin, T.E. and Orlov, D.M. (2008) Surface Potential and Longitudinal Electric Field Measurements in the Aerodynamic Plasma Actuator. AIAA Journal, 46, 2730-2740. http://dx.doi.org/10.2514/1.33973