 Journal of Environmental Protection, 2011, 2, 629-638 10.4236/jep.2011.25072 Published Online July 2011 (http://www.scirp.org/journal/jep) Copyright © 2011 SciRes. JEP Physicochemical Characterization of Sediment in Northwest Arkansas Streams Chris W. Rogers1, Andrew N. Sharpley1, Brian E. Haggard2, J. Thad Scott1, Bodie M. Drake1 1Department Crop, Soil, and Environmental Sciences, University of Arkansas Division of Agriculture, Fayetteville, USA; 2Arkansas Water Resources Center, University of Arkansas Division of Agriculture, Fayetteville, USA. Email: cwrogers@uark.edu Received March 29th, 2011; revised May 2nd, 2011; accepted June 10th, 2011. ABSTRACT Eutrophication of surface waters is a critical concern in regions around the world facing nutrient surpluses as a result of confined animal feeding operations (CAFOs) and subsequent land application of manures. While large amounts of research exist on the transport of nutrient enriched runoff from fields to surface waters less information is available on in-stream processes controlling the transport of P in-stream. Thus, information is needed on the role of stream sedi- ments in regulating transient phosphorus (P) to better understand the relationship between nutrient inputs and water quality. Fine-sized sediments (< 2-mm) regulate P via sorption and burial, while algae attached to larger-sediments (> 2-mm) consume and store P. From fine-sized sediment a modified P saturation ratio (PSRmod), related to the sediment’s ability to bind P and determined from Mehlich-3 extracted nutrients, has been correlated to in-stream dissolved reac- tive P (DRP) concentrations. The objectives of this study were to determine the relative size distribution of total- and fine-sized sediment (sand, silt clay) fractions among streams, determine the optimum sample number needed to char- acterize Mehlich-3 P (M3P) and PSRmod, and finally determine the applicability of PSRmod as an indicator of stream water column DRP concentrations. Stream sediments were sampled from the 0- to 3-cm depth from stream reaches ranging from (25 – 75 m) in August, 2008 for characterization along with water samples collected from the thalweg for DRP concentration determination. Additional water column samples were collected along with fine-sized sedi- ment chemical properties in February, May, and June 2009. The distribution of sediment size classes was statisti- cally simi- lar, with 2- to 20- and 20- to 75-mm sized sediment dominating. Fine-sized sediment (< 2 mm) contributed 9% to 18% of total-sediment and was comprised primarily of sand. Sampled stream M3P and PSRmod were determined to typically be sufficiently characterized by a sample scheme utilizing three samples points. Modified P saturation ratio of < 2-mm sediment was highly correlated to DRP levels across sampling dates (r = 0.86), suggesting PSRmod has the potential to be used as an indicator of the ability of stream sediments to enrich stream water with P. Thus, fine-sized sediment nu- trient concentrations appear to be key regulators of water column P concentrations. Keywords: Stream, Phosphorus, Nutrient Enrichment, Sediment 1. Introduction Accelerated eutrophication of freshwaters is identified as the leading impairment of water quality in the United States [1]. In freshwater lakes, phosphorus (P) is linked to increased algal productivity, as it is the most common limiting nutrient for algal growth [2,3]; however, controls in stream systems can be more complex [4]. It is under- stood that stream sediment characteristics influence P types and amounts transported from the landscape to lakes and reservoirs. Within the fluvial system, sediments act as either sinks or sources of P and thus, may be influ- ential in determining the time frame over which changes occur in watersheds after management strategies have been implemented [5]. Sediment size fractions have important impacts on de- termining dominate processes controlling P-forms in streams. Phosphorus interaction with fine-sized sediments (<2-mm) are typically regulated by abiotic reactions, and with increasing size, biological control associated with attached algal growth becomes the dominate P uptake mechanism [6]. Work in the United Kingdom reported P release from algal-biofilms on large-sized sediments (> 20-mm) to stream water was greater than release from fine sediments (<2-mm) [7]. Howev er, Lottig and Stanley [6] reported that fine-sediments (< 2-mm) had a greater capacity to adsorb P than larger sediments and thus, had  Physic oc hemical Characterization of Sediment in Northwest Arkansas Streams 630 a greater capacity to act as buffers of P entering during episodic rainfall-runoff events. We determined the relative size distributions of bed sediments of five streams in the Upper Illinois River Watershed (UIRW) in Northwest Arkansas during base- flow conditions, landuse within the watershed draining into them, and sediment chemical properties using rou- tine soil extractions. Specifically, we determined Meh- lich-3 P and modified P saturation ratio (PSRmod), a pa- rameter calculated from Mehlich-3 extractable nutrient concentrations of M3P and P sorbing elements [8,9]. Modified P saturation ratio was only recently reported by Haggard et al. [9] during an experiment sampling stream sediments from May to June, 2006 and thus, warrants further investigation to determine its applicability. Specific objectives of the study were to determine the distribution of sediment proportions across streams and determine if relative proportions were similar among sampled streams, and as research constraints often pose limitations on the number of sediment samples which can be collected, we determined the optimal number of sam- ples needed to characterize both M3P and PSRmod. Fi- nally, we investigated the applicability of PSRmod as an indicator of stream DRP concentrations across various streams and sampling dates. 2. Methods 2.1. Study Site Description Northwest Arkansas is characterized by gently sloping hills and karst limestone geology, and was once domi- nated by oak (Quercus spp.) - hickory (Carya spp.) for- ests with areas of tallgrass prairies [10]. Within the re- gion, these prairies have largely been converted to pas- ture and hay fields with poultry-beef cattle production systems dominating agricultural production. Furthermore, a large portion of the soils within the reg ion situated atop the underlying karst limestone geology are stony, shal- low, and occur on steep slopes, which can lead to rapid surface runoff and groundwater leaching [11]. Agricultural land use in Northwest Arkansas is often cited as a leading contributor to in creased inpu ts of P into the waters of the region [12]. This is partly due to the rapid increase in population growth over the last 20 years and the area’s large number of poultry prod uction opera- tions and associated litter, which is often spread on local pastures [13,14]. With continued application of litter at rates to meet forage nitrogen (N) requirements, soil P can accumulate to levels that increase the risk of P enrich- ment of runoff [13]. Urban areas in the region are also important sources of P, as they have large amounts of impervious surfaces, inputs from lawns, and waste water treatment plants [15]. Nutrient enrichment of surface waters from agricultural and urban sources is a world- wide phenomenon and similar issues arise in areas as diverse as Arkansas, Denmark, and Ireland [16]. These increases in CAFOs can often lead to a localized surplus of manure, and in time, can lead to the increased suscep- tibility of P runoff from highly P enriched surface soils [14,16]. Five streams draining into the Illinois River in North- west Arkansas were selected with agricultural, forested, and urban land uses present within each. Subwatersheds were delineated by sampling sites using a digital eleva- tion model and land use/land cover data in ArcGIS 9.2 [17-19]. The delineated subwatersheds were determined using the ArcHydro tool within ArcGIS and proportion land use was calculated as percentages of total land area within each subwatershed. 2.2. Sample Collection and Analysis Techniques A representative reach (riffle and pool) was identified at each of the 5 streams in August, 2008. Reaches (25 - 75 m) were measured at equally spaced intervals with 7 to 10 transects collected to determine the relative substrate composition of the streams. As sediment distribution and characterization was a primary objective at the August, 2008 sample date, each individual transect was collected separately. Transect width was measured and stream ve- locity measured using a Flo-Mate 2000 (Marsh-McBirney, Inc., Frederick, MD) at equally spaced points across the individual transects upstream at each sampling site dur- ing baseflow conditions. Width and velocities were used to calculate flow rate and average velocity across each transect within the reach. At each site, a stream water sample was collected from the thalweg at the time of sediment sampling. A water subsample was filtered (0.45-µm), acidified to pH 2 (HCl) in-field, and transported to the laboratory and stored at 4˚C until analysis. An unfiltered water sample was also acidified (pH 2) and stored at 4˚C until analysis. Filtered samples were analyzed for DRP using the automated ascorbic acid method on a Skalar San Plus Wet Chemi- stry Autoanalyzer (Skalar, the Netherlands) [20]. The total P (TP) concentration of unfiltered samples was de- termined after digestion via an alkaline persulphate method [21 ,22]. A 2 L sample of total-sediment was collected from a 0- to 3-cm depth at five locations across each transect with a spade and composited to create a representative sample. Samples from the transect were sieved to size classes of > 75, 75 to 20, 20 to 2, and < 2-mm within 24 h after sampling. A < 2-mm sample of sediment was col- lected at 5 locations along each transect and composited for subsequent particle size analysis and a sub-sample air dried prior to determination of Mehlich-3 extractable C opyright © 2011 SciRes. JEP  Physic oc hemical Characterization of Sediment in Northwest Arkansas Streams631 nutrients. Each size fraction of sediment was air dried. After drying, size classes were measured using a standard water displacement procedure, where water (6 L) was added to a container and the volume of water displaced measured when each size class was added. Total displa- cement of all size classes was determined along each transect and each size class divided by this total to deter- mine relative proportion of each size class within the stream transect. Particle-size distribution of the fine-fraction sediment (< 2-mm) was determined by the hydrometer method [23]. Sediments were added at 50 g dry weight to a 1 L cylin- der with 50 mL of sodium hexametaphosphate and brought to volume. Three hydrometer readings were taken and averag ed at the 40 s mark, and one 2 h reading was taken. These reading were then used to calculate the relative proportion of sand (2 - 0.05-mm), silt (0.05 - 0.002-mm), and clay (< 0.002-mm) at each transect within each stream. Mehlich-3 extractable P of the fine-fraction was determined by shaking 1 g air-dried sediment with 10 mL mixture of 0.2 M CH3COOH, 0.25 M NH4NO3, 0.015 M NH4F, 0.013 M HNO3, and 0.001 M EDTA end-over-end for 5 min [8]. Mehlich-3 extracts were centrifuged (2 500 g for 10 min) and filtered (0.45 µm) prior to determining P, Fe, Mg, Mn, and Ca [8]. De- termination of the mini- mum sample number necessary to describe Mehlich-3 P and PSRmod within the sample stream reaches were determined based on individual transect determination of Mehlich-3 P and PSRmod from the August, 2008 sample date. To investigate the relationship between PSRmod and DRP concentrations in stream water, a composite fine sized sediment (< 2-mm) sample from the previously identified transects and water column samples for DRP were conducted three additional times (February, May, and June 2009). As stream sediments had been charac- terized by the initial August, 2008 sampling, the rela- tionship between fine-sized sediment chemical properties across sampling dates was determined on a single com- posite sample from each stream in August, 2008, Febr- uary, May, and June 2009. 2.3. Modified Phosphorus Saturation Ratio Mehlich-3 P has been used as an indicator to estimate the potential for soil P release to runoff [24,25]. In Sims et al. [26], P saturation ratio (PSR) was determined from Me- hilich-3 extractable elements as PSR = [M3P / M3Al + M3 Fe]. This ratio includes P-reactive trace elements and improves upon the relationship between soil test P mea- sures and subsequent DRP concentrations of surface run- off, as increases in these trace elements decrease the movement of P into the water column [26]. For calcare- ous soils, inclusion of M3Ca and M3Mg improved the relationship between PSR and runoff DRP [27]. Haggard et al. [9] modified the P saturation ratio (PSRmod) to [M3P / M3Fe + M3Mg + M3Mn] for calcareous str eams. Modified P saturation ratio was found to be statistically more closely correlated to in-stream DRP concentrations (r = 0.71) than M3P alone (r = 0.50) in Haggard et al. [9]. As only a limited sampling p eriod was used to determine PSRmod [9], the current research will further investigate the effectiveness of the parameter in predicting DRP concentrations in stream water at different times and lo- cations. 2.4. Statistical Analysis Linear regressions were performed in SigmaPlot with significance levels of α < 0.05. Regressions of large- sized sediment and DRP are constructed from compo- sited sediment values at individual streams and sampled DRP concentrations from the August, 2008 sampling date. Composited fine-sized sediment samples from four sample dates (August 2008, February, May, and June 2009) are used for the regressions focusing on the fine- sized sediment chemical parameters of Mehlich-3 P and PSRmod. Relationship strength between parameters within the text is discussed in terms of correlation coefficients (r). When regression models are presented in figures co- efficients of determination (R2) are reported. To determine if differences in sediment distribution existed among streams, a one-way analysis of variance (ANOVA) was performed in SAS 9.2. Transects of the August, 2008 sampling date were used as replicates and streams treated as fixed factors and the four size classes and three < 2-mm size classes tested separately. When stream effect was significant, means were separated us- ing Fisher’s protected least significant difference (LSD). Differences in sample number (n) for this analysis are based on the number of equally spaced transects mea- sured at individual sites. For the samples collected in August, 2008 at individ- ual transects, M3P and PSRmod were tested in a multiple step procedure to determine the minimum number of samples necessary to quantify M3P and PSRmod. The procedure for this analysis was conducted as follows, first the sample means were calculated from the entire set of sampled transects at each site and treated as the “true” mean. Given the restriction of end samples always being taken for each possible sample size, a complete enumera- tion of all possible samples for a given size (e.g., sample size 5) were generated, and 95% confidence intervals (C.I.) were constructed using a standard T-statistic. The number and percentage of samples in which the confi- dence interval contained the “true” mean was calculated. The smallest sample size for which the percentage of samples within the 95 % confidence in terval was equal to Copyright © 2011 SciRes. JEP 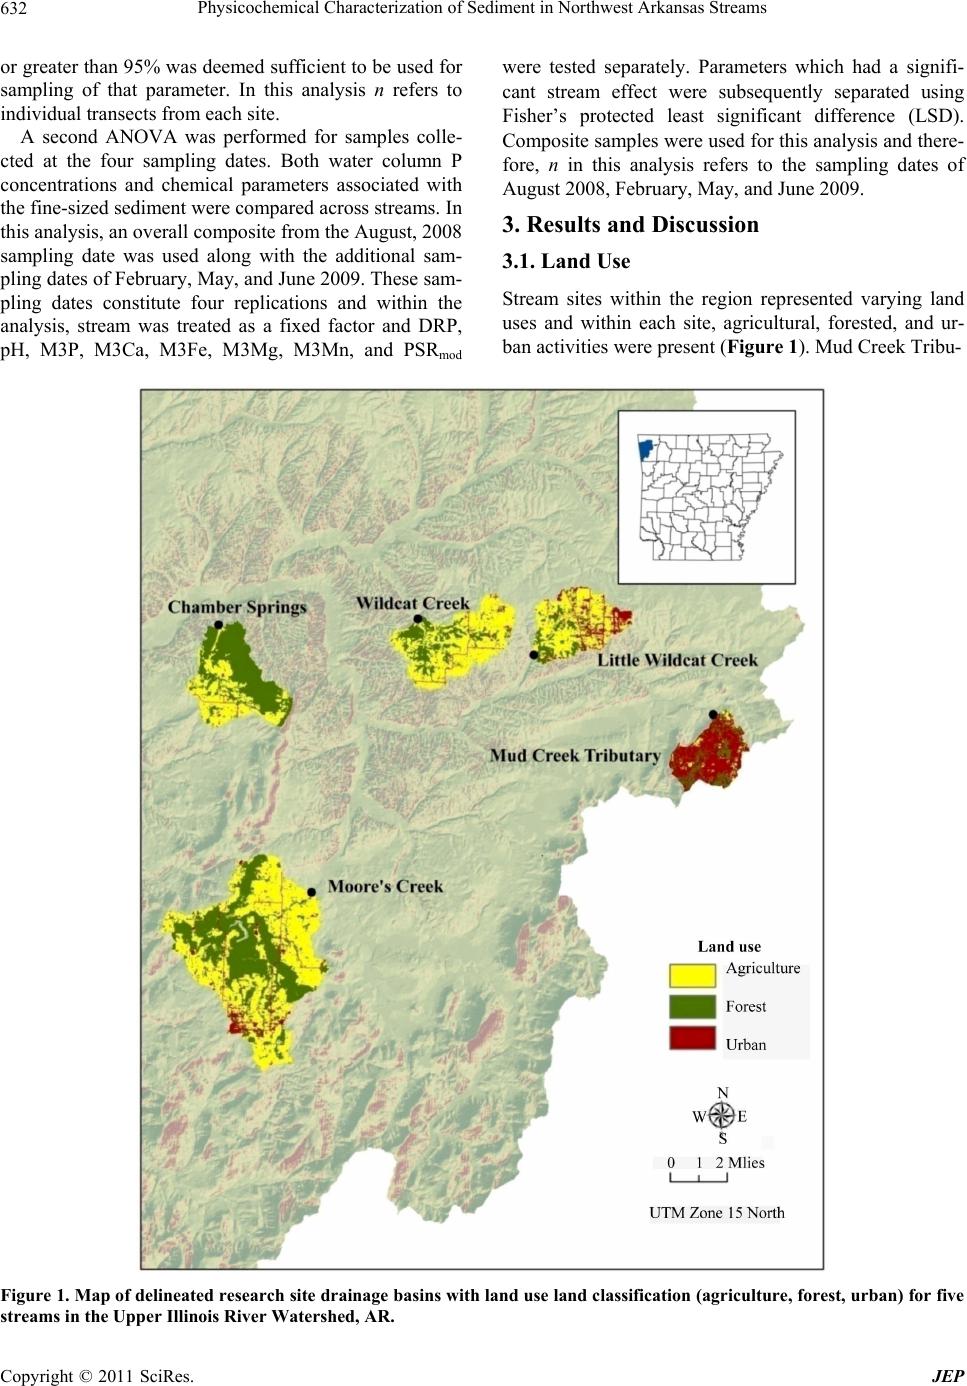 Physic oc hemical Characterization of Sediment in Northwest Arkansas Streams Copyright © 2011 SciRes. JEP 632 or greater than 95% was deemed sufficient to be used for sampling of that parameter. In this analysis n refers to individual transects from each site. were tested separately. Parameters which had a signifi- cant stream effect were subsequently separated using Fisher’s protected least significant difference (LSD). Composite samples were used for this analysis an d there- fore, n in this analysis refers to the sampling dates of August 2008, February, May, and June 2009. A second ANOVA was performed for samples colle- cted at the four sampling dates. Both water column P concentrations and chemical parameters associated with the fine-sized sediment were compared across streams. In this analysis, an overall composite from the August, 2008 sampling date was used along with the additional sam- pling dates of February, May, and June 2009. These sam- pling dates constitute four replications and within the analysis, stream was treated as a fixed factor and DRP, pH, M3P, M3Ca, M3Fe, M3Mg, M3Mn, and PSRmod 3. Results and Discussion 3.1. Land Use Stream sites within the region represented varying land uses and within each site, agricultural, forested, and ur- ban activities were present (Figure 1). Mud Creek Tribu- Figure 1. Map of delineated research site drainage basins with land use land classification (agriculture, for est, urban) for five streams in the Upper Illinois River Watershed, AR.  Physic oc hemical Characterization of Sediment in Northwest Arkansas Streams633 tary had the most urbanized subwatershed of those stud- ied with 68% of the drainage area dominated by this land use and only 7% composed of agricultural land (Table 1). In contrast, Wildcat Creek was nearly 70% agriculture and 4% urban. Chamber Springs with 61% forest was the only primarily forested landscape; however, the water- shed is also comprised of 38% agriculture much of which is directly adjacent to the stream (Table 1). Finally, Moore’s Creek was comprised mainly of agriculture and forested land with 56% and 39% of the total land area in the land uses respectively. 3.2. Stream Flow and Velocity (August, 2008) Average stream velocity at the time of stream characte- rization (August, 2008) w as variable across sites, ranging from 0.06 to 0.26 m·s–1 (Table 2). Decreased sediment/ water interaction time in higher velocity streams has been cited as decreasing P uptake in streams, and since these streams were all at baseflow conditions it appears likely P retention time within streams will be i mpacted by ve lo- city and that faster moving streams will have less time to interact with transient P [28]. The current study had slightly higher velocities overall than those reported by D’Angelo et al. [28] from North Carolina streams (0.04 - 0.17 m·s–1). As all subsequent sampling times (February, May, and June 2009) were conducted during baseflow conditions, it is likely that sediment water interactions Table 1. Percentage of watershed in agriculture, forest, and urban land use categories for five selected streams in the Upper Illinois River Watershed, AR. Stream Urban (%)Agriculture (%) Forest (%) Chamber Springs 1 38 61* Little Wildcat Creek 19 61 20 Mud Creek Tributary 68 7 25 Moore’s Creek 6 56 39 Wildcat Creek 4 70 26 *Percentages in italics represent the major land use with a give stream wa- tershed. Table 2. Water column parameters including Dissolved Reactive P (DRP) and Total P (TP) concentrations for five selected streams in the Upper Illinois River Watershed, AR in August, 2008. Stream Velocity (m3·s–1) Flow rate (m3·s–1) Chamber Springs 0.20 0.08 Little Wildcat 0.26 0.16 Moore’s Creek 0.12 0.20 Mud Creek Tributary 0.06 0.02 Wildcat Creek 0.20 0.19 in these streams are decreased even more during high velocity events such as during high rainfall, and nutrient transport to overlyin g waterbodies and that P transport is elevated at those times. Flow rates also varied across streams and ranged from 0.02 to 0.20 m3·s–1 (Table 2). Thus, varying transient storage times across sites occurred, which may lead to differences in P uptake due to water-sediment residence time differences. For example, Mud Creek Tributary is likely to have flashy events where water levels rise rap- idly due to the high percentage of urban land within the watershed and thus, during these events markedly de- creased interaction with stream bed sediment is likely to occur. 3.3. Sediment Distributions (August, 2008) The relative size distribution of total sediment classes was determined in August, 2008 and was similar across sites with no statistical differences to report. Based on volumetric displacement, the > 20-mm sized sediment accounted for roughly 50% of bed sediment across all sites (Table 3). Gainswin et al. [7] reported chlorophyll- a concentrations of 2- to 20-mm size fraction sediment at two sampled sites in the United Kingdom (6.4 and 8.6 mg·m-2, respectively) was appreciably lower than >20- mm sediment (22.8 and 62.7 mg·m–2, respectively). Sedi- ment of 2- to 20-mm cholorophyll-concentrations were more similar to fine sediments, which had chlorophyll- concentrations of 3.0 and 2.3 mg·m–2, respectively [7]. The intersection of these size classes likely represents an important transition from abiotic to biotic dominance of P reactions and transformations. Thus, bed sediments of streams in the UIRW represent a system in which there are large portions of sediment where P reactions are pre- dominately biolog ically driven (> 20-mm) and large por- tions which are abio tically driven (< 20-mm). Further separating the size classes, the >75-mm sedi- ments comprised the lowest percentage across sites, ranging from 0.3% to 10.8% of bed sediment (Table 3). The < 2-mm sediments were the second lowest, ranging from 9% to 18% of streambed composition. However, < 2-mm sediments are likely to have the largest surface area per unit weight of any sediment size class and thus, greatest chemical reactivity. The 75- to 20-mm and 20- to 2-mm classes represented roughly 80 to 90% of the total bed material across sites and ranged from 35 to 48 and 36% to 46% of fluvial sediment, respectively. No significant differences between streams for any size class was observed; p-values ranged from 0.188 (20 to 2 mm) to 0.534 (< 2 mm), thus, means were not separated by Fisher’s Prote cted LSD (Table 3). At the time of sampling, in-stream concentrations of DRP decreased as the percentage of > 75-mm sediment Copyright © 2011 SciRes. JEP  Physic oc hemical Characterization of Sediment in Northwest Arkansas Streams 634 Table 3. Sediment size classifications and < 2-mm particle size analysis for five selected streams in the Upper Illinois River Watershed, AR in August, 2008. Total Sediment (mm) < 2-mm particle size Stream n > 75 75-20 20-2 < 2 Sand Silt Clay % % Chamber Springs 9 5.7 45.5 36.6 12.2 85.5b* 9.2a 5.3 Little Wildcat Creek 8 10.8 40.4 40.3 8.6 92.0ab 5.6ab 2.4 Moore’s Creek 9 0.3 35.0 46.2 17.9 90.9ab 3.8b 5.3 Mud Creek Tributary 10 12.2 40.4 36.2 11.2 94.8a 3.1b 2.1 Wildcat Creek 9 7.4 48.7 35.7 14.3 84.7b 9.8a 5.4 Standard Error (n = 10) 3.4 4.1 3.3 3.9 2.5 1.4 1.2 Standard Error (n = 9) 3.6 4.3 3.5 3.9 2.6 1.5 1.3 Standard Error (n = 8) 3.8 4.6 3.7 4.1 2.8 1.6 1.3 p-value 0.200** 0.220 0.188 0.534 0.048 0.008 0.145 increased (Figure 2). Total P concentrations also de- creased when the percentage of > 75-mm sediment in- creased (Figure 2). This is likely related to associated periphyton growth on large sediments (> 20-mm) acting as sinks of P during growth and uptake. However, upon death and decomposition, algal biomass can become a source of P to overlying waters [29]. 3.4 Fine-Fraction Sediment (August, 2008) The percentage of < 2-mm sized sediment was greatest at Moore’s Creek and represented 18% of the total bed sub- strate whereas, Little Wildcat Creek had the least fine-sized sediment at 9%. Across streams, there was no significant stream effect (p = 0.534) on the mean < 2-mm percentage (Table 3). However, significant differences were appar- ent in the < 2-mm size class fractions (sand, silt, clay). Sand (0.05- to 2-mm) was the most predominant fraction of < 2-mm sediment, comprising over 80% of the fine sediment at each site (Table 3 ). Differences in the size of the sand fraction existed among streams, with Mud Creek Tributary having a significantly greater mean sand con- tent than either Chamber Springs or Wildcat Creek (Ta- ble 3). This fraction is often linked to highly available P-fractions which are less tightly sorbed than on clay-sized fractions, and thus, Mud Creek Tributary likely has less P binding capacity during high input events than Wildcat Creek or C hamber Springs. The silt-sized fraction was also variable within sites and across streams. Both Wildcat Creek and Chamber Springs had a statistically greater mean silt-sized fraction than Mud Creek Tributary (Table 3). The clay-fraction was not statistically different among streams (p = 0.145), but within sites ranged from 2.1% to 5.4% (Table 3). While clay-fractions typically can hold the most P, this is also contingent on the extent and duration of P inputs to Figure 2. Relationship between Dissolved Reactive P con- centration (DRP) Total P (TP) and average percent > 75-mm sediment at five streams in the Upper Illinois River Watershed, AR. C opyright © 2011 SciRes. JEP  Physic oc hemical Characterization of Sediment in Northwest Arkansas Streams635 the stream. Similar to results from McDowell and Shar- pley [30], our site with the greatest percentage of land area as forest (Chamber Springs) had relatively high clay content (5.3%) (Table 3) and the lowest M3P concentra- tion, true mean, (Table 4) compared to the other sites. This is likely due to a lack of P inputs to forested areas and subsequent P runoff to the stream. Also, P held by sand-sized particles is generally less tightly sorbed than to clay-sized particles and is more easily released to wa- ter [6]. While percent sand was statistically different among sites, its general predominance (84.7% - 94.8 %), and the fact that the mean clay content across sites was statistically similar led to the lack of statistically signifi- cant correlations between < 2-mm fractions and P con- centrations. While the relative distribution of size classes in streams plays a role in in-stream P transport, it appears that the concentration of nutrients transported to the stream and sorbed by fine-sized sediment can be quite variable even in streams with similar stream bed compo- sitions. This is likely due to the continued replenishment of fine-sized sediment from the landscape in turn acting as a renewal mechanism for P within these stream sites. For example, Mud Creek Tributary, which drains a highly urbanized area, experiences rapid influxes of wa- ter during storm events, thus, sediments may be more rapidly transported within th is stream than those draining dominantly agricultural or forested areas. Subsequently, these large loads can continually replenish its sand-sized fraction (95%) and the remainder of the < 2-mm size fraction of bed sediment with eroded soil [31]. In con- trast, Moore’s Creek a predominately agricultural and forested site is likely less influenced by rapid changes in velocity and thus, water column sediment interactions are a more dominant force, particularly as M3P concentra- tions within this stream are higher than any other stream sampled (Table 4). 3.5 Minimum Sample Number (August, 2008) Previous work in the region focusing on P in fluvial sediments, has sampled three transects within a stream reach [9]. The current study collected 8 to 10 transect sediment samples from each stream reach (Table 4). The study reach lengths and total sample number were vari- able across streams (26 - 69 m), because of differences in accessibility and geomorphology. Thus, if we assume the more rigorous sampling protocol of the current study precisely characterized Mehlich-3 extractable nutrient concentrations of the benthic sediments using these mul- tiple transects then we could evaluate the minimum number of transects needed to characterize M3P. Based on the five sampled streams, the minimum number of transects needed for 95% coverage of the 95% confi- dence interval of the “true” mean of M3P at the sites sampled was generally three (Table 4). The exception was at Wildcat Creek where 4 samples were needed. For PSRmod the trend was similar except Wildcat Creek re- quired 5 samples to cover the confidence interval. The issue at Wildcat Creek is that the site had a larger amount of variation within as illustrated by the large standard errors (Table 4). Thus, when sites are sampled, careful attention to the insite variability is likely a clue as to whether a set of 3 samples is sufficient to adequately describe the sampled stream reach, and if large variation exist a larger sample number would be recommended. 3.6. Mehlich-3 Content of Fluvial Sediments (August 2008, February, May, and June 2009) The Mehlich-3 P concentrations of < 2-mm sediments ranged from 13 to 39 mg·P·kg–1 (Table 5). It appears that sediment M3P was highly correlated to DRP (r = 0.86), with increased streambed M3P content lead ing to greater stream DRP concentrations (Figure 3). This relationship is stronger than previously reported for this region by Haggard et al. [9; r = 0.50], but with a similar slope (0.0016 compared to the prior 0.0022). However, as our relationship between M3P and stream DRP is driven by one high-P site (Moore’s Creek), we further investigated PSRmod as a more accurate parameter for correlating Table 4. Stream length and mi nimum number of samples needed to represent reach sediment Mehlich-3 P (M3P) and Modi- fied P Saturation Ratio (PSRmod). Mehlich-3 P PSRmod Stream n Reach Length “True Mean” Standard Error Mean Sample Size for 95% C.I. “True Mean” Standard Error Mean Sample Size for 95% C.I. m mg·P·kg–1 Sample number % Sample number Chamber Springs 9 45 11.5 1.32 3 5.1 0.44 3 Little Wildcat Creek 8 26 16.9 1.93 3 5.0 0.43 3 Moore’s Creek 9 41 37.0 1.96 3 7.9 0.35 3 Mud Creek Tributary 10 69 13.7 1.59 3 3.3 0.36 3 Wildcat Creek 9 38 15.6 2.17 4 4.0 0.66 5 Copyright © 2011 SciRes. JEP  Physic oc hemical Characterization of Sediment in Northwest Arkansas Streams 636 Table 5. Mehlich-3 nutrients, Modified P Saturation Ratio (PSRmod), and pH of sediments from five selected streams in the Upper Illinois River Watershed, AR from sampling dates in August 2008, February, May, and June 2009. Stream n DRP pH M3P M3Ca M3Fe PSRmod mg·P·L–1 mg·P·kg–1 % Chamber Springs 4 0.410b* 7.5b 13c 1221c 156b 4.7b Little Wildcat Creek 4 0.029cd 7.7ab 15bc 825d 124b 4.8b Moore’s Creek 4 0.074a 7.4b 39a 730d 358a 7.8a Mud Creek Tributar y 4 0.021d 8.1a 13c 1878b 165b 2.7c Wildcat Creek 4 0.035bc 8.1a 19b 2805a 162b 4.6b Standard Error 0.004 0.2 2 113 17 0.4 p-value < 0.0001 0.02 < 0.0001 < 0.0001 < 0.0001 < 0.0001 Figure 3. Relationship between average Mehlich-3 P (M3P) and Dissolved Reactive P concentrations (DRP) for five streams in the Upper Illinois River Watershed, AR. streambed chemical characteristics to overlying water column DRP concentrations. Because sediment P avail- ability is influenced by P-sorbing elements and the rela- tionship between M3P and DRP concentrations is prob- lematic due to the influence of Moore’s Creek, PSRmod was utilized. Calculated PSRmod ranged from 3% to 7.8% across sites and may be a better indicator of P availability as it considers Fe, Mg, and Mn concentrations, which influ- ence P sorption and regulate P availability to the water column (Table 5). Across sites, PSRmod for Moore’s Creek sediment was the highest at 7.8 % and statistically different from the remaining sites. Mud Creek Tributary sediment was the lowest PSRmod (2.7 %) and was statis- tically different from the other sites. Chamber Springs, Little Wildcat Creek, and Wildcat Creek sediments have similar PSRmod values (Table 4). When analyzed across sampling dates, Modified P saturation ratio was highly correlated to stream DRP concentrations (r =0.86) with a slope of 0.0096 (Figure 4). The slope of the PSRmod and stream DRP relationship in this study is approximately two times that (0.004) found by Haggard et al., [9], indi- cating DRP concentrations in some streams may be con- trolled by fine-sized sediment nutrient concentrations and may thus, have a greater impact on stream DRP concen- Figure 4. Relationship between Modified P Satur ation Ratio (PSRmod) of sediments and Dissolved Reactive P concentra- tions (DRP) for five streams in the Upper Illinois River Watershed, AR. trations. Based on the work of Lottig and Stanley [6] and our results, it is probable that PSRmod decreases with increas- ing amounts of larger-sized sediments and may be repre- sentative of a shift in the buffering mechanisms from abiotic to biotic control. Thus, in terms of P transforma- tions between stream sediments and the water column, it is important to consider the concentrations of trace ele- ments as well as P. Differences in P-chemistry across streams is likely due to other factors than simple sedi- ment particle size distribution, as they are comparable in their relative percentages (Tab l e 3 ). Other factors such as P input source, biological uptake, clay mineralogy, sedi- ment P concentrations, differences in < 2-mm sediment and P inputs to the stream from the landscape will be important in determining P transformations and transport in these streams. 4. Conclusions It is apparent that many variables contribute to determin- ing the DRP concentration of stream water at any point in time. Across streams large-sized sediments (> 20-mm) were highly correlated to DRP and TP concentrations, because attached algae can act as temporary P storage mechanisms. As our sampled sites have a large portion of C opyright © 2011 SciRes. JEP  Physic oc hemical Characterization of Sediment in Northwest Arkansas Streams637 the substrate composed of larger-size fractions, biofilm growth is likely a key regulator of DRP concentration. Further research concerning biological uptake in these streams is warranted to encompass all mechanisms which may be of importance to P transport within these water- sheds. Fine-sized sediment characteristics within streams were relatively similar with sand predominating at all sites; however, differences were apparent in the M3P concentration of specific streams. Thus, simple substrate composition determination of fine-sized sediments does not implicitly determine the concentration or controls P in stream sediments. Three transects appear sufficient (in most instances) as a sampling strategy adequate to meas- ure mean M3P and PSRmod content of fine-sized sedi- ments in Northwest Arkansas streams and those with similar characteristics. However, if large variations in M3P and PSRmod exist, it is likely more samples are needed to determine M3P and PSRmod. Modified P Satu- ration Ratio was recently described by Haggard et al. [9] as predictor of DRP concentrations in stream water. The current research was conducted at different locations and times than the earlier work and found strong correlation between PSRmod and stream DRP concentrations and thus, enhances the utility of PSRmod for varying times and lo- cations. Further, investigations focusing on PSRmod will enhance the understanding of its adaptability to other sites and locations. Sediment is important in regulating water column P and thus, in determining P transport to lakes and reservoirs of the region. These findings in streams of the UIRW provided an exceptional area to investigate nutrient enrich ment in a region in which both urban and agricultural sources operate alongside one an- other. These findings can be expanded to streams with similar physicochemical compositions, particularly in regions where nutrient enrichment from agricultural sources such as CAFOs are of importance. 5. Acknowledgments The authors wish to give special thanks to Jason Corral, Tony Zambrano, Stephanie Williamson, Josh Romeis, and Tarra Simmons for assistance in field collection and lab analysis. Also, thanks to Dr. Edward Gbur of the University of Arkansas Agricultural Statistics Laboratory for his help in experiment design and data analysis. Funding was provided by the Arkansas Water Resources Center through a USGS 104-B grant. REFERENCES [1] United States Environmental Protection Agency, “Envi- ronmental indicators of water quality in the United States,” 1996, EPA 841-R-96-002. [2] R. Howarth and H. Paerl, “Coastal Marine Eutrophication: Control of both nitrogen and phosphorus is necessary,” Proceedings of the National Academy of Sciences of the United States of America, Vol. 105, No. 49, 2008, p. E103. doi:10.1073/pnas.0807266106 [3] D. Schindler, R. Hecky, D. Findlay, M. Stainton, B. Parker, M. Patterson, K. Beaty, M. Lyng and S. Kasian, “Eutrophication of lakes cannot be controlled by reducing nitrogen inputs: Results of a 37-year whole-ecosystem experiment,” Proceedings of the National Academy of Sciences of the United States of America, Vol. 105, No. 32, 2008, pp. 11254-11258. doi:10.1073/pnas.0805108105 [4] W. Dodds, “Trophic state, eutrophication and nutrient criteria in streams,” Trends in Ecology & Evolution, Vol. 22, No. 12, 2007, pp. 669-676. doi:10.1016/j.tree.2007.07.010 [5] R. McDowell, A. Sharpley and A. Chalmers, “Land use and flow regime effects on phosphorus chemical dynam- ics in the fluvial sediment of the Winooski River, Ver- mont,” Ecological Engineering, Vol. 18, No. 4, 2002, pp. 477-487. doi:10.1016/S0925-8574(01)00108-2 [6] R. Lottig and E. Stanley, “Benthic sediment influence on dissolved phosphorus concentrations in a headwater stream,” Biogeochemistry, Vol. 84, No. 3, 2007, p p. 297-309 . doi:10.1007/s10533-007-9116-0 [7] B. Gainswin, W. House, B. Leadbeater, P. Armitage and J. Patten, “The effects of sediment size fraction and associ- ated algal biofilm on the kinetics of phosphorus release,” Sciences of the Total Environment, Vol. 360, No. 1-3, 2006, pp. 142-157. doi:10.1016/j.scitotenv.2005.08.034 [8] A. Mehlich, “Mehlich-3 soil test extractant: A modifica- tion of Mehlich 2 extractant,” Communications in Soil Science and Plant Analysis, Vol. 15, No. 12, 1984, pp. 1409-1416. doi:10.1080/00103628409367568 [9] B. Haggard, D. Smith and K. Brye, “Variations in stream water and sediment phosphorus among select Ozark catchments,” Journal of Environmental Quality, Vol. 36, No. 6, 2007, pp. 1725-1734. doi:10.2134/jeq2006.0517 [10] K. Brye and C. West, “Grassland management effects on soil surface properties in the Ozark Highlands,” Soil Scienc, Vol. 170, No. 1, 2005, pp. 63-73. doi:10.1097/00010694-200501000-00008 [11] G. Brion, K. Brye, B. Haggard , C. West and J. Brahanna, “Land-use effects on water quality of a first-order stream in the Ozark Highlands, Mid-Southern United States,” River Research and Applications. doi:10.1002/rra.1394 [12] T. Sauer, P. Moore, J. Ham, W. Bland, J. Prueger and C. West, “Seasonal water balance of an Ozark hillslope,” Agricultural Water Management, Vol. 55, No. 1, 2002, pp. 71-82. doi:10.1016/S0378-3774(01)00185-8 [13] A. Sharpley, S. Herron and T. Daniel, “Overcoming the challenges of phosphorus-based nutrient management in poultry farming,” Journal of Soil and Water Conservation, Vol. 62, No. 6, 2007, pp. 375-389. [14] N. Slaton, K. Brye, M. Daniels, T. Daniel, R. Norman and D. Miller, “Nutrient input and removal trends for agricul- tural soils in nine geographic regions in Arkansas,” Journal of Environmental Quality, Vol. 33, No. 5, 2004, Copyright © 2011 SciRes. JEP  Physic oc hemical Characterization of Sediment in Northwest Arkansas Streams Copyright © 2011 SciRes. JEP 638 pp. 1606-1615. doi:10.2134/jeq2004.1606 [15] S. Ekka, B. Haggard, M. Matlock and I. Chaubey, “Dis- solved phosphorus concentrations and sediment interac- tions in effluent-dominated Ozark streams,” Ecological Engineering, Vol. 26, No. 4, 2006, pp. 375-391. doi:10.1016/j.ecoleng.2006.01.002 [16] R. Maguire, G. Rubaek, B. Haggard and B. Foy, “Critical evaluation of mitigation of options for phosphorus from field to catchment,” Journal of Environmental Quality, Vol. 38, No. 5, 2009, pp. 1989-1997. doi:10.2134/jeq2007.0659 [17] Center for Advanced Spatial Technology (CAST), “Ar- kansas Land Use and Land Cover,” 2006. http://www.geostor.arkansas.gov/G6/Home.html [18] Environmental Systems Research Institute, “ArcGIS 9.2,” Redlands, 2006. [19] Arkansas State Land Information Board (ASLIB), “2006 5-Meter Resolution Digital Elevation Model,” 2007, http://www.geostor.arkansas.gov/G6/Home.html [20] American Public Health Association (APHA), “Standard Methods for the Examination of Water and Wastewater,” 20th Edition, Washington, DC, 1998. [21] M. Hosomi and R. Sudo, “Simultaneous determination of total nitrogen and total phosphorus in freshwater samples using persulphate digestion,” International Journal of Environmental Studies, Vol. 27, No. 3-4, 1986, pp. 267-275. doi:10.1080/00207238608710296 [22] D. Lamber and W. Maher, “An evaluation of the effi- ciency of the alkaline persulfate digestion for the deter- mination of total phosphorus in turbid waters,” Water Research, Vol. 1, No. 1, 1995, pp. 7-9. doi:10.1016/0043-1354(94)00141-S [23] M. Arshad, B. Lowery a nd B. Grossman, “Physical Tests for Monitoring Soil Quality,” In: J. W. Doran and A. J. Jones, Eds., Methods for Assessing Soil Quality. Soil Sci- ence Society of America, Madison, 1996, pp. 123-141. [24] A. Sharpley, T. Daniel, J. Sims and D. Pote, “Determin- ing environmentally sound soil phosphorus levels,” Journal of Soil and Water Conservation, Vol. 51, No. 2, 1996, pp. 160-166. [25] P. Vadas, P. Kleinman and A. Sharpley, “Relating soil phosphorus to dissolved phosphorus in runoff: A single extraction coefficient for water quality modeling,” Jour- nal of Environmental Quality, Vol. 34, No. 2, 2005, pp. 572-580. doi:10.2134/jeq2005.0572 [26] J. Sims, R. Maguire, A. Leytem, K. Gartley and M. Paut- ler, “Evaluation of Mehlich-3 as an agri-environmental soil phosphorus test for mid-Atlantic United States of America,” Soil Science Society of America Journal, Vol. 66, No. 6, 2002, pp. 2016-2032. doi:10.2136/sssaj2002.2016 [27] D. Ige, O. Akinremi and D. Flaten, “Environmental index for estimating the risk of phosphorus loss in calcareous soils of Manitoba,” Journal of Environmental Quality, Vol. 34, No. 6, 2005, pp. 1944-1951. doi:10.2134/jeq2004.0468 [28] D. D’Angelo, J. Webster and E. Benfield, “Mechanisms of stream phosphorus retention: an experimental study,” Journal of the North American Benthological Society, Vol. 10, No. 3, 1991, pp. 225-237. doi:10.2307/1467596 [29] P. McCor mick, R. Shu ford and M. Ch imney, “Per iphyto n as a potential phosphorus sink in the Everglades Nutrient Removal Project,” Ecological Engineering, Vol. 27, No. 4, 2006, pp. 279-289. doi:10.1016/j.ecoleng.2006.05.018 [30] R. McDowell and A. Sharpley, “Uptake and release of phosphorus from overland flow in a stream environment,” Journal of Environmental Quality, Vol. 32, No. 3, 2003, pp. 937-948. doi:10.2134/jeq2003.0937 [31] A. Sharpley, S. Chapra, R. Wedepohl, J. Sims, T. Daniel and K. Reddy, “Managing agricultural phosphorus for protection of surface waters: issues and options,” Journal of Environmental Quality, Vol. 23, No. 3, 1994, pp. 437-451. doi:10.2134/jeq1994.00472425002300030006x
|