Black Carbon Instead of Particle Mass Concentration as an Indicator for the Traffic Related Particles 527
in the Brussels Capital Region
the different measuring sites in Brussels.
A second phenomenon, very important and still unde-
restimated is the formation of secondary aerosol, mainly
during the period March-April and to a lesser extent dur-
ing September-October. The spreading of manure on a
large scale, in the surrounding regions, before and after
the agricultural season, releases a massive source of am-
monia. At conditions of moderate temperature and high
relative humidity, together with the presence of NO2, a
stable secondary aerosol is formed with ammonium ni-
trate as a main component. During the month of April
2007 and again in April 2009 this formation caused be-
tween 8 and 16 exceeding days at the different measuring
sites in Brussels. Due to the same phenomenon the 2006
car free Sunday achieved the second highest daily value
of that year [3] and the car free Su nd ay of 2009 proved to
be one of the other surprising exceeding days. Numerous
studies, performed at different locations in Europe as
well as in the USA, emphasize the importance of secon-
dary aerosol and the inorganic and/or organic compo-
nents involved. This has also been reported more recently
by several research teams [4-8].
The third phenomenon, (re)suspension of the coarser
fraction (particles between 2.5 and 10 µm) is linked with
the advection of dry air, mainly coming from the large
eastern sector. Under these conditions and in the pres-
ence of a local source, particles of the coarser fraction are
suspended by the wind and/or by the turbulences created
by the traffic [2]. Due to the presence of local sources,
this phenomenon is more frequently encountered at the
two measuring sites where the limit value is systemati-
cally exceeded.
2.2. Car Free Sunday 2009—Black Carbon,
Particle Mass and Number Concentration
On Sunday the 20 th September 2009, for the eighth time,
a car free Sunday was organized by the Brussels authori-
ties. From 9:00 till 19:00 h local time (7:00 till 17:00 h
UT), all private road traffic was banned over the entire
Brussels Capital Region. Only public transport, emer-
gency services, taxis and a limited number of exceptions
were allowed and the speed limit was set at 30 km/hr.
During the morning the wind was mainly coming from
the south, just before noon suddenly it changed and
started blowing from north-northwest till late in the eve-
ning, importing polluted air masses with secondary
aerosol already formed over the western part of Belgium.
Meteorological conditions could be considered as rela-
tively unfavorable to pollution dispersion during the ear-
ly morning, but rather favorable in the late morning and
the afternoon. The boundary layer computed from
ECMWF fields, increased from 60 m in the morning to
950 m in the afternoon.
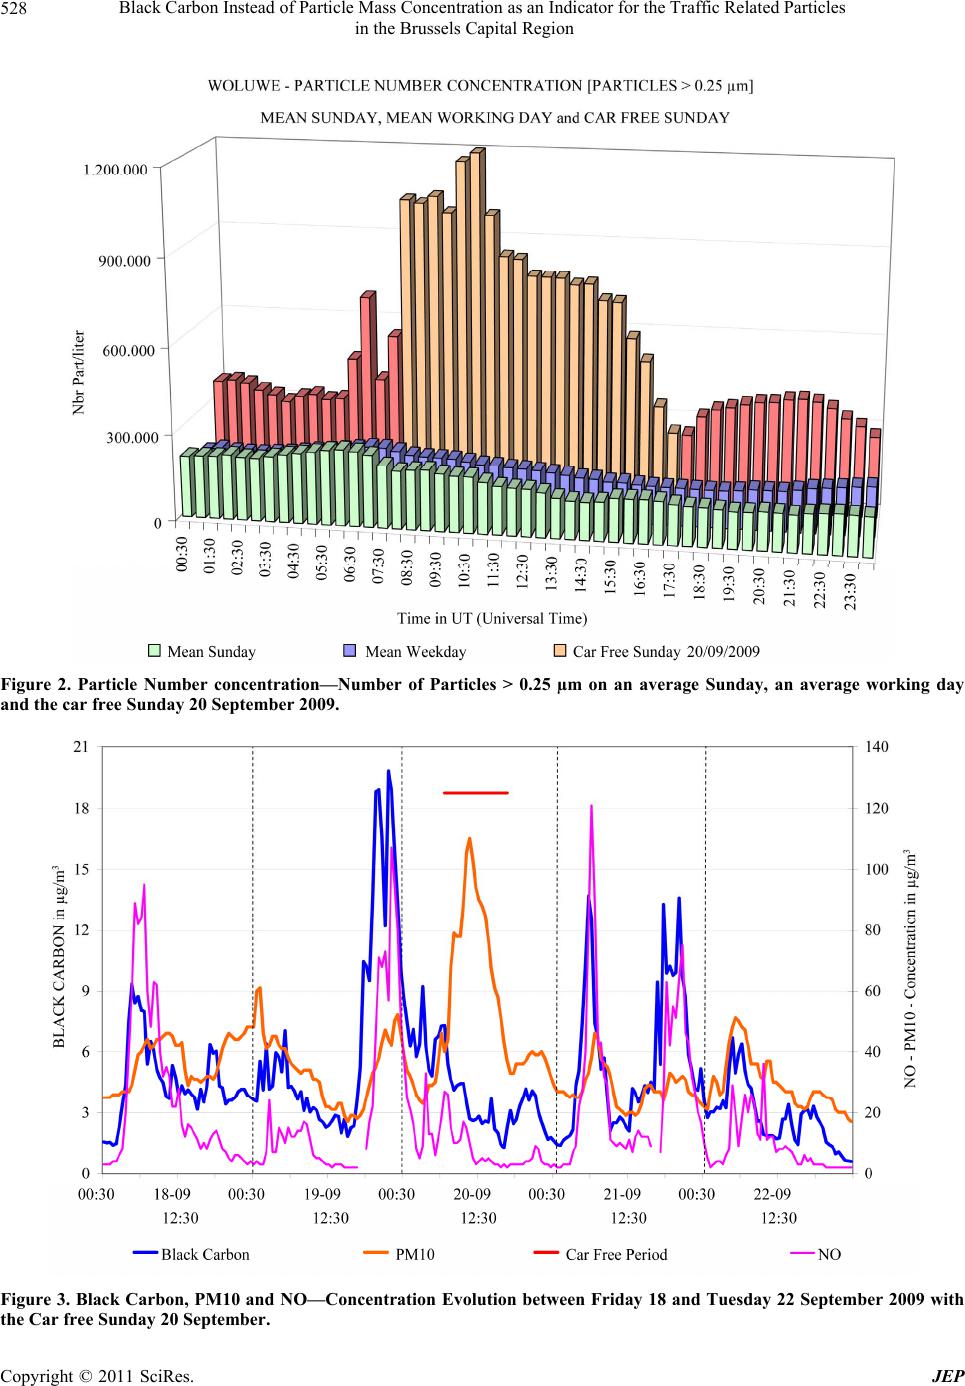
In the middle of the car free period a sharp and sudden
concentration increase of PM10 and PM2.5 mass con-
centrations was observed in all Brussels measuring sites,
with maximum h alf hourly PM10 concen trations ranging
between 100 an d 120 µg /m3 (>90% as PM2.5), leading to
average PM10 concentrations exceeding the 50 µg/m3
daily limit value. At the same time particle number con-
centrations increased for all size ranges between 0.25 and
2.5 µm, with a maximum of ±1.200 .000 p articles per liter
of air for the total number of particles above 0.25 µm
(Figure 2), reaching one of the highest half hourly values
(99.8the percentile) of the whole year 2009. However,
such an increase was not observed for the coarser frac-
tion, particles above 2.5 µm, mainly from mineral origin,
put into (re)suspension by the wind or by the turbulences
created by road traffic.
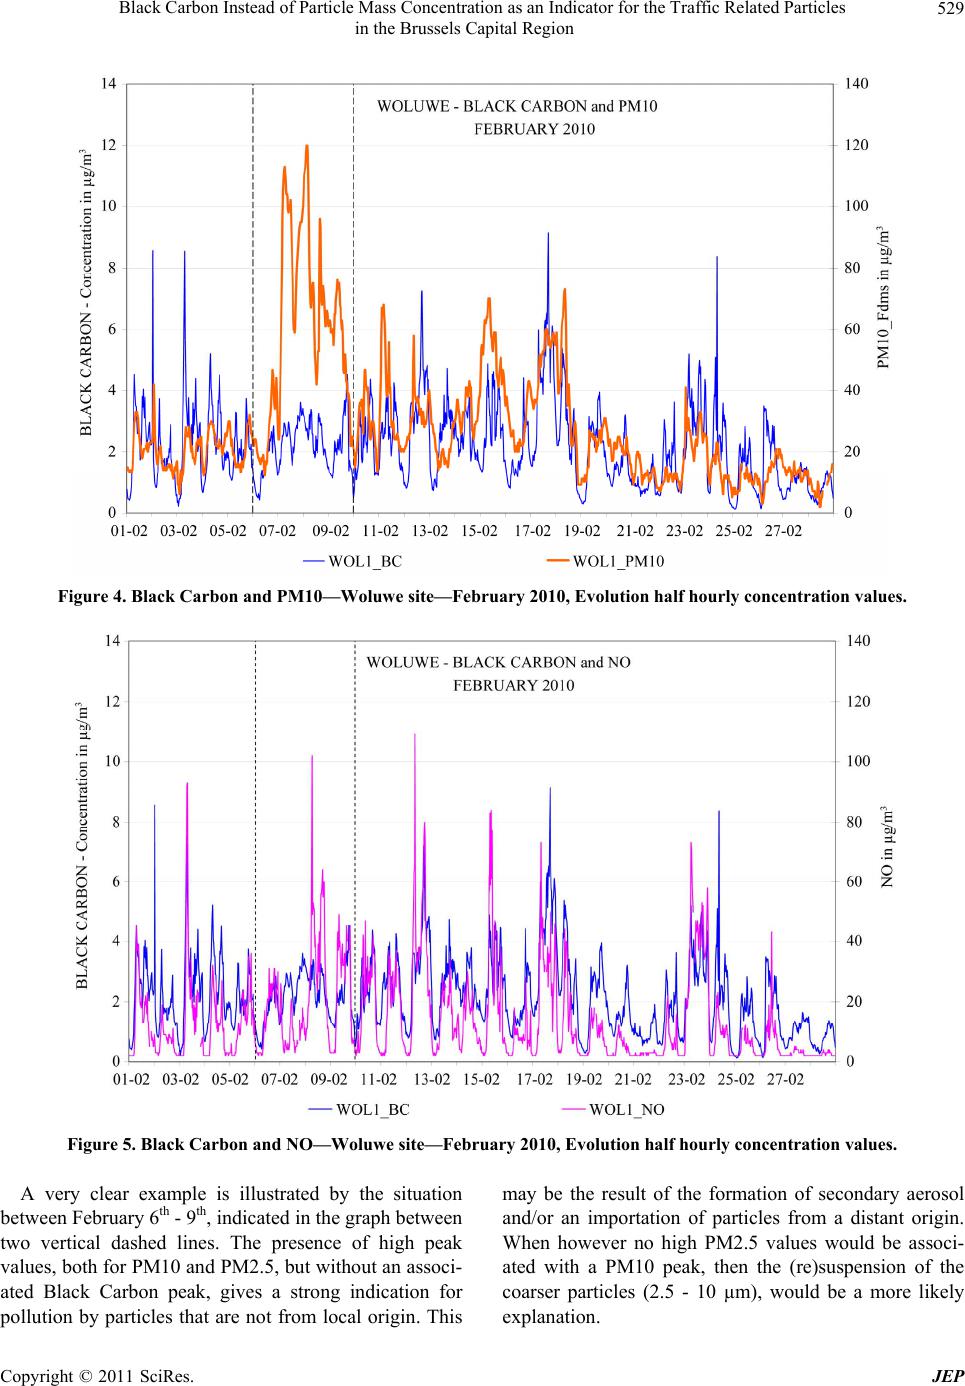
The graph in Figure 3 represents, for the period from
Friday the 18th till Tuesday 22 September 2009, the dy-
namic evolution of the half hourly values for Black Car-
bon, the PM10 mass concentration and NO at the Wolu-
we site. The data for Black Carbon refer to the concentra-
tion scale on the left (0 - 21 µg/m3) and those for PM10
and NO to the scale on the right (0 - 140 µg/m3). The
traffic ban hours during the car free Sunday are indicated
by the short horizontal line in the middle. During the
traffic ban hours the PM10 concentration peaks, while
the Black Carbon level continues to decrease, quite op-
posed to PM10. Clearly, the evolution of Black Carbon
does not always follow that for PM10 but rather that of
the traffic related NO, as can be seen from the results on
Saturday the 19th and during the morning and evening
rush hours of Monday 21st Septembe r.
2.3. Correlation between Black Carbon, NO,
NOX, PM Mass and Number Concentration
The observations made during the 2009 car free Sunday
stand also for longer periods. This is well illustrated by
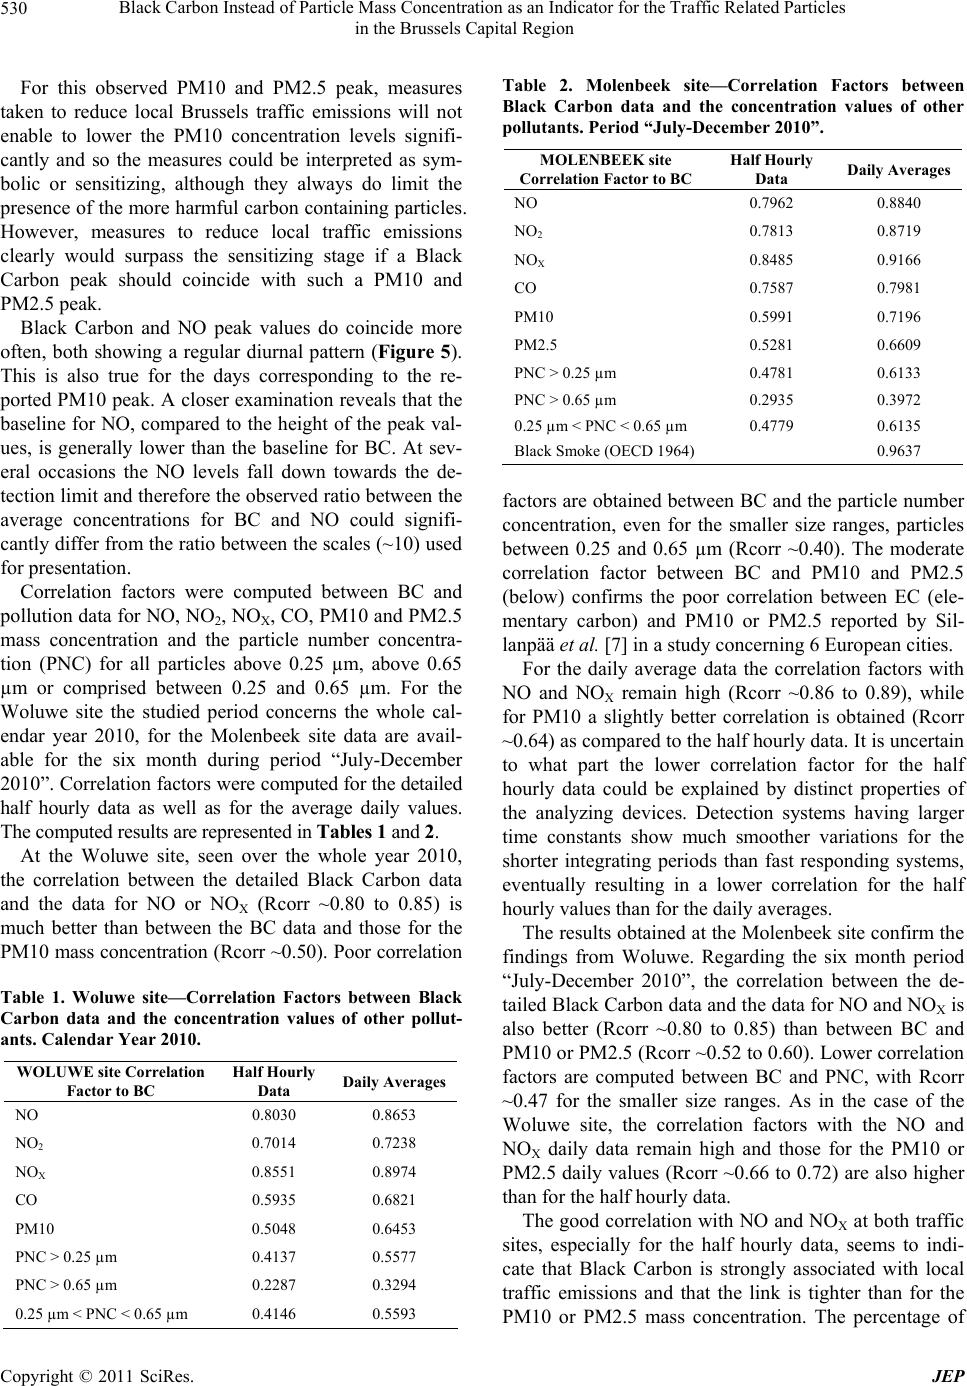
the evolution of the half hourly data for February 2010.
The graph in Figure 4 represents the data for Black Car-
bon and PM10 and the graph in Figure 5 those for BC
and NO. Data for BC refer to the left scale (0 - 14 µg/m3)
and those for PM10 and NO respectively to the scales on
the right (0 - 140 µg/m3).
On average and for most of the time, the BC and
PM10 concentrations follow nearly the same pattern
(Figure 4), meaning that there is roughly a factor 10,
corresponding to the scaling factor, between the concen-
tration levels. However, although many peak values do
coincide, there are several discrepancies during other
peak periods: high peak values for PM10 and not for BC
or vice versa.
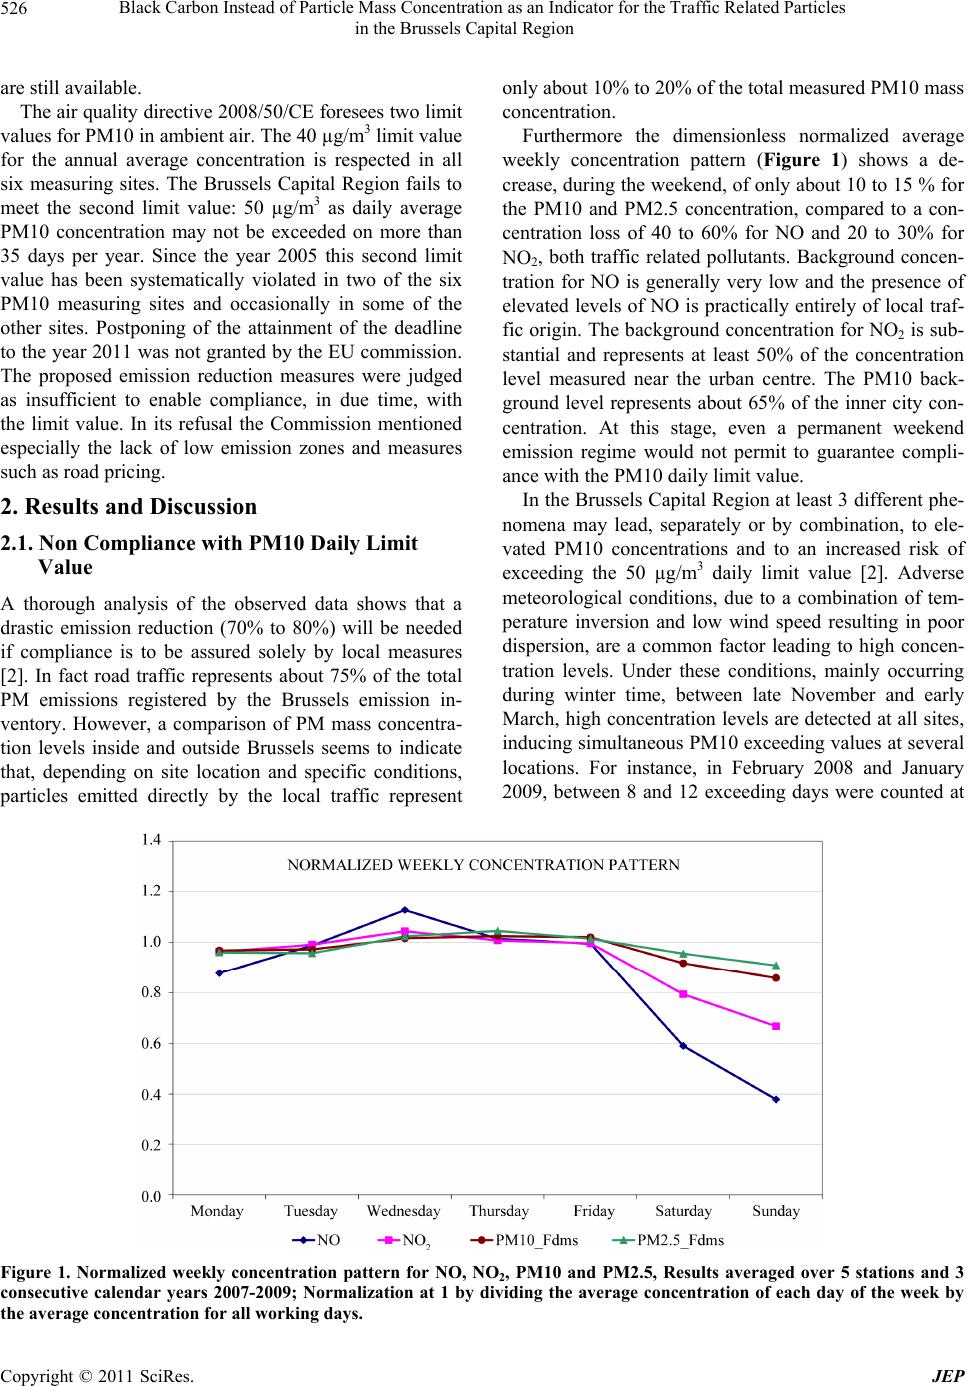
Copyright © 2011 SciRes. JEP