 America n Journal of Analy tic al Chemistry, 2011, 2, 344-351 doi:10.4236/ajac.2011.23042 Published Online July 2011 (http://www.scirp.org/journal/ajac) Copyright © 2011 SciRes. AJAC Use of Ultrasound Bath in the Extraction and Quantification of Ester-Linked Phenolic Acids in Tropical Forages Mellina Damasceno Rachid Santos1, Aline de Paula Vitor1, Jailton da Costa Carneiro2, Domingos Sávio Campos Paciullo2, Renato Camargo Matos1, Maria Auxiliadora Costa Matos1* 1NUPIS (Núcleo de Pesquisa em Instrumentação e Separação Analíticas), Departamento de Química, Instituto de Ciências Exatas, Universidade Federal de Juiz de Fora, Juiz de Fora, Brazil 2EMBRAPA—Centro Nacional de Pesquisa de Gado de Leite (CNPGL), Juiz de Fora, Brazil E-mail: maria.auxiliadora@ufjf.edu.br Received March 29, 2011; revised May 12, 2011; accepted May 20, 2011 Abstract A method was developed for the analysis of ester-linked phenolic acids in forage samples using extraction by an ultrasound-assisted treatment and quantification by HPLC with a UV -VIS detector. A reversed-phase C18 column was used for developing the method and the optimal condition was established with isocr atic eluti on using acetonitrile/methanol/H3PO4 pH 2.08 (13:12.5:74.5) as the mobile phase. To reduce the time of sample processing, the extraction of est er-linked phenolic acids was studied using ultrasound bath and the results were then compared with those from an extraction usual using alkaline hydrolys is ( 20˚C for 24 h). The me- thod was valued through external and internal calibration. Internal calibration using o-coumaric acid as in- ternal standard and m-coumaric acid as surrogate internal standard showed better results. The detection limits were of 0.09 and 0.04 mg·L–1 for p -coumaric and ferulic acids, respectively. The proposed method showed a good linear dynamic range (3.00 - 30.00 mg·L–1) for the analytes. The usefulness of the method- ology was demonstrated by addition-recovery experiments using forage samples and values were in the 83 to 99% range. The extraction of ester-linked phenolic acids by 120 minutes of ultrasound bath was faster and more reproducible than alkaline hydrolysis (20˚C for 24 h). Keywords: Ultrasound Bath, Phenolic Acids, Forage, Internal Calibration 1. Introduction Phenolic compounds are a group of secondary metabo- lites synthesized by plants during development as a de- fense against pathogenic ingress, wounding and UV ra- diation [1,2]. Among the main phe nolic compounds pre- sent in plants are phenolic acids, such as ferulic acid, p- coumaric acid and caffeic acid. These acids are present in plants in both free and bound forms where a small fraction occurs as “free ac- ids” and the majo rity are linked to structural components of the plant [3,4]. According to Jung (1989), ferulic and p-coumaric acids seem to be generally esterified to dif- ferent components of the cell wall. The majority of p- coumaric acid are esterified to lignin whereas ferulic acid tends to associate with the hemicellulose fraction and may form a cross-linka ge between li gnin and hemicellu- lose [3,4]. Due t o such asso ciati ons, seve ral stud ies ha ve shown that these compounds potentially affect the di- gestibility of forages by the rumen, thereby compromis- ing li vestock p erformance [3,5-10]. Acidic hydrolysis and alkaline hydrolysis are the most common means of releasing the phenolics acids [2]. The main method of extraction applied in forage samples is alkaline hydrolysis. It allows quantification of total phe- nolic acids (ester-linked and ether-linked) or those that are only ester-linked through two types of treatment: mild alkaline or hot alkaline hydrolysis [11]. In the mild alkaline extraction, where the sample is treated with NaOH 1 mol·L–1 solution at 20˚C for 24 h, only ester bonds are cleaved. During hot alkaline hydrolysis, the sample is usually treated with a solution of NaOH 4 mol ·L–1 at 170˚C for 2 h, and both ester and ether bonds are cleaved. The ether-linked derivatives are estimated  M. D. R. SANTOS ET AL. Copyright © 2011 SciRes. AJAC 345 by the difference between total phenolic acids and the ester-linked molecules [4,7]. Phenolic compounds have been analyzed in different samples by capillary electrophoresis (CE) [12-15], gas chromatography equipped with a mass spectrometric detector (GC-MS) [16-20], ultra performance liquid chromatography (UPLC) [21] and high performance liq- uid chromatography (HPLC) [3,5-7,9,20-27]. HPLC is most frequently used because it does not require a deri- vatization sample for analysis as gas chromatography [24]. When compared to c apillar y electrophoresis, HP LC is better in terms of accuracy, sensitivity and precision although it consumes more solvent and time for sample treatment [15]. Recently, ultrasound bath has been used as an ancil- lary tool for traditional extraction methods due to the simplicity of the method and a decrease in the time needed for extraction. There have been many studies applying ultrasound bath in the sample treat ment of soil s and sediments [28-31], biological [32-34 ], nut ritio us [35, 36]. However, in the case of forage samples, no study has yet been reported in the literature describing this technique for the extraction and quantification of pheno- lic acids. The objective of this work was to propose an a lter na- tive method that is fast and precise for extracting ester- linked phenolic acids using an ultrasound bath. This pa- per describes the development of a new method using high performance liquid chromatography (HPLC-UV) for the separation of five phenolic acids (ferulic, p-cou- maric, m-coumaric, o-coumaric and caffeic acids). Shiki- mic acid was also included in the calibrations and is an organic acid that occurs as an intermediate during the process of hydroxycinnamic acid formation [3,37]. The performance of the analytical procedure was evaluated by determining the concentration of phenolic acids in forage samples. 2. Experimental 2.1. Chemicals and Solutions The standard compounds (including ferulic, p-coumaric, m-coumaric, o-coumaric, caffeic and shikimic acids) were purchased from Sigma-Aldrich (St. Louis, MO, USA). HPLC grade solvents (methanol, acetonitrile and tetrahydrofuran) and HPLC grade reagents (phosphoric acid, acetic acid and potassium phosphate monobasic) were from Tedia Company Inc. (Fairfield, OH, USA). The chemicals sodium acetate, sodium hydroxide and hydrochloric acid were from Vetec (Rio de Janeiro, RJ, Brazil). Stock solutions of the ferulic, p-coumaric, m-coumaric, o-coumaric, caffeic and shikimic acids were prepared at a concentration of 1 g·L–1 in methanol and filtered thr- ough a 0.45 µm PT FE filter. These solutions were stable for one week whe n stored at 4˚C. 2.2. Preparation of Calibration Standards Standard solution containing a mixture of caffeic, shiki- mic, ferulic and p-coumaric acids were first prepared in mobile phase at a concentration of 100 mg L-1 and were gradually diluted in mobile fase to working concentra- tions of 3 to 20 mg·L–1. An internal standard of o-cou- maric acid and a surrogate internal standard of m-cou- maric acid was added to set up a resulting concentration of 10 mg·L–1 in all standard solutio ns. 2.3. HPLC Apparatus HPLC analyses were conducted using an Agilent 1100 Series system equipped with a manual injection valve with a 20 µL sample loop, a degasser system, a quartet pump and a multiple wavelength UV-detector. Data ac- quisition and processing were accomplished with the Agilent Chemistation LC Systems software. A reversed- phase (RP) column ZORBAX ODS (150.0 mm × 4.6 mm I.D., 5 μm particle size) and a ZORBAX ODS pre-column (12.5 mm × 4.6 mm I.D., 5 μm p article size) were used at room temperature. 2.4. Optimization of the Chromatographic Separation This study involved the optimization of the separation conditions of shikimic, caffeic, p-coumaric and ferulic acids using a mobile phase composed for organic sol- vents and acid solution or buffer. Initially, mixtures of methanol, acetonitrile or tetrahydrofuran with aqueous solution were tested as eluents to obtain a sufficient resolution. The pH range of the eluent (2.08 to 4.50) was adjusted with phosphoric acid, acetic acid, acetate buffer or phosphate buffer. The values of retention time, peak symmetry, resolution and sensitivity were evaluated for sufficient reso lution on the RP- column. 2.5. Plant Material Fractions of stem and leaf of the species Brachiaria bri- zantha Marandu, Cynodon dactylon Florakirk, Cynodon nlemfuensis Florona, Panicum maximum Mombaça, Pennisetum purpureum Anão and Pennisetum pur- pu- reum P ioneiro were obtained from the experimental farm of EMBRAPA (Goiás, Brazil). The samples were taken every 30 days, dried in forced air oven at 55˚C for  M. D. R. SANTOS ET AL. Copyright © 2011 SciRes. AJAC Table 1. Content (mg·g–1 dry matter) of ester-linked p-cou maric and ferulic acids in Panicum maximum Mo mbaça ext racted in bath with pr o grammed t emp erat ure (a t 20˚C for 2 4 h) and ultrasound (at room temperature for 120 min). Content (mg·g–1 dry matter) Bath with programmed temperature Ultrasound Rep l icate p-CA FA p-CA FA 1 4.48 4.75 4.08 4.93 2 4.39 4.52 4.09 4.93 3 4.20 4.42 4.05 4.88 Average 4.35 4.56 4.07 4.91 Sd 0.14 0.17 0.03 0.03 RSD 3 3 1 1 p-CA = Ester-Linked p-Coum aric A cid; FA = Ester-Linked Feru lic Acid; Sd = standard deviation; RSD = relative standard deviation. 72 h and grounded (1 mm). 2.6. Extraction of Ester-Linked Phenolic Acids Approximately 25.0 mg of leaf of Panicum maximum Mombaça were extracted at room temperature with 1 mol ·L–1 NaOH using the following times for sonication: 15, 30, 60, 90, 120, 150, 180, 210, 240, 270 and 300 mi- nutes. The results obtained were then compared with those fro m the al kal ine hydr olys is a t 20˚C for 24 h. Trip- licate extractions and analyses were carried out. After extraction, the samples were subsequently fil- tered and washed with water. The combined filtrate and wash was acidified to pH 2.5 with 6 mol ·L–1 HCl and brought to a final volume of 10 mL. The sample solu- tions were diluted using mobile phase, filtered through a 0.45 µm PTFE filter and analyzed by HPLC. The injec- tion volume was 20 µL. 3. Results and Discussion 3.1. Development of the HPLC Me tho d Preliminary tests employing a binary mixture (organic solvent: aqueous solution) as the mobile phase were per- formed. T he best isocratic separation was established for each organic solvent (acetonitrile, methanol and tetrah y- drofuran) at different pH values (2.08, 2.20, 2.50, 3.00, 3.50, 4.00 and 4.55). This showed that increasing pH resulted in a longer retention time of the compounds. Depending on the eluent pH, the ferulic and p-coumaric acids present double peaks at higher pH value s. This c an be explained by the presence of weak organic acids, wit h pKa values of around 4.5 and 9.5 [17]. The best results were obtained with the mobile phase adjusted to pH 2.08 with phosphoric acid (for all three solvents) because ionization of the phenolic acids is suppressed at this pH value. Ho wever, p H var iatio ns of t he el uent us ing b inar y compositions did not improve the resolution. Amon g the compositions of the mobile phase optimized by applying the ternary mixture of solvents, the best separation con- dition was for isocratic elution with a mobile phase composed of acetonitrile/methanol/H3PO4 pH 2.08 (13: 12.5:74.5) at a flow of 1 mL·L–1. The detection of the compounds was based on different wavelengths that took into consideration their maximum absorption. Here, the signal was registered at 236 nm from 0 to 3 minutes, 316 nm from 3 to 9.1 minutes and 236 nm from 9.1 to 15 minutes. This detection had increased sensitivity, im- proving the detection and quantification limits of the method. 3.2. Extraction of Ester-Linked Phenolic Acids For ultrasound bath extraction, analyses were performed in three replicates. Sonication times of 90 minutes and less were not enough to extract completely the ester- linked phenolic acids. The peak areas of the phenolic acids increased with increasing time and reached their maxima at 120 minutes of sonication. At sonication times over 150 minutes, the peak areas decreased, indica- ting a possible compound degradation. To evaluate accuracy, paired Student's t-test was used to determine whether significant differences existed be- twee n results obtained usi ng 120 minutes of sonication in an ultrasound bath and thos e ob tained by alka line hydro- lysis extraction (20˚C for 24 h). The paired Student's t- test ( = 0.05) showed that there was not a significant difference between the means. However, results from extraction employing the ultrasound bath presented s- maller relative standard deviations, indicating that this method is more reproducible when compared to alkaline hydrolysis (Table 1). Therefore, extraction with ultra- sound bath for 120 minutes was used to reduce the time of sample a nalysis. 3.3. Features of the Analy tical Meth od The evaluat ion o f the method was p erfor med b y external  M. D. R. SANTOS ET AL. Copyright © 2011 SciRes. AJAC 347 Figure 1. Typical chromatograms of (a) standard mixture and (b) phenolic acids released from ester bonds in a sam- ple of Panicum maximum Mombaça leaf. Peaks: 1) shikimic acid, 2) caffeic acid, 3) p-coumaric acid, 4) ferulic acid, 5) m-coumaric acid, and (6) o-coumaric acid. Analytical con- ditions: column, ZORBAX ODS; fl ow-rate, 1.0 ml/min; detection for programming of wavelength; mobile phase, acetonitrile/methano l/H3PO4 pH = 2.08 (13:12.5:74.5). and internal calibration. Initial ly was studie d the applica- tion of the o-coumaric and m-coumaric acids as internal stand ard and surrogate internal stand ard . Preli minar y wa s studied the presence of o-coumaric and m-coumaric ac- ids in forage samples. Figure 1 compares the chroma- tograms of a standard mixture (ferulic, p-coumaric, m- coumaric, o-coumaric, caffeic and shikimic acids) and a forage sample. The retention time obtained for the com- pounds confirmed that o-coumaric and m-coumaric acids were not present in the samples. As a consequence, m- coumaric and o-coumaric acids were used as surrogate internal sta nda rd and internal standard, respectively. The precision of the method was evaluated by re- peated injection ( = 6) of a forage sample, and the standard deviation was determined as better than 3% (external calibratio n) and 1% (internal calibration). The sensitivity was also determined using the limit of detec- tion (LOD) and the limit of quantification (LOQ). The LOD was calculated as 3 s, where s is the average signal of standard deviation of 6 forage sample injections with low phenolic acid concentration, and the LOQ was 10 s. Table 2 shows the analytical parameters for repeated injection of a tropical forage sample using internal and external calibrations. The internal calibration presented smaller values of LOD, LOQ and RSD. The best results were attributed the use of the internal standard (o-cou- maric acid) and surrogate standard (m-coumaric acid) that corrected fluctuations between each injection and losses during the sample extraction process, respectively. Linearity was evaluated, taking into account the cor- relation coefficient (r) and the response factor in the Table 2. Limit of detection (LOD), limit of quantification (LOQ ) and re peatability ac hieved f or external and interna l calibration. External c alibration Internal calibration Comp ound LOD (mg·L–1) LOQ (mg·L–1) RSD (%) LOD (mg·L–1) LOQ (mg·L–1) RSD (%) p-CA 0.18 0.60 3 0.09 0.28 1 FA 0.08 0.26 1 0.04 0.15 1 p-CA = Ester-Linked p-Coumaric Acid; FA = Ester-Linked Ferulic Acid; LOD = limit of detection; LOQ = limit of quantification; RSD = relative standard deviati on. Table 3. Results of regres s ion analys is on cali bration. External c alibration Internal calibration Compound equati o n y = ax + ba correlation coefficient equati o n y = ax + bb correlation coefficient r = 0.99 940 r = 0.99 970 r = 0.99 995 r = 0.99 995 acid 9.4925 r = 0.999 90 0.0026 r = 0.999 90 Ferul ic acid r = 0.99 910 r = 0.99 935 aWhere y and x are the peak area (mAU) and concentration of the analytes (mg·L–1), respectively; bWhere y is the rati on of the area of the ana lyte peak divided by the area of the surrogate intern al standard and x is the ration of the concentration of the analyte divided by the concentration of the surro- gate internal standard. concentration range of 3.00 to 30.00 mg·L–1. Calibration curves were determined by a mixture of standard solu- tions of t he pheno lic acids, an d applying an internal stan- dard (o-coumaric acid) and a surrogate standard (m- coumaric acid). Each point on the calibration curve cor- responds to an average signal from three independent peak measurement s for ea ch aci d. The propor tionalit y of peak area and concentration was confirmed for all the analytes (correlation coefficient > 0.999), as shown in Table 3. The accuracy of the method was evaluated through recovery assays using tropical forage samples spiked with a mixture of acid standards comprising ferulic, p- coumaric, m-coumaric, caffeic and shikimic acids at three fortification levels: 5.00, 7.50 and 10.00 mg·L–1 (Table 4) with 10.00 mg·L–1 o-coumaric acid as the in- ternal standard. A blank spike (NaOH 1 mol·L–1) ( = 5) was also prepared for the extraction tests with a mix- ture of the phenolic acids at a concentration of 10.00 mg·L–1 (Table 4). Table 4 shows the results of recovery for p-coumaric, ferulic and m-coumaric acids using internal and external calibrations. The extraction method recoveries obtained for phenolic acids ranged from 82 to 99%, thus confirm- ing the accuracy of the method for extraction of phenolic 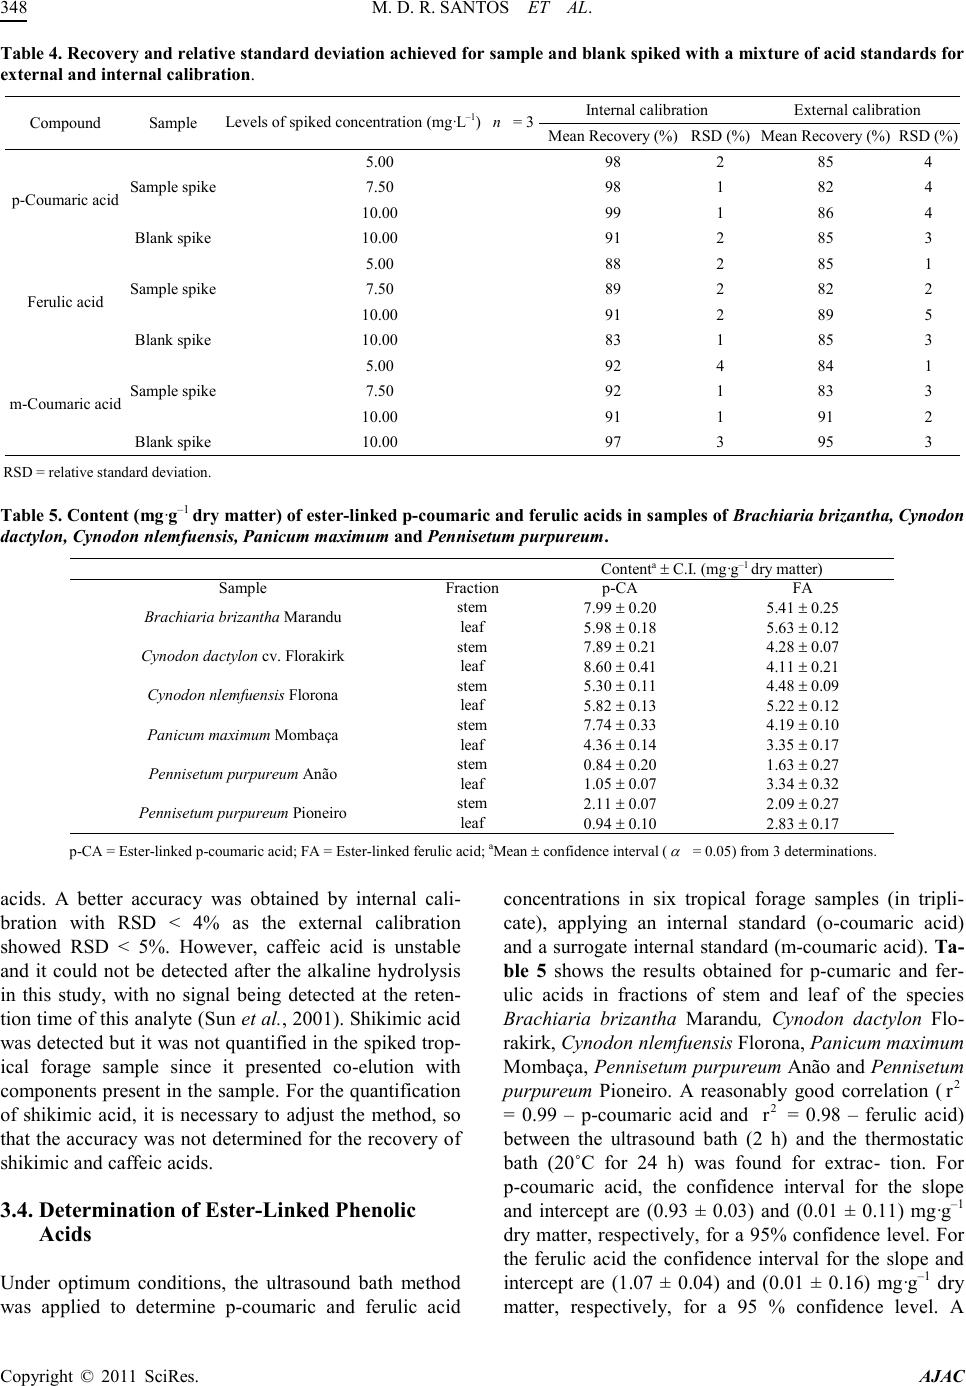 M. D. R. SANTOS ET AL. Copyright © 2011 SciRes. AJAC Table 4 . Rec o ve ry an d relat ive s tan d ar d de vi at i on ac hi ev ed for sa mpl e a n d bl a nk spi ked wi t h a mixt ure of aci d st a nda rd s f or external and internal calibration. Compound S ample Levels of spiked concentration (mg·L–1) = 3 Internal calibration External calibration Mea n Recovery (%) RSD (% ) Mea n Recov ery (%) RSD (%) p-Coumaric acid Sample spike 5.00 98 2 85 4 7.50 98 1 82 4 10.00 99 1 86 4 Blank spike 10.00 91 2 85 3 Ferul ic acid Sample spike 5.00 88 2 85 1 7.50 89 2 82 2 10.00 91 2 89 5 Blank spike 10.00 83 1 85 3 m-Coumaric acid Sample spike 5.00 92 4 84 1 7.50 92 1 83 3 10.00 91 1 91 2 Blank spike 10.00 97 3 95 3 RSD = relative standard deviation. Table 5 . Content (mg·g–1 dry matter) of ester-linked p-cou mari c and fer ulic aci ds in s a mpl e s o f Brachiaria brizantha, Cynodon dactylon, Cynodon nlemfuensis, Panic um maximum and Pennisetu m purpure um. Content ± C.I. (mg·g dry matter) Brachiaria bri zantha Marandu stem ± ± leaf ± ± Cynodo n dactylon cv. Florakirk 7.89 ± 0.21 4.28 ± 0.07 8.60 ± 0.41 4.11 ± 0.21 Cynodo n nlemfuensis Florona leaf ± ± Panicum maximum Momb aça s tem 7.74 ± 0.33 4.19 ± 0.10 leaf 4.36 ± 0.14 3.35 ± 0.17 Penniset um p ur pureu m Anão 0.84 ± 0.20 1.63 ± 0.27 Penniset um p ur pureu m Pioneiro stem ± ± leaf ± ± p-CA = Ester-linked p-coumaric acid; FA = Ester-linked ferulic acid; aMean ± c o nfidence inte r v a l ( = 0.05) from 3 determinations. acids. A better accuracy was obtained by internal cali- bration with RSD < 4% as the external calibration showed RSD < 5%. However, caffeic acid is unstable and it could not be detected after the alkaline hydrolysis in this study, with no signal being detected at the reten- tion t ime o f t his anal yte ( Su n et a l., 2001). Shikimic acid was detected but it was not quanti fied in the spiked tr op- ical forage sample since it presented co-elution with compo nents p resent in t he samp le. For the quantificatio n of shikimic acid, it is necessary to adjust the method, so that the accuracy was not determined for the recovery of shikimic and caffeic acids. 3.4. Determination of Est er-Linked Phenolic Acids Under optimum conditions, the ultrasound bath method was applied to determine p-coumaric and ferulic acid concentrations in six tropical forage samples (in tripli- cate), applying an internal standard (o-coumaric acid) and a surrogate internal standard (m-coumaric acid). Ta- ble 5 shows the results obtained for p-cumaric and fer- ulic acids in fractions of stem and leaf of the species Brachiaria brizantha Marandu, Cynodon dactylon Flo- rakirk, Cynodon nlemfuensis Florona, Panicum maximum Mombaça, Pennisetum purpureum Anão and Pennisetum purpureum Pioneir o. A reasonably good correlation ( = 0.99 – p-coumaric acid and = 0.98 – ferulic acid) between the ultrasound bath (2 h) and the thermostatic bath (20˚C for 24 h) was found for extrac- tion. For p-coumaric acid, the confidence interval for the slope and intercept are (0.93 ± 0.03) and (0.01 ± 0.11) mg·g–1 dry matter, respectively, for a 95% confidence level. For the ferulic acid the confidence interval for the slope and intercept are (1.07 ± 0.04) and (0.01 ± 0.16) mg·g–1 dry matter, respectively, for a 95 % confidence level. A 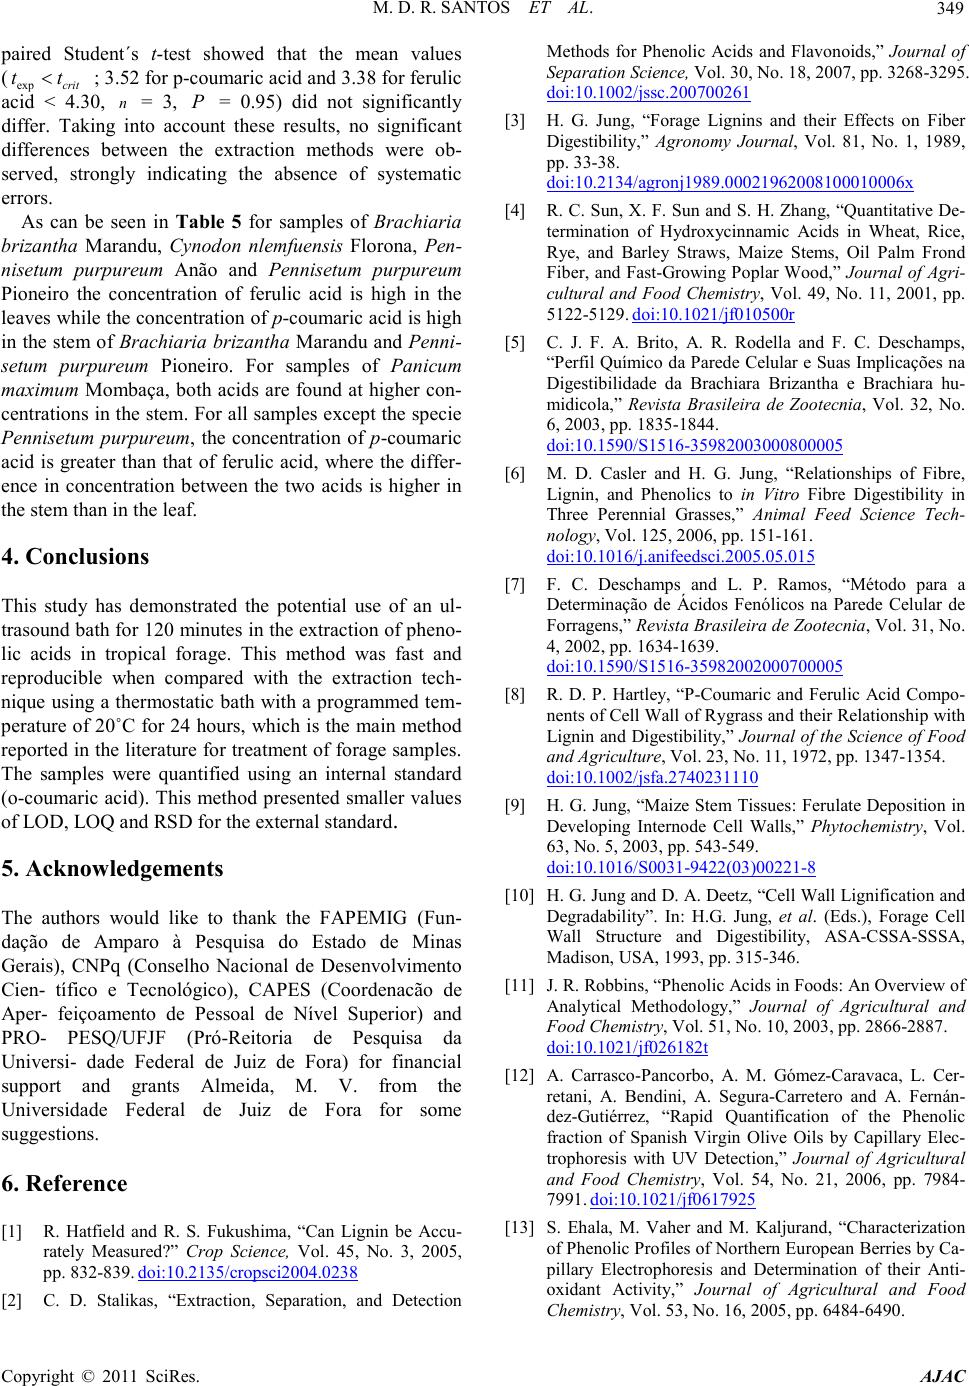 M. D. R. SANTOS ET AL. Copyright © 2011 SciRes. AJAC 349 paired Student´s t-test showed that the mean values ( ; 3.52 for p-coumaric acid and 3.38 for ferulic acid < 4.30, = 3, = 0.95) did not significantly differ. Taking into account these results, no significant differences between the extraction methods were ob- served, strongly indicating the absence of systematic errors. As can be seen in Table 5 for samples of Brachiaria brizantha Marandu, Cynodon nlemfuensis Florona, Pen- nisetum purpureum Anão and Pennisetum purpureum Pioneiro the concentration of ferulic acid is high in the leaves while the concentration of p-coumaric acid is high in the stem o f Brachiaria brizantha Mara ndu and Penni- setum purpureum Pioneiro. For samples of Panicum maximum Mombaça, both acids are found at higher con- centrations in t he stem. For all samples e xcept the specie Pennisetum purpureum, the concentration of p-coumaric acid is greater than that of ferulic acid, where the differ- ence in concentration between the two acids is higher in the stem t han in the leaf. 4. Conclusions This study has demonstrated the potential use of an ul- trasound bath for 120 minutes in the extr actio n of p heno- lic acids in tropical forage. This method was fast and reproducible when compared with the extraction tech- nique using a t hermost atic bath with a programmed tem- perature of 20˚C for 24 hours, which is the main method repor ted in the literature for treatment of forage samples. The samples were quantified using an internal standard (o-coumaric acid). This method presented smaller values of LOD, LOQ and RSD for the external standard. 5. Acknowledgements The authors would like to thank the FAPEMIG (Fun- dação de Amparo à Pesquisa do Estado de Minas Gerais), CNPq (Conselho Nacional de Desenvolvimento Cien- tífico e Tecnológico), CAPES (Coordenacão de Aper- feiçoamento de Pessoal de Nível Superior) and PRO- PESQ/UFJF (Pró-Reitoria de Pesquisa da Universi- dade Federal de Juiz de Fora) for financial support and grants Almeida, M. V. from the Universidade Federal de Juiz de Fora for some suggestions. 6. Referen ce [1] R. Hatfield and R. S. Fukushima, “Can Lignin be Accu- rately Measured?” Crop Science, Vol. 45, No. 3, 2005, pp. 832-839. doi:10.2135/cropsci2004.0238 [2] C. D. Stalikas, “Extraction, Separation, and Detection Methods for Phenolic Acids and Flavonoids,” Journal of Separation Science, Vol. 30, No. 18, 2007, pp. 3268-3295. doi:10.1002/jssc.200700261 [3] H. G. Jung, “Forage Lignins and their Effects on Fib er Digestibility,” Agronomy Journal, Vol. 81, No. 1, 1989, pp. 33-38. doi:10.2134/agronj1989.00021962008100010006x [4] R. C. Sun, X. F. Sun and S. H. Zhang, “Quantitative De- termination of Hydroxycinnamic Acids in Wheat, Rice, Rye, and Barley Straws, Maize Stems, Oil Palm Frond Fiber, and Fast-Growing Poplar Wood,” Journal of Agri- cultural and Food Chemistry, Vol. 49, No. 11, 2001, pp. 5122-5129. doi:10.1021/jf010500r [5] C. J. F. A. Brito, A. R. Rodella and F. C. Deschamps, “Perfil Químico da Parede Celular e Suas Implicações na Digestibilidade da Brachiara Brizantha e Brachiar a hu- midicola,” Revista Brasileira de Zootecnia, Vol. 32, No. 6, 2003, pp. 1835-1844. doi:10.1590/S1516-35982003000800005 [6] M. D. Casler and H. G. Jung, “Relationships of Fibre, Lignin, and Phenolics to in Vitro Fibre Digestibility in Three Perennial Grasses,” Animal Feed Science Tech- nology, Vol. 12 5, 20 06, pp. 151-161. doi:10.1016/j.anifeedsci.2005.05.015 [7] F. C. Deschamps and L. P. Ramos, “Método para a Determinação de Ácidos Fenólicos na Parede Celular de Forragens,” Revista Brasileira de Zootecnia, Vo l . 31, No. 4, 2002, pp. 1634-1639. doi:10.1590/S1516-35982002000700005 [8] R. D. P. Hartley, “P-Coumaric and Ferulic Acid Compo- nents of Cell Wall of Rygras s and thei r Relationship with Lignin and Digestibility,” Journal of the Science of Food and Agriculture, Vol. 23, No. 11, 1972, pp . 1 34 7-1354. doi:10.1002/jsfa.2740231110 [9] H. G. Jung, “Maize Stem Tissues: Ferulate Deposition in Developing Internode Cell Walls,” Phytochemistry, Vol. 63, No. 5, 2003, pp. 543-549. doi:10.1016/S0031-9422(03)00221-8 [10] H. G. Jung and D. A. Deetz, “Cell Wall Lignification and Degradability”. In: H.G. Jung, et al. (Eds.), Forage Cell Wall Structure and Digestibility, AS A-CSSA-SSSA, Madison, USA, 1993, pp. 315-346. [11] J. R. Robbins, “Phenolic Acids in Foods: An Overvie w of Analytical Methodology,” Journal of Agricultural and Food Ch emistry, Vol. 51, N o. 10 , 2003, pp. 2866-2887. doi:10.1021/jf026182t [12] A. Carrasco-Pancorbo, A. M. Gómez-Caravaca, L. Cer- retani, A. Bendini, A. Segura-Carretero and A. Fernán- dez-Gutiérrez, “Rapid Quantification of the Phenolic fraction of Spanish Virgin Olive Oils by Capillary Elec- trophoresis with UV Detection,” Journal of Agricultural and Food Chemistry, Vol. 54, No. 21, 2006, pp. 7984- 7991. doi:10.1021/jf0617925 [13] S. Ehala, M. Vaher and M. Kaljurand, “Characterization of Phenolic Pro fi les of Northern European Berries b y Ca- pillary Electrophoresis and Determination of their Anti- oxidant Activity,” Journal of Agricultural and Food Chemistry, Vol. 53, No. 16, 2005, pp. 6484-6490.  M. D. R. SANTOS ET AL. Copyright © 2011 SciRes. AJAC doi:10.1021/jf050397w [14] D. L. D. Lima, A. C. Duarte and V. I. Esteves, “Optimi- zation of Phenolic Compounds Analysis by Capillary Electrophoresis,” Talanta, Vol. 72, No. 4, 2007, pp. 1404-1409. doi:10.1016/j.talanta.2007.01.049 [15] Y. Y. Peng, J. N. Ye and J. L. Kong, “Determination of Phenolic Compounds in Perilla Frutescens L. by Capil- lary Electrophoresis with Electrochemical Detection,” Journal of Agricultural and Food Chemistry, Vol. 53, No. 21, 2005, pp. 8141-8147. doi:10.1021/jf051360e [16] A. Canini, D. Alesiani, G. D’Arcangelo and P. Tagliat- esta, “Gas Chromatography—Mass Spectrometry Analy- sis of Phenolic Compounds from Carica Papaya L. Leaf,” Journal of Food Composition and Analysis, Vol. 20, No. 7, 2007, pp. 584-590. doi:10.1021/jf051360e [17] Y. C. Fiamegos, C. G. Nanos, J. Vervoort and C. D. Sta- likas, “Analytical Procedure for the In-Vial Derivatiza- tion—Extraction of Phenolic Acids and Flavonoids in Methanol ic and Aqueous Plant Extracts Followed by Gas Chromatography with Mass-Selective Detection,” Jour- nal of Chromatography A , Vol. 1041, No. 1 -2, 2004 , p p. 11-18. doi:10.1016/j.chroma.2004.04.041 [18] J. H. Grabber, J. Ralph and R. D. Hatfield, “Cross-Linking of Maize Walls by Ferulate Dimerization and Incorporation into Lignin,” Journal of Agricultural and Food Chemistry, Vol. 48, No. 12, 2000, pp. 6106-6113. doi:10.1021/jf0006978 [19] M. Plessi, D. Bertelli and F. Miglietta, “Extraction and Identification by GC-MS of Phenolic Acids in Traditional Balsamic Vinegar from Modena,” Journal of Food Com- position and Analysis, Vol. 19, No. 1, 2006, pp. 49-54. doi:10.1016/j.jfca.2004.10.008 [20] G. Sarath, L. M. Baird, K. P. Vogel and R. B. Mitchell, “Internode Structure and Cell Wall Composition in Ma- turing Tillers of Switchgrass (Panicum Virgatum. L),” Bioresource Technology, Vol. 98, No. 16, 2007, pp. 2985-2992. doi:10.1016/j.biortech.2006.10.020 [21] Z. Spacil, L. Novakova and P. Solich, “Analysis of Phe- nolic Compounds by High Performance Liquid Chroma- tography and Ultra Performance Liquid Chromatogra- phy,” Talanta, Vol. 76, 2008, pp. 189 -199. doi:10.1016/j.talanta.2008.02.021 [22] K. Chitindingu, A. R. Ndhlala, C. Chapano, M. A. Ben- hura and M. Muchuweti, “Phenolic Compound Content, Profiles and Antioxidant Activities of Amaranthus Hy- bridus (Pigweed), B rachiaria Briz antha ( Upright Brachia- ria) and Panicum Maximum (Guinea Grass),” Journal of Food Biochemistry, Vol. 31, No. 2, 2007, pp. 206-216. doi:10.1111/j.1745-4514.2007.00108.x [23] S. Gómez-Alonso, E. García-Romero and I. Hermosín- Gutiérrez, “HPLC Analysis of Diverse Grape and Wine Phenolics using Direct Injection and Multidetection by DAD and Fluorescence,” Journal of Food Composition and Analysis, Vol. 20, No. 7, 2007, pp. 618-626. doi:10.1016/j.jfca.2007.03.002 [24] Z. L. Huang, B. W. Wang, D. H. Eaves, J. M. Shikany and R. D. P ace, “Phenolic Compound Pro file o f Selected Vegetables Frequently Consumed by African Americans in the Southeast United States,” Food Chemistry, Vol. 103, No. 4, 2007, pp. 1395-1402. doi:10.1016/j.foodchem.2006.10.077 [25] C. Mertz, A. Gancel, Z. Gunata, P. Alter, C. Dhuique- Mayer, F. Vaillant, A. M. Perez, J. Ruales and P. Brat, “Phenolic Compounds, Carotenoids and Antioxidant Ac- tivity of Three Tropical Fruits,” Journal of Food Compo- sition and Analysis, Vol. 22, No . 5, 2009, pp. 381-387. doi:10.1016/j.jfca.2008.06.008 [26] M. A. M. Rodrigues, C. M. Guedes, J. W. Cone, A. H. van Gelder, L. M. M. Ferreira and C. A. Sequeira, “Ef- fec ts o f Phenolic Acid Structures on Meadow Hay Diges- tibility,” Animal Feed Science Technology, Vol. 136, 2007, pp . 297-311. doi:10.1016/j.anifeedsci.2006.09.009 [27] . C. I. G. Tuberoso, A. Kowalczyk, E. Sarritzu and P. Cabras, “Determination of Antioxidant Compounds and Antioxidant Activity in Commercial Oilseeds for Food Use,” Food Chemistry, Vol. 103, No. 4, 2007, pp. 1494- 1501. doi:10.1016/j.foodchem.2006.08.014 [28] R. Al-Merey, M. S. Al-Masri and R. Bozou, “Cold Ultra- sonic Acid Extraction of Copper, Lead and Zinc from Soil Samples,” Analytica Chimica Acta, Vol. 452, No. 1, 2002, pp . 143-148. doi:10.1016/S0003-2670(01)01431-3 [29] K. Ashley, R. N. Andrews, L. Cavazos and M. Demange, “Ultrasonic Extraction as a Sample Preparation Tech- nique for Elemental Analysis by Atomic Spectrometry,” Journal of Analytical Atomic Spectrometry, Vol. 16, 2001, pp . 1147-1153. doi:10.1039/b102027g [30] A. Elik, “Ultrasound assisted pseudo-digestion of street dust samples prior to determination by atomic absorption spectrometry,” Talanta, Vol. 66, No. 4, 200 5, pp. 882-888. doi:10.1016/j.talanta.2004.12.050 [31] A. Marin, C. Lopez-Gonzales and C. Barbas, “Develop- ment and Validation of Extraction Methods for Determi- nation of Zinc and Arsenic Speciation in Soils Using Fo- cused Ultrasound—Application to Heavy Metal Study in Mud and Soils,” Analytica Chimica Acta, Vol. 4 42, 20 01 , pp. 305-318. [32] S. C. C. Arruda, A. P. M. Rodriguez and M. A. Z. Arru- da, “Ultrasound-Assisted Extraction of Ca, K and Mg from in Vitro Citrus Culture,” Journal of the Brazilian Chemical Societ y, Vol. 14, No. 3, 2003, pp. 470-474. doi:10.1590/S0103-50532003000300023 [33] M. Liva, R. Muñoz-Olivas and C. Câmara, “Determina- tion of Cd in Sonicate Slurries and Leachates of Biologi- cal and Environmental Materials by FI-CV-AAS,” Ta- lanta, V ol. 51, No. 2, 2000, pp. 3 81-387. doi:10.1016/S0039-9140(99)00292-1 [34] C. C. Nascentes, M. Korn and M. A. S. Arruda, “A Fast Ultrasound-Assisted Extraction of Ca, Mg, Mn and Zn from Vegetables,” Microchemical Jou rnal, Vol. 69, No. 1, 2001, pp . 37-43. doi:10.1016/S0026-265X(00)00192-2 [35] J. C. Cypriano, M. A. C. Matos and R. C. Matos, “Ultra- sound-Assisted Treatment of Palm Oil Samples for the Determination of Copper and Lead by Stripping Chrono- potentiometry,” Microchemical Journal, Vol. 90, No. 1,  M. D. R. SANTOS ET AL. Copyright © 2011 SciRes. AJAC 351 2008, pp . 26-30. doi:10.1016/j.microc.2008.03.001 [36] E. A. Zakharova, V. I. Deryabina and G. B. Slepchenko, “Optimization of the Voltammetric Determination of Ar- senic in Foodstuffs,” Jounal of Analytical Chemistry, Vol. 60, No. 6, 2005, pp. 503-507. doi:10.1007/s10809-005-0129-3 [37] P. J. Van Soest, “Nutritional Ecology of the Ruminant”, Cornell University Press, New York, 1994. Abbreviations Used CE, capillary electrophoresis; GC-MS, gas chromatogra- phy with a mass spectrometry detector; UPLC, ultra per- formance liquid chromatography; HPLC, high perfor- mance liquid chromatography; p-CA, ester-linked p-coumaric acid; FA, ester-linked ferulic acid; LOD, limit of detection; LOQ, limit of quantification; RSD, relative standard deviation; CI, confidence interval.
|