America n Journal of Analy tic al Chemistry, 2011, 2, 314-323
doi:10.4236/ajac.2011.23039 Published Online July 2011 (http://www.scirp.org/journal/ajac)
Copyright © 2011 SciRes. AJAC
Rapid Validated Stability Indicating Method for Nizatidine
and its Impurities Quantification
Antony Raj Gomes1,2, Pannala Raghuram1,2, J. Sriramul u2, Nimmakalaya Srinivas1
1Shasun Chemicals and Drugs Limited Company, Chennai, India
2Departmen t of Chemistry, Sri Krishna Devaraya University, Anantapur, India
E-mail: vas.sri328@gmail.com
Received November 10, 2010; revised March 7, 2011; accepted April 3, 2011
Abstract
This research article describes stability indicating fast liquid chromatographic method for determination of
chromatographic purity and assay of Nizatidine as a alternate for two different methods for chromatographic
purity and assay as given in USP Monograph and Ph.Eur Monograph. Proposed method is developed on
Waters symmetry RP18 (50 × 4.6 mm), 3.5 μm stationary phase using gradient elution with combination of
Ammonium acetate Diethyl amine buffer, Methanol and Tetrahydrofuran as mobile phase. Favorable results
are obtained under developed conditions, which guarantee good separation of studied components. Whereas,
data obtained from method validation confirm specificity, high sensitivity, linearity in a range of studied
concentrations, repeatability and good accuracy of this method. Considerable degradation observed in oxida-
tion stress condition was detected by this method. Eight impurities are studied among which impurity-5 is
found major degradant. The stress samples are assayed against a qualified standard and the mass balance is
found close to 99.2%. The developed method can be used for routine samples as well as stability studies.
Keywords: Column Liquid Chromatography, Nizatidine, Forced Degradation, Validation; Stability
Indicating
1. Introduction
Nizatidine: N-(2-[(2-[(dimethylamino)methyl]thiazol-4-
yl)methylthioc ] e th yl)-N-methyl-2-nitroethene-1,1-dimine
. Nizatidine is a histamine H2-receptor antagonist that
inhibits stomach acid production, and commonly used in
the treatment of peptic ulcer disease (PUD) and gastro-
esophageal reflux disease (GERD). It was developed by
Eli Lilly and is marketed under the trade names Tazac
and Axid Certain preparations of Nizatidine are now a v-
ailable over the counter in various countries including
the United States. Nizatidine has been used experimen-
tally to control weight gain associated with some anti-
psychotic medicatio n [1-3].
Nizatidine is having monographs in USP [4], Ph.Eur
[5]. USP monograph describes a chromatographic purity
method with a runtime of 70 minutes and separate assay
metho d wit h a runti me of 40 minutes. The P h.Eur mono-
graph describes a related substances method with a run-
time of 60 and assay method with a run time of 25 mi-
nutes. We have attempted in this paper a common me-
thod for i mpuritie s and assa y determination which is fast
and e cono mic. In t he lite rat ure surve y t here i s no fa st LC
stability indicative methods are reported for chromato-
graphic purity and assay for Nizatidine. Validation of
chromatographic purity and assay determination methods
for accurate quantification of eight impurities and in Ni-
zatidine samples along with assay determination is de-
scribed in this paper is carried out as per ICH recom-
mendations. Intensive stress studies were carried out for
possible degradants identification and degradation path-
way is established for Nizatid i ne with valida ted p rop osed
method.
2. Experimental Design
2.1. Chemicals
Samples of Nizatidine with purity of more than 99.5%
and it s related impuri ties ha ving pur ity more than 97 .0%
are received from Shasun research centre, Chennai, India
(Figure 1). HPLC grade methanol and tetrahydrofuran
are purchased from Merck, Darmstadt, Germany. Ana-
lytical reagent grade ammonium acetate and diethyla-
A. R. GOMES ET AL.
Copyright © 2011 SciRes. AJAC
315
mine are purchased from Merck, Darmstadt, Germany.
High purity water is pr epared by using Millipo re Milli-Q
plus water purification syste m.
2.2. Procedure
2.2.1. Equipment
The LC system, used for method development and me-
thod validation is Agilent RRLC. The output signal is
monitored and processed using EZ-Chrome elite soft-
ware on Pentium computer (Digital equipment Co).
RRLC is equipped with binary gradient pump, thermos-
tatted auto sampler, thermostatted column compartment,
variable wavelength detector.
2.2.2. Chromatogra phic Conditio ns
The chromatographic column used is Waters Symmetry
RP18 (50 × 4.6 mm) with 3.5 µm particles. The mobile
phase-A contains a 0.05 M of ammonium acetate and 1.0
mL·L–1 diethylamine. Methanol and tetrahydrofuran
(95:5) is used as mobile phase-B. The flow rate of the
mobile phase is 1.5 mL·min–1 with a gra dient p rogra m of
0/2, 2/10, 7/35, 9/45, 10/2 and 12/2 (time (min)/%
B).Th e column temperature is maintained at 30˚C and
the detectio n is monitored at wavelength o f 254 nm. T he
injection volume is 10 µL.
Diluent consists buffer and methanol in the ratio
80:20.
2.2.3. Preparation o f Standard and Sample So l utions:
All the impurities are dissolved in diluents having con-
centr atio n of 0. 1 mg/ mL the n make up to the vo lu me wit h
diluent. A Stock solution of Nizatidine (2000 µg·mL–1) is
prepared by dissolving appropriate amount in the diluent.
Working solution 200 µg·mL–1 is prepared from above
stoc k s olution for a s s ay d eter minati on.
2.3. Method Development and Optimization
The USP [4] method for Nizatidine chromatographic
purity determination has a run time of 70 minutes with
1.0 mL·min –1 flow rate. And the European pharmacopeia
[5] method for Nizatidine chromatographic purity deter-
minat ion has a r un time of 6 0 mi nutes wit h 1.0 mL ·mi n –1
flow rate. The main objective of the present study is to
develop a method having less runtime which can be use
for both c hromatograp hi c pur it y and as s ay d etermination.
To calculate the flow rate we have used the formula in
USP pharmacopeial forum Stimuli article “Transfer of
HPLC Procedures to Suitable Columns of Reduced Di-
mensions and Particle Sizes” [6 ] .
22
21221 1
1 /1FF dd= ×××
where F, l, and d are the flow rates, the column lengths,
and the column diameters, by this formula a flow rate of
0.2 mL·min–1 was derived from USP method parameters
and by using the USP method details to short length
column and flow specified but when attempted Nizati-
dine peak elute around 32 minutes and impurity-3 (last
eluting impurity) elute around 60 minutes with low re-
sponse.
Flow rate arrived from existing USP method is 0.2
mL·min–1 was derived for 50 × 4.6 mm column in which
a late elution was found. To decrease the run time flow
rate has increased 7.5 times i.e. 1.5 mL·min–1 when ap-
plied in this condition Nizatidine peak elutes around 4.8
minutes and last impurity elutes around 11 minutes with
low response. For decreasing the retention time and to
raise the response of impur i ty-3, 5% tetrahydrofuran
introduced in to the mobile phase-B. In this condition
impurity-3 retention time decreased to 8.2 minutes from
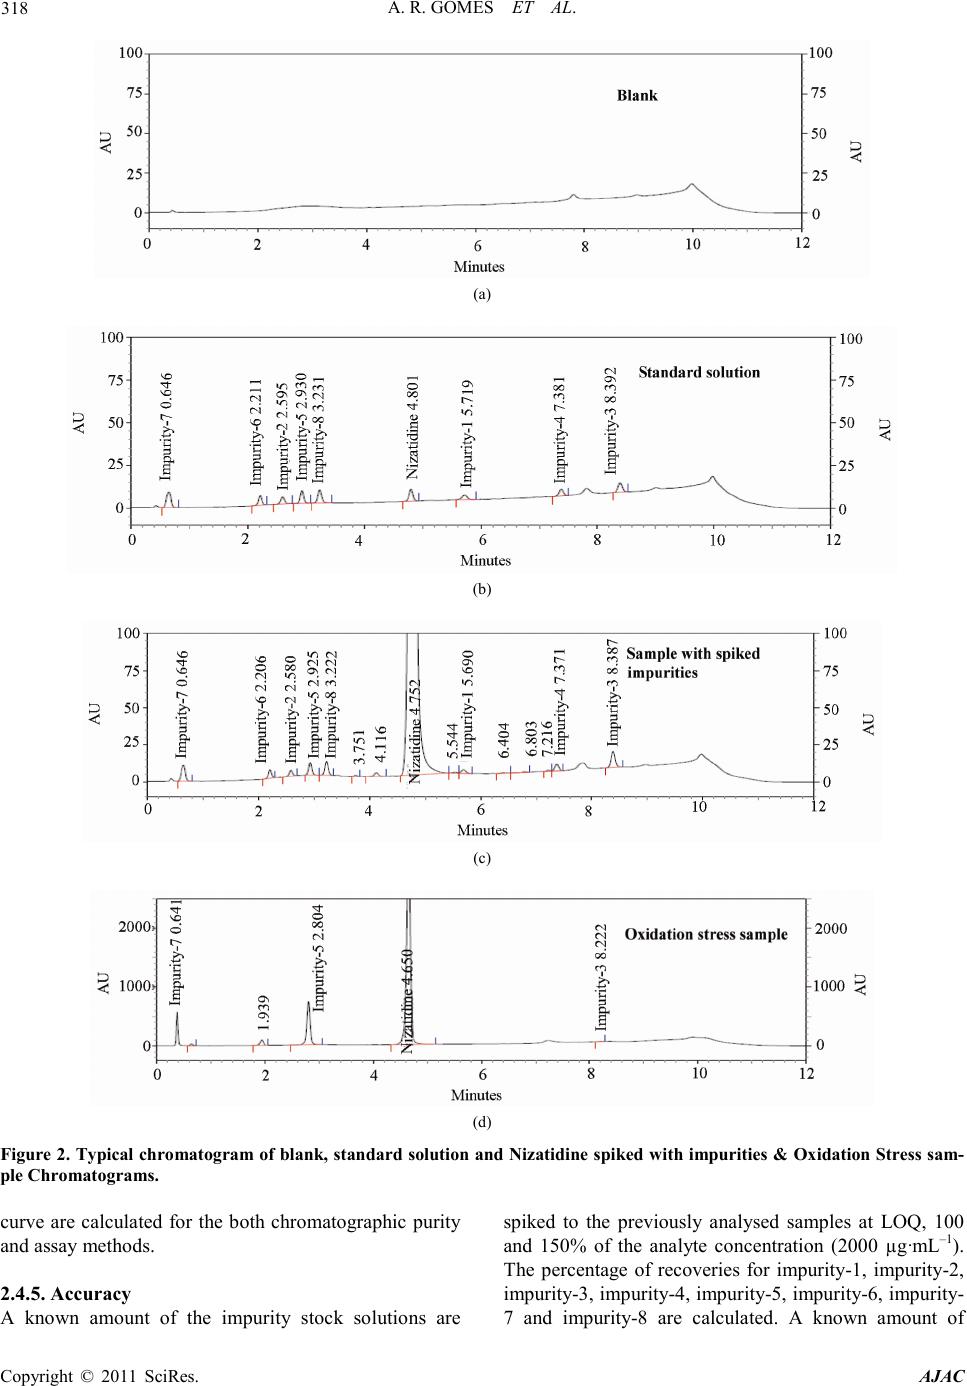
11 minutes and peak responses also enhanced. The typi-
cal retention times of Nizatidine, impurity-1, impurity-2,
i mp urity-3, impurity-4, impurity-5, impurity-6, i mp urity-
7 and impurity-8 were about 4.801, 5.719, 2.595, 8.392,
7.381, 2.930, 2.211, 0.646 and 3.231 minutes respec-
tively meeting the chromatographic system suitability
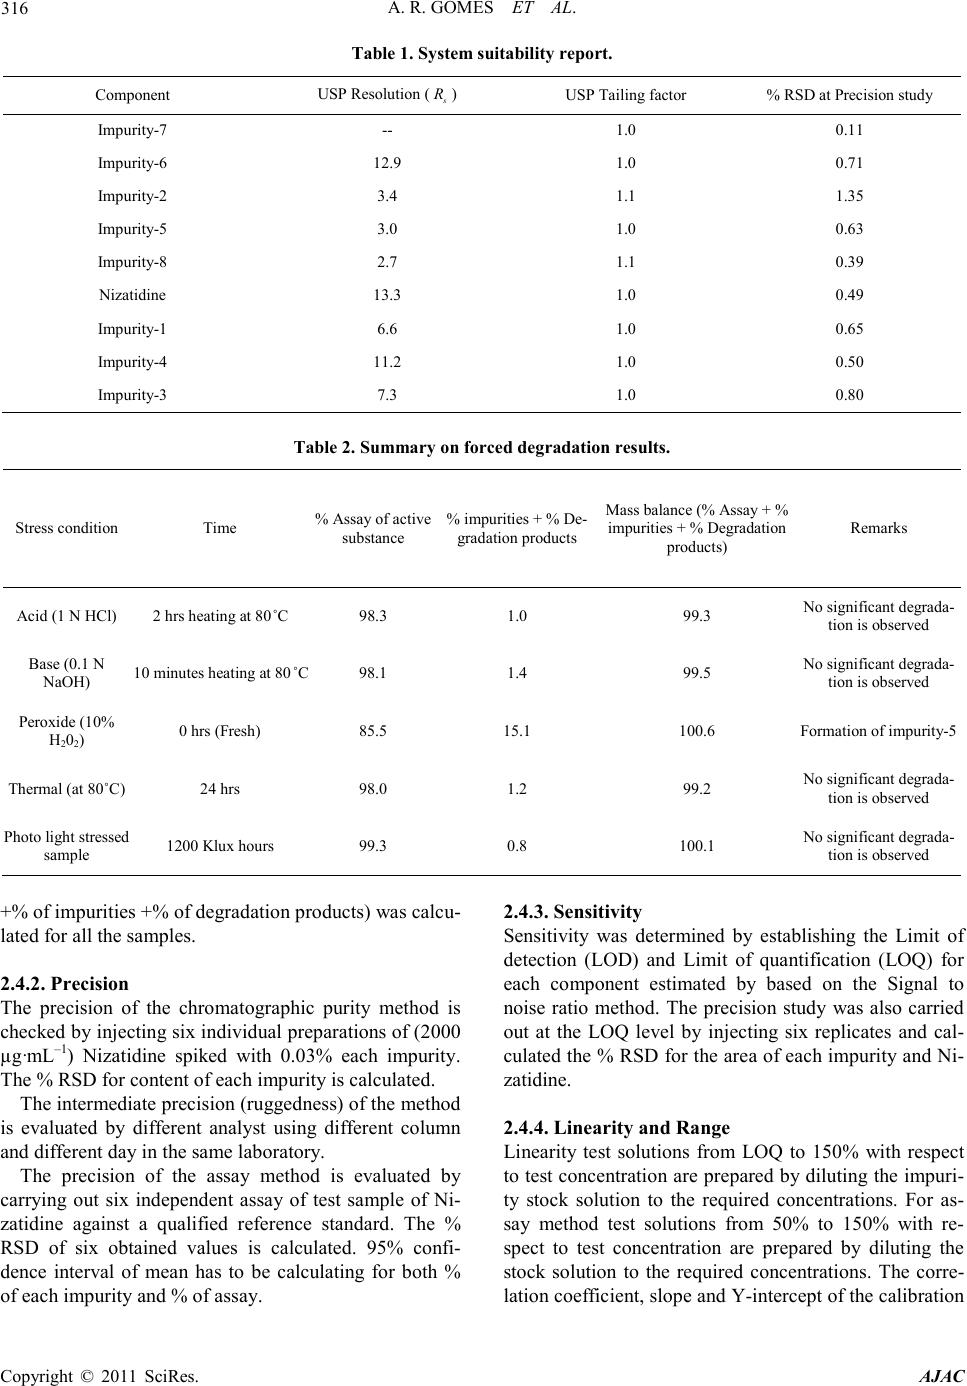
requireme n t s .( See Table 1)
2.4. Analytical Method Validation
The developed chromatographic method is validated for
specificity and stress studies, sensitivity, linearity &
range, precision, accuracy, and robustness and system
suitability for both chromatographic purity and assay
methods [7-15].
2.4.1. Specificity and Stress Studies
Specificity is the ability of the method to measure the
analyte response in the presense of its potential impuri-
ties. The specificity [10,11] of the developed LC method
for Nizatidine was determined in the presence of its im-
purities namely impurity-1, impurity-2, impurity-3, im-
purity-4, impurity-5, impurity-6, impurity-7 and impuri-
ty-8 at a concentration of 30 µg·mL–1. The stress condi-
tions employed for degradation study includes photolytic
(carried out as per ICH Q1B), thermal (80˚C), acid hy-
drolysis (1 N HCl), base hydrolysis (0.1 N NaOH), hy-
drolysis and oxidation (10% H2O2).Peak purity of
stressed samples of Nizatidine was checked by using
2996 Photo diode array detector of Waters (PDA). All
stressed samples of Nizatidine were analysed for an ex-
tended run time of 15 minutes to check the late eluting
degradants.
Assay was car ried out fo r stre ss sa mples a gai nst q uali-
fied reference standard and the mass balance (% assay
A. R. GOMES ET AL.
Copyright © 2011 SciRes. AJAC
316
Table 1. System suitability report.
Component USP R esolution (
s
R
) USP Tailing factor % RSD at P r ecision stud y
Impurity-7 -- 1.0 0.11
Impurity-6 12.9 1.0 0.71
Impurity-2 3.4 1.1 1.35
Impurity-5 3.0 1.0 0.63
Impurity-8 2.7 1.1 0.39
Nizatidine 13.3 1.0 0.49
Impurity-1 6.6 1 .0 0.65
Impurity-4 11.2 1.0 0.50
Impurity-3 7.3 1.0 0.80
Table 2. Summary on fo rced degradatio n results.
Stress condition Tim e % Assay of active
substa nc e % impurities + % De-
gradation products
Mass balance (% Assay + %
impurities + % Degradati on
products) Remar ks
Acid (1 N HCl) 2 hrs he at i ng at 80˚C 98.3 1.0 99.3 No signific ant degrada-
tion is observed
Base (0.1 N
NaOH) 10 minutes heating at 80˚C 98.1 1.4 99.5 No significant degra da-
tion is observed
Peroxide (10%
H202) 0 hrs (Fresh) 85.5 15.1 100.6 Formati on of impurity-5
Thermal ( at 80˚C) 24 hrs 98.0 1.2 99.2 No significant degra da-
tion is observed
Photo light st r essed
sample 1200 Klux hours 99.3 0.8 100.1 No signific ant degrada-
tion is observed
+% of impurities +% of degradation products) was calcu-
lated for all the samples.
2.4.2. Precision
The precision of the chromatographic purity method is
checke d b y inj ect ing si x i ndividual preparations of (2000
µg·mL–1) Nizatidine spiked with 0.03% each impurity.
The % RSD for content of each impurity is calculated.
The intermediate precis io n ( ru gge dnes s) o f t he me t ho d
is evaluated by different analyst using different column
and different day in the same laboratory.
The precision of the assay method is evaluated by
carrying out six independent assay of test sample of Ni-
zatidine against a qualified reference standard. The %
RSD of six obtained values is calculated. 95% confi-
dence interval of mean has to be calculating for both %
of ea ch impurity and % of a ssay.
2.4.3. Sensitivity
Sensitivity was determined by establishing the Limit of
detection (LOD) and Limit of quantification (LOQ) for
each component estimated by based on the Signal to
noise ratio method. The precision study was also carried
out at the LOQ level by injecting six replicates and cal-
culated the % RSD for the area o f each impurit y and Ni-
zatidine.
2.4.4. Linearity and Range
Linearity test solutions from LOQ to 150% with respect
to test concentratio n are prepared b y diluting the impur i-
ty stock solution to the required concentrations. For as-
say method test solutions from 50% to 150% with re-
spect to test concentration are prepared by diluting the
stock solution to the required concentrations. The corre-
lation coefficient, slop e and Y -intercept of the calibration
A. R. GOMES ET AL.
Copyright © 2011 SciRes. AJAC
317
(a)
(b) (c)
(d)
(e)
(f) (g)
(h) (i)
Figure 1. Chemical structures and labels of Nizatidine and its impurities. (a) Niz a t idi ne : N-(2-[(2-[(dimethyla mino)met hyl]
thiazol-4-yl)methyl thio]ethyl)-N-me t hyl -2-nitroet hene-1,1-diamine; (b) I mpurity-1: 4-chloromethyl-2-dimethylaminomethyl
thiazole.; (c) Impurity-2: 2-Dimethylaminomet hyl-4-hydroxymethylthi a zole .; (d) I mp u r i t y -3: N,
N-bis[2-[[[2-[(dimethyla mi n o ) -me th yl]-4-thiazolyl]methyl]thio]ethyl]-2-nitro-1, 1-ethenedia mine ; (e) I mpurity-4:
N-[2-[[[2-[( dimethylamino)methyl ]-4- thiazo lyl] methyl]thio]ethyl]-2-nitr o-1-thiomethyl etheneamine; (f) Impu r i t y -5:
2-[[[2-[(di met hylamino)methyl]-4-thiazolyl] methyl ] thio]e thyl-N’-met h y l -2-nitro-1, 1-ethenediamine.; (g) I mp ur i t y -6:
N-Me t hyl-S-me t h y l -2-nitr o e thene; (h) Impurity-7: Bis-N-methyl-2-nitro ethane; (i) Impur i t y-8:
N-me t h y l -N'-{2-[({2-[(methy lamino)methyl]-1, 3-thiazol-4-y l}methyl)sulfanyl] ethyl }-2-nitroet hene-1, 1-di amine .
A. R. GOMES ET AL.
Copyright © 2011 SciRes. AJAC
318
(a)
(b)
(c)
(d)
Figure 2. Ty pical chromat ogram of blank, st andar d soluti on and Niz atidi ne spike d with i mpu rities & O xidati on Stress s am-
ple Chromatograms.
curve are calculated for the both chromatographic purity
and a s s ay methods.
2.4.5. Accuracy
A known amount of the impurity stock solutions are
spiked to the previously analysed samples at LOQ, 100
and 150% of the analyte concentration (2000 µmL–1).
The percentage of recoveries for i mpurity-1, impurity-2,
impurity-3, impurity-4, impurity-5, impurity-6, imp urity-
7 and impurity-8 are calculated. A known amount of
A. R. GOMES ET AL.
Copyright © 2011 SciRes. AJAC
319
Table 3. Linearity table.
Component
Trendline equation
Ran g e (%)
Correlat ion coefficient
Residual sum of squares
Impurity-1 1750623
x
+ 9520 0.03 - 0.225 0.99990 3.50 15012852
Impurity-2
1975909
x
2112
0.03 - 0.225 0.999920.71 16484761
Impurity-3 3232271
x
11683 0.03 - 0.225 0.999882.45 64548028
Impurity-4 2371566
x
11417 0.03 - 0.225 0.999963.30 11639064
Impurity-5 3361838
x
+ 2813 0.03 - 0.225 0.99986 0.55 78624095
Impurity-6 2483388
x
3070 0.03 - 0.225 0.999880.83 37753954
Impurity-7 5166943
x
+ 13087 0.03 - 0.225 0.99978 1.64 297093973
Impurity-8 3692683
x
+ 3236 0.03 - 0.225 0.99992 0.59 57327237
Nizatid ine Chromatographic purity
5453849
x
710 0.02 - 0.15 0.999990.13 7728567
Assay determination 154040
x
292587 50 - 150 0.999980.96 17933996390
Table 4. Table for accuracy stu dy
Amount of impurity
added (µg) to the
100% sample
% of Recovery
Imp -1 Imp -2 Imp-3 Imp-4 Im p -5 Imp-6 Imp -7 Imp -8
Assay determination
Amount of sub-
stance added %Recovery
(Nizatid ine)
0.6 98.8 93.9 94.5 98.0 92.6 94.2 92.1 96.0 50% 99.2
3.0 91.9 103.1 104.3 106.3 99.0 105.7 104.4 102.2 100% 101.3
4.5 94.3 106.5 100.4 100.2 102.3 99.7 102.3 103.0 150% 100.5
Nizatidine stock solution spiked to the sucrose at 50%,
100% and 150% of the analyte concentration (200
µg·mL–1). Each concentration level is prepared for three
times. The percentage of recovery is calculated.
2.4.6. Robustness
To determine the robustness of the developed method,
experimental conditions are deliberately changed and the
resolution between each component is evaluated. The
flow rate of the mobile phase is 1.5 mL·min–1. To study
the effect of flow rate on the resolution, 0.2 units
changed i.e. 1.3 and 1.7 mL·min –1. The effect of column
temperature on resolution is studied at 25˚C and 35˚C
instead of 30˚C. The above all varied conditions done at
two single matrix analysis and the components of the
mobile phase were held constant.
2.4.6.1. Robustness Change 1 (Lower):
Flow rate—1.3 mL·mi n–1, Column oven temperature
–25˚C.
Gradient program is 0/4, 2/12, 7/37, 9/47, 10/4 and
12/4 ( time (min)/% B).
2.4.6.2. Robustness Change 2 (Upper ):
Flow rate—1.7 mL·min–1, Column oven temperature
–35˚C.
Gradient program is 0/0, 2/8, 7/33, 9/43, 10/0 and 12/0
(time (min)/% B).
2.4.7. Solution Stability and M obile Phase Stability
The solution stability of Niza tid ine and its relate d impur-
ities are carried out by leaving spiked sample solution in
tightly capped volumetric flask at room temperature for
48 h. Impurity conte nt is determined for every 6 h inter-
val up to the study period. Mobile phase stability is also
carried out for 48 h by injecting the freshly prepared
sample solutions for ever y 6 h interval. I mpurity content
and assay is checked in the test solutions. Mobile phase
prepar ed is kept co nstant during the study period.
3. Resul t s and Discussions
3.1. Specificity and Stress Studies
Stress studies on Nizatidine under different stress condi-
tions s uggest ed the fo llowi ng degra dation b ehavior. (See
Table 2)
3.1.1. Degradation in Ac i d Stress Co ndi tion
Nizatidine is exposed to 1 N HCl up on hea ting fo r 2 h at
A. R. GOMES ET AL.
Copyright © 2011 SciRes. AJAC
320
Table 5.1. Table f or bat c h analysis of assay.
Trial As per USP As per Ph.Eu r As per developed method
B.No-01 B.No-02 B.No-03 B.No-01 B.No-02 B.No-03 B.No-01 B.No-02 B.No-03
I 99.5 99.6 99.8 99.6 99.5 99.6 99.3 99.8 99.7
II 99.4 99.7 99.7 99.4 99.8 99.8 99.8 99.6 99.4
III
99.6
99.5
99.9
99.3
99.7
99.4
99.6
99.4
99.6
Ave rage 99.5 99.6 99.8 99.4 99.7 99.6 99.6 99.6 99.6
Stdev 0.10 0.10 0.10 0.15 0.15 0.20 0.25 0.20 0.15
% RSD 0.10 0.10 0.10 0.15 0.15 0.20 0.25 0.20 0.15
80˚C, no significant degradation is observed.
3.1.2. Degradation in Base Stress Condition
Nizatidine is exposed to 0.1 N NaOH upon heating for
10 minutes at 80˚C, no significant degradation is ob-
served.
3.1.3. Degradation in Peroxide Stress Condition
Nizatidine is more sensitive to the oxidative treatment,
Nizatidine is undergone degradation with 10% H2O2 of
fresh preparation and prominent degradation is observed
as impurity-5.
3.1.4. Degradation in Neutral (Water) Stress
Condition
Nizatidine is exposed water upon heati ng fo r 2 h a t 8 0 ˚C,
no degradation is observed.
3.1.5. Photolytic Stress Cond ition
Nizatidine is exposed to light for an overall illumination
of 1.2 million Klux hours and an integrated near ultra-
violet energy of 200-watt hours/square meter (w/mhr) (in
photo stability chamber), no significant degradation is
observed.
3.1.6. Thermal Str ess Condit i on
Nizatidine exposed to dry heat at 80˚C for 24 hours, no
degradation is observed.
The mass balance of stressed samples is close to
99.2%. The assay of Nizatidine is unaffected in the
presence of eight impurities a nd its degradation products
confirm the stability indicating power of the developed
method.
3.2. Method Validation
3.2.1. Precision
The % RSD of area of Nizatidine, impurity-1, impuri-
ty-2, impurity-3, impurity-4, impurity-5, impurity-6, im-
purity- 7 and impurity-8 and % RSD of area % of each
impurity in precision study are within 2.0 % confirming
the good precision of the developed analytical method.
The % RSD obtained in intermediate precision study for
Nizatidine, impurity-2, impurity-3, impurity-4, impuri-
ty-5, impurity-6, impurity-7 and impurity-8 are well
within 4.0%, confirmin g the intermediate precision of the
method. The % RSD obtained in precision and interme-
diate precision studies for Nizatidine are well within
1.0% of assay deter mi nat i on me t ho d .
95% confidence interval of mean calculated for both
chromatographic purity and assay results at precision
st u d y.
3.2.2. Sensitivity
The limit of detection of Nizatidine, impurity-1, impuri-
ty-2, impurity-3, impurity-4, impurity-5, impurity-6, im-
purity-7 and impurity-8 is 0.006% (of analyte concentra-
tion, i.e. 2000 µmL–1) for 10 µL injection volu me. The
limit of quantification of Nizatidine, impurity-1, impuri-
ty-2, impurity-3, impurity-4, impurity-5, impurity-6, im-
purity-7 and impurity-8 is 0.03% (of analyte concentra-
tion, i.e. 2000 µmL–1) for 10 µL inje ction vol ume. T he
% RSD for area of Nizatidine, impurity-1, impurity-2,
impurity-3, impurity-4, impurity-5, impurity-6, impuri-
ty-7 and impurity-8 are below 5 for precision at LOQ
level.
3.2.3. Linearity and Range
Calibration curve obtained by the least square regression
analysis between average peak area and concentration
showed linear relationship with a correlation coefficient
of 0.999 over the calibration ranges tested. Linear cali-
bration plot for chromatographic purity method is ob-
tained over the calibration ranges tested, i.e. LOQ to
0.225% for impurity-1, impurity-2, impurity-3, i mpurity-
4, impurity-5, impurity-6, impurity-7 & impurity-8 and
LOQ to 0.15% for Nizatidine. The correlation coefficient
obtained is greater than 0.999 for all eight impurities a nd
Nizatidine. The result shows an excellent correlation
existed between the peak area and concentration of Niza-
tidine and all i mpuritie s. Linear calibratio n plot for a ssa y
determination method is obtained over the calibration
ranges tested, i.e. 50% to 150% for Nizatidine and found
the correlation coefficient more than 0.9999.The results
shows an excellent correlation existed between the peak
area and concentration of Nizatidine in assay determina-
A. R. GOMES ET AL.
Copyright © 2011 SciRes. AJAC
321
Table 5.2. Table f or Batch analysis of Chromatographic purity
Comp one nt
B.No-01
As per USP As per Ph.Eu r As per developed method
Trial-I Trial-II Trial-III Trial-I Trial-II Trial-III Trial-I Trial-II Trial-III
Impurity-1 ND ND ND ND ND ND ND ND ND
Impurity-2 ND ND ND ND ND ND ND ND ND
Impurity-3 0.10 0.09 0.09 0.08 0.09 0.08 0.10 0.10 0.09
Impurity-4 0.04 0.03 0.04 0.03 0.04 0.05 0.05 0.05 0.04
Impurity-5 0.03 0.03 0.04 0.04 0.03 0.04 0.03 0.03 0.03
Impurity-6 ND ND ND ND ND ND ND ND ND
Impurity-7 0.03 0.03 0.02 0.03 0.02 0.03 0.03 0.03 0.03
Impurity-8 0.04 0.03 0.03 0.04 0.04 0.03 0.03 0.04 0.03
MSUI 0.04 0.04 0.05 0.04 0.03 0.03 0.05 0.05 0.04
TI 0.35 0.37 0.34 0.33 0.32 0.34 0.37 0.39 0.36
B.No-02
Impurity-1 ND ND ND ND ND ND ND ND ND
Impurity-2 ND ND ND ND ND ND ND ND ND
Impurity-3 0.09 0.08 0.08 0.08 0.08 0.08 0.09 0.08 0.08
Impurity-4 0.04 0.03 0.04 0.03 0.04 0.05 0.05 0.05 0.04
Impurity-5 0.03 0.03 0.04 0.04 0.03 0.04 0.03 0.03 0.03
Impurity-6 ND ND ND ND ND ND ND ND ND
Impurity-7 0.03 0.03 0.02 0.03 0.02 0.03 0.03 0.03 0.03
Impurity-8 0.04 0.04 0.03 0.04 0.04 0.04 0.04 0.04 0.03
MSUI 0.04 0.05 0.05 0.05 0.04 0.03 0.04 0.04 0.04
TI 0.33 0.32 0.34 0.35 0.37 0.36 0.33 0.31 0.34
B.No-03
Impurity-1 ND ND ND ND ND ND ND ND ND
Impurity-2 ND ND ND ND ND ND ND ND ND
Impurity-3 0.09 0.09 0.08 0.09 0.09 0.10 0.08 0.09 0.09
Impurity-4 0.04 0.04 0.04 0.04 0.04 0.03 0.04 0.03 0.05
Impurity-5 0.03 0.03 0.04 0.04 0.04 0.03 0.04 0.04 0.04
Impurity-6 ND ND ND ND ND ND ND ND ND
Impurity-7 0.03 0.02 0.03 0.02 0.03 0.03 0.03 0.03 0.02
Impurity-8 0.03 0.03 0.03 0.03 0.02 0.03 0.03 0.03 0.03
MSUI 0.05 0.06 0.06 0.04 0.06 0.05 0.06 0.05 0.05
TI 0.38 0.40 0.41 0.39 0.37 0.40 0.36 0.39 0.41
NDNot detect ed
A. R. GOMES ET AL.
Copyright © 2011 SciRes. AJAC
322
tion met hod ( Se e F igure 3, Table 3).
Theoretical response calculated for each component
with Trendline equation and also calculated residuals,
residual sum of squares and sensitivity plot (Response
for unit concentration) of each component. There is no
trend in resid uals and sensiti vity plot obta ined within the
specified range.
3.2.4. Accuracy
The percentage recovery of impu ri ty -1, impurity-2, im-
purity-3, impurity-4, impurity-5, impurity-6, impurity-7
and impurity-8, in Active pharmaceutical Ingredient
(API) samples ranged from 91.9 to 106.5. LC chromato-
gram of spiked sa mple with four impurities in Nizatidine
sample is shown in Figure 2(b). The percentage recov-
ery of Nizatidine in assay determination method ranged
from 99.2 to 101.3 (See Table 4).
3.2.5. Robustness
Close observation of analysis results for deliberately ch-
anged chromatographic conditions (flow rate and column
temperature) revealed that the resolution between closely
eluting impurities, namely impurity-5 and impurity-8 is
greater than 2.5, illustrating the robustness of the me-
thod.
And also done system precision and method precision
studies in robustness conditions. The % RSD of area of
Nizatidine, impurity-1, impurity-2, impuri-
ty-3,impurity-4, impurity-5, impurity-6, impurity-7 and
impurity-8 and % RSD of area % of each impurity in
robustness study for replicate injections and preparations
(
3n=
) are within 5.0% confirming the good precision
of method in robustness conditions.
3.2.6. Solution Stability and M obile phase Stability
The % RSD of a ssay o f Nizati d ine during sol utio n stabil-
ity and mobile phase stability experiments is within 1.0.
No significant changes are observed in the content of
Figure 3 . Typical chart for comparison of system suitability
parameters in Robustness condition with as such condition
(Medium).
impurity-1, impurity-2, impurity-3, impurity-4, imp urity-
5, impurity-6, impurity-7 and impurity-8 during solution
stability and mobile phase stability experiments. The
solution stability and mobile phase stability experiments
data confirms that sample solutions and mobile phase
used c hro mato grap hic p ur ity a nd a ssay d etermination are
stable up to the study period of 48 h.
3.2.7. Comparative analysis
Three consecutive batches are selected and analyzed as
per USP, Ph.Eur methods as well as developed method
for both chromatographic purity and assay by HPLC for
three times and the percentage of each impurity and as-
say results are compared for three methods. The USP and
Ph.Eur methods results are comparable with the new
developed method (See Table 5).
4. Conclusions
The Stability indicating fast LC method for Nizatidine
and its impurities Quantification is developed and vali-
dated as per ICH requirements. The gradient RRLC me-
thod developed and used for stress studies is also fit for
quantitative, chromatographic purity and assay determi-
nation of Nizatidine. The developed method is stability
indic ati ng whi ch c an b e use d fo r the imp urit y te sting and
assay determination in routine analysis of production
samples and also to analyze stability samples.
5. Acknowledgemen t s
The authors wish to thank the management of Shasun
chemicals and drugs Limited for supporting this work.
6. References
[1] M. Atmaca, M. Kuloglu, E. Tezcan, B. Ustundag and N.
Kilic, “Nizatidine for the Treatment o f Patients with Que-
tiapine-Induced Weight Gain,” Hum Psychopharmacol,
Vol. 19, No. 1, 2004, pp. 37-40. doi:10.1002/hup.477
[2] P R Ne ws wir e, “Eli Lilly and Company and Reliant Phar-
maceuticals Announce Agreement for U.S. Sales and
Marketing Rights to Axid (R),” Indianapolis, September
7, 2000.
[3] F. Parente and G. B . Porro, Acid In hib itory Char acteris-
tics of Nizatidine in Man: An Overview,Scandinavian
Journal of Gastroenterology, Vol. 29 , No. s206, 1994, pp.
3-7. doi:10.3109/00365529409091413
[4] The United States Pharmacopoeia 32 National Formulary
27. (US P)
[5] European Pharmacopoeia 4.2, Council of Europe, 2002,
pp. 2737-2739.
[6] U. D. Neue, D. McCabe, V. Ramesh, H. Pappa, J. De-
Muth, “Transfer of HPLC Procedures to Suitable Col-
A. R. GOMES ET AL.
Copyright © 2011 SciRes. AJAC
323
umns of Reduced Dimensions and Particle Sizes,Phar-
macopeial Forum, Vol. 35, No. 6, 2009, pp.1622 -1626.
[7] In ternati onal Conference on Harmonization (ICH), “Sta-
bility Testing of New Drug Substances and Products,
ICH Topic Q1A (R2), ICH Secr etariat, Ge ne va, 2005.
[8] International Conference on Harmonization (ICH), “P ho-
tostability Testing of New Drug Substances and Prod-
ucts,” ICH Q1B Guidline, ICH Secretariat, Geneva, 2005.
[9] S. W. Baertschi, K. Alsante and R. A. Reed, “Pharma-
ceutical Stress Testing: Predicting Drug Degradation,”
Drugs and the Pharmaceutical Sciences, Vol. 153, 2005,
pp. 1- 482. doi:10.1201/9780849359194.ch3
[10] US FDA guidance, “Analytical Procedures and Methods
Validation,” Food and Drug Administration, Rockville,
2000.
[11] The United States Pharmacopeial Convention, “Valida-
tion of Compendial Methods <1225>,” The Uni ted States
Pharmacopeia, Rockville, 2009.
[12] M. E. Swartz and I. S. Krull, “Developing and Validating
Stability-Indicating Methods by Michael Swartz and Ira
Krull,” LC-GC North America, 2005.
[13] International Conference on Harmonization (ICH), “Va-
lidation of Analytical Procedures: Text and Methodolo-
gy,” Q2 (R1), ICH Secretariat , Geneva, 2005.
[14] J. Ermer and J. H. McB. Miller, “Method Validation in
Pharmaceutical Analysis: A Guide to Best Practice,Wi-
ley-VCH, enero, 20 05.
[15] D. M. Bliesner, “Validating Chromatographic Methods:
A Practical Guide,” Wiley, Hoboken, 2006, pp.1-304.