 Low Carbon Economy, 2015, 6, 64-72 Published Online June 2015 in SciRes. http://www.scirp.org/journal/lce http://dx.doi.org/10.4236/lce.2015.62008 How to cite this paper: Zhang, Q. and Mei, D.X. (2015) An Empirical Research on Interactive Relationship of Urban Housing Prices in China: Analysis of Six Major Cities. Low Carbon Economy, 6, 64-72. http://dx.doi.org/10.4236/lce.2015.62008 An Empirical Research on Interactive Relationship of Urban Housing Prices in China: Analysis of Six Major Cities Qian Zhang, Dexiang Mei* School of Economics and Management, Southwest Jiaotong University, Chengdu, China Email: *530070504@qq.com Received 25 May 2015; accepted 21 June 2015; published 24 June 2015 Copyright © 2015 by authors and Scientific Research Publishing Inc. This work is licensed under the Creative Commons Attribution International License (CC BY). http://creativecommons.org/licenses/by/4.0/ Abstract This paper applies non-linear granger causality test and impulse response function method to analyze the spillover effect of housing prices fluctuation among six major Chinese cities, namely, Beijing, Shanghai, Guangzhou, Shenzhen, Tianjin and Chongqing. Results indicate that fluctuation of urban housing prices in the short term is a wide range of positive spillover effect, and then the effect will gradually disappear. The spillover effect of housing prices fluctuation and cities’ space distance do not necessarily exist relationship; at the same time, Shanghai housing price fluctua- tion has a great influence on other cities generally. Accordingly, relevant policy sugges tions are put forward. Keywords Housing Prices, Spillover Effect, Non-Linear Granger Test, Impulse Response Function 1. Introduction Real estate industry drives relevant industries at a strong degree, plays an important role in driving China’s eco- nomic development and improves people’s living standard. The level of real estate price not only determines whether the real estate industry can develop healthily, but also has an impact on relative industry development, economic development, resident life quality, country financial security, etc. In particular, it will have a huge impact on social fairness and stability. Since 1998, when the real estate industry carried out market-oriented reform, China’s real estate industry has always maintained the rapid development of strength. At the same time, housing prices generally present the fast *  Q. Zhang, D. X. Mei growth momentum. In 2014, the growth of many cities’ housing prices slows down or even falls, which once again inspires people to debate whether the real estate market enters a turning point. These cities’ housing prices’ changes will affect housing prices fluctuation of other areas or not, whether there are internal relations among housing prices’ fluctuation of different areas, and whether it is affected by a certain mechanism is worth explor- ing. 2. Literature Review In existing literature, the earliest scholar who researched the fluctuation relationship of house prices was Hol- mans [1], analyzed and calculated the 90s and 1960s’ British regional housing prices, found the propensity for housing prices to change first predominantly London in the south of the country and gradually impacted from south to north across the UK housing prices fluctuations, and defined it as the “ripple effect” of housing prices. “ripple effect” was a kind of special form of housing prices fluctuation spillover effect, it indicated the long-term relationships that some areas’ housing price fluctuations drived by the center city/core region and have a conduction effect on other cities/regions’ housing prices fluctuations. Among other scholars research on housing prices, a similar phenomenon was called diffusion effect, space effect or ripple effect. In this article, this kind of phenomenon was called “housing prices fluctuation spillover effect”, namely, the housing market prices fluctuation of a region would affect another region prices fluctuations. In recent years, domestic and foreign scholars used different methods to research and explore real estate price fluctuation spillover effect. Hui [2] applied co-integration test and granger causality test method, found housing prices changes exist mutual influence among three cities in Malaysia. Holly and Pesarana [3] used the spatial econometric methods, under the condition of controlling the influence of real income and other factors, analyzed the 49 states housing data of 29 years, found space factors still have important effects on housing prices fluctua- tions. Bandt, Barhoumi and Bruneau [4] expanded this kind of research to the oecd member countries, suggested that the real house prices directly or indirectly affect the prices of other countries. Lee and Chien [5] analyzed the regional housing prices in 1993-2009 in Taiwan area by using the latest methods of unit root test. The result showed that housing prices had significantly diffusion effect in other regions except Taipei. At the same time deemed it is caused by a smaller public housing and the housing presale system. Simo-Kengne, Bittencourt and Gupta [6] examined the influence of South Africa’s nine provinces prices on economic development, set up space SUR model, showed that space effect was a very important factor to affect housing prices. Lean and Smyth [7] investigated the relationship of the price index in Malaysia 14 regional five different building types by using single factor and panel LM unit root test method, and found that Malaysia’s regional housing prices passed from the most developed regions to the less developed areas. The study of Ferrari and Rae [8] considered migration, especially the selective migration, impacted the UK housing prices space differentiation. Liu and Roberts [9] from the perspective of counter urbanization examined interdependent relationship between the re- gional house prices in Hong Kong by using vector error model. The results showed that the diffusion effect of Hong Kong housing prices from city center to rural areas was greater than the inverse process of urbanization. Zhu and other scholars [10] researched yields of non-system risk and volatility of the spacespace relationship of 19 U.S. regional housing markets in 1995-2009. The result showed that the linkage of the whole market not only affected adjacent space regions, also affected the similar economic level region; At the same time due to the spread of the subprime crisis, made the space influence of whole housing market more strongly. Scholars in the study of Chinese regional housing prices fluctuation spillover was still in the exploratory stage, mainly concentrated in the validation of whether China’s regional housing prices volatility spillover effect exists, only a minority of scholars further study on the space diffusion path of housing prices. Liang and Gao [11] in the perspective of regional differences found that housing prices fluctuation in the area are different. At the same time, through empirical analysis, found that the regional price differences are mainly caused by the effect of monetary policy and the differences in expectations of housing prices. Hong et al. [12], on the basis of panel da- ta model, used CSD inspection to analyze the residual further, concluded that there are correlations between dif- ferent cities real estate prices. Li [13] through IVQR and spatial econometric analysis, pointed out that urban housing prices in China rose in the whole performance, mainly due to price changes inertia, demand-driven and housing prices change “ripple effect”. Meanwhile, the effect of inflation would lead to less ripple effect. Wang and Liu [14] used the impulse response function to analysis Beijing, Shanghai, Tianjin and Chongqing housing prices data bubble and found that four cities housing prices bubble have widespread spillover effects, but had  Q. Zhang, D. X. Mei significant differences in influencing direction and strength. Liang and Xing [15] utilized the dynamic factor model to analyse housing prices fluctuation factor of 26 large and medium cities, showed that the regional cha- racteristics of the regional factor had great influence on regional cities prices fluctuation. Simultaneously, Chi- na’s cities prices fluctuation presented the “ripple effect”, which spread from eastern developed regions to the central and western regions. From the above studies both at home and abroad, foreign scholars study are more abundant. They proved that the housing prices fluctuation spillover effect widely exists in various countries and regions through a variety of methods. Moreover, some scholars further found that housing prices fluctuation are mostly driven by economic or real estate developed region to undeveloped region. However, domestic related literature is relatively small, the existing research mainly focus on the use of statistical test and space measurement method to test whether China regional housing prices fluctuation spillover effects exist. Furthermore, specific conduction path for the housing prices fluctuation spillover of research and analysis on domestic is almost none. Based on the above reasons, this paper made further researches, by using DCC MVGARCH model to study dynamic correlations among different China’s cities housing prices fluctuation and to explore the conduction relationship among China’s cities prices fluctuation fluctuation spillover. 2.1. Research Method Introduction 2.1.1. Nonlinear Granger Test Method Bake and Broch [16] study found that the results when using the method of linear causality test analysis in ex- amining the nonlinear causality was not accurate. Thus, they proposed a new nonparametric statistical methods to examine the nonlinear relationship of things by introducing the concept of spatial probability. On this basis, Hiemstra and Jones [17] allowed variables to have weak dependence, so as to enhance the scope of the nonlinear test method. Their proposed nonlinear Granger test is as follows. The nonlinear Granger test is firstly assumed that the sum is two stationary time series and then defined: Is a leading sequence m phase vector, namely, m = 1, 2, …; T = 1, 2, … Is a sequence Lx phase vector, namely the Lx = 1, 2, …; T = Lx + 1, Lx + 2, … Is a sequence Ly phase vector, namely Ly = 1, 2, …; T = Ly + 1, Ly + 2, … For a given m, Lx, Ly 1 ≥ 1, and the interval parameter e > 0. Conditions of null hypothesis “Y (strict) is not nonlinear granger reason of X” establish: Among them, on behalf of the probability function, on behalf of the vector norm. According to the definition of conditional probability formula and the definition of the maximum norm, the type () can be further defined: The ratio of the joint probability distribution of the type () can be further simplified: Makes the Kernel function is 1 when the distance of maximum norm is between variables and the variables and falls within the scope of e, not in e is 0. So further expand the type (), can get: Among them, using the Kernel function eliminate values of variables maximum norm which fell outside the scope of e. Thus, if the sequence sum is a strictly stationary and weakly dependent assumption, using the joint probability value in the type () can convert the test of null hypothesis “Y (strict) is not nonlinear granger reason of X” in the type () to test whether the type () is set up. The significance of the positive test statistic in the type () indicates that the lag value of Y is good for the pre- diction of X, but the significant negative test statistic shows that the information in the lag of Y interferes with the prediction of X. Therefore, when test causality exists, test statistics in the type () shall be calculated accord- ing to according to the critical value of the right tail inspection. 2.2. Data Introduction Beijing, Shanghai, Guangzhou, Shenzhen, Tianjin and Chongqing, the six cities hold important positions in China’s economic development and real estate industry development, the changes in these cities’ housing prices have been received extensive attention of the society. Therefore, this paper selects the six representative cities to study the spillover relationship of the housing prices fluctuation. According to the availability of data, in this paper, the sample interval of empirical analysis is July 2005 to November 2014, a total of 113 sets of data. Data is from where national bureau of statistics of China published monthly new commodity housing sales price index in 70 large and medium cities housing prices data (Last  Q. Zhang, D. X. Mei month = 100), and through simple calculation convert into the cities’ housing prices monthly rate. Table 1 shows the main descriptive statistics of the sample. 3. Empirical Analysis and Results 3.1. Unit Root Test Before using the empirical analysis of nonlinear granger causality test, according to the Hiemstra and Jones [17] study, the housing prices fluctuation sequence of each city need to be carried out unit root test separately at first. The results are shown in Table 2. All time series have rejected “existence unit root” null hypothesis according to the results of test. So the four variables that this paper need are stable, the nonlinear granger test analysis can be further expanded. 3.2. Nonlinear Granger Causality Test With the continuous development of nonlinear research in recent years, the existing research shows that when the time series exist nonlinear changing trend, the traditional granger causality test may not be able to discriminate whether there is a causal relationship of variables accurately, or lead to a significant deviation of conclusions. So, in order to investigate the transitive relationship of the six cities’ housing prices fluctuation in Beijing, Shanghai, Guangzhou, Shenzhen, Tianjin and Chongqing, this paper applies the nonlinear granger causality test method to study the nonlinear relationship of cities housing prices fluctuations. To test whether there is “strictly” nonlinear relationship in the sequence, this paper uses VAR model to conduct the sequence “linear filtering” and further test the filtered residual sequence. In addition, results are very sensitive to the choice of lag period in causality test, so in order to display the nonlinear relationship of the four cities’ housing prices fluctuation completely, this paper lists results of the nonlinear granger causality test based on common lag periods () 1 to 6 in Table 3. Table 3 shows that Beijing’s housing price fluctuation is influenced by the two cities which are Shenzhen and Tianjin in one-way, the price fluctuations of Beijing, Guangzhou and Shanghai have a one-way causality on Chongqing market, at the same time, the price fluctuation of Guangzhou has a striking impact on Shanghai Table 1. Descriptive statistics data. Beijing Shanghai Guangzhou Shenzhen Tianjin Chongqing Mean 0.0060 0.0021 0.0044 0.0039 0.0040 0.0030 Minimum −0.0130 −0.0260 −0.0310 −0.0560 −0.0110 −0.0290 Std. Dev. 0.0090 0.0090 0.0113 0.0122 0.0059 0.0098 Skewness 1.1045 0.4138 −0.2780 −1.7573 0.6076 2.0242 Kurtosis 5.8097 4.3599 4.1211 9.7894 5.8150 14.8199 Jarque-Bera 61.2121*** 12.1440*** 7.5040** 280.0625*** 45.0466*** 747.9780*** Observations 115 115 115 115 115 115 Remarks: ***, ** and * respectively at the 1%, 5% and 10% significant level to reject the null hypothesis. Table 2. Results of unit root test. ADF test statistic PP test statistic t-statistic Prob (P) Adj. t-Stat (T) Prob (P) Beijing −2.7218* 0.0735 −3.9955*** 0.0020 Shanghai −3.6242*** 0.0067 −3.8426*** 0.0034 Guangzhou −4.6432*** 0.0002 −4.8213*** 0.0001 Shenzhen −4.3637*** 0.0006 −4.2771*** 0.0008 Tianjin −5.0403*** 0.0000 −5.3114*** 0.0000 Chongqing −4.8645*** 0.0001 −4.6532*** 0.0002 Remarks: ***, ** and * respectively at the 1%, 5% and 10% significant level to reject to exist unit root null hypothesis.  Q. Zhang, D. X. Mei Table 3. Nonlinear granger causality test based on VAR linear filtering. Null hypothesis Lx = Ly P statistics T statistics Null hypothesis Lx = Ly P statistics T statistics Beijing Shanghai 1 0.0605* 1.5508 Shanghai Beijing 1 0.0655* 1.5099 2 0.1699 0.9544 2 0.0929* 1.3230 3 0.1863 0.8915 3 0.0746* 1.4426 4 0.2264 0.7507 4 0.1134 1.2088 Null hypothesis Lx = Ly P statistics T statistics Null hypothesis Lx = Ly P statistics T statistics Beijing Guangzhou 1 0.1018 1.2714 Guangzhou Beijing 1 0.0138** 2.2028 2 0.0487** 1.6577 2 0.0109** 2.2946 3 0.0167** 2.1277 3 0.0083*** 2.3937 4 0.0416** 1.7320 4 0.0304** 1.8747 Null hypothesis Lx = Ly P statistics T statistics Null hypothesis Lx = Ly P statistics T statistics Beijing Shenzhen 1 0.3284 0.4443 Shenzhen Beijing 1 0.1486 1.0423 2 0.1723 0.9452 2 0.1501 1.0359 3 0.1285 1.1335 3 0.0876* 1.3556 4 0.1627 0.9834 4 0.0888* 1.3483 Null hypothesis Lx = Ly P statistics T statistics Null hypothesis Lx = Ly P statistics T statistics Beijing Tianjin 1 0.8162 −0.9008 Tianjin Beijing 1 0.0378** 1.7766 2 0.1788 0.9201 2 0.0129** 2.2294 3 0.2979 0.5304 3 0.0327** 1.8424 4 0.2123 0.7986 4 0.0401** 1.7490 Null hypothesis Lx = Ly P statistics T statistics Null hypothesis Lx = Ly P statistics T statistics Beijing Chongqing 1 0.0138** 2.2030 Chongqing Beijing 1 0.1274 1.1389 2 0.0181** 2.0954 2 0.4412 0.1479 3 0.0395** 1.7565 3 0.3687 0.3352 4 0.0430** 1.7171 4 0.4819 0.0454 Null hypothesis Lx = Ly P statistics T statistics Null hypothesis Lx = Ly P statistics T statistics Shanghai Guangzhou 1 0.6437 −0.3683 Guangzhou Shanghai 1 0.0130** 2.2255 2 0.2140 0.7927 2 0.0040*** 2.6514 3 0.2614 0.6390 3 0.0062*** 2.4995 4 0.3056 0.5084 4 0.0038*** 2.6667 Null hypothesis Lx = Ly P statistics T statistics Null hypothesis Lx = Ly P statistics T statistics Shanghai Shenzhen 1 0.3012 0.5208 Shenzhen Shanghai 1 0.1193 1.1783 2 0.0378** 1.7766 2 0.1522 1.0271 3 0.0348** 1.8142 3 0.2551 0.6586 4 0.0524* 1.6217 4 0.0579* 1.5722 Null hypothesis Lx = Ly P statistics T statistics Null hypothesis Lx = Ly P statistics T statistics Shanghai Tianjin 1 0.0299** 1.8819 Tianjin Shanghai 1 0.0845* 1.3752  Q. Zhang, D. X. Mei Continued 2 0.0035*** 2.6944 2 0.1340 1.1077 3 0.0029*** 2.7575 3 0.0921* 1.3278 4 0.0153** 2.1629 4 0.0867* 1.3614 Null hypothesis Lx = Ly P statistics T statistics Null hypothesis Lx = Ly P statistics T statistics Shanghai Chongqing 1 0.0876* 1.3559 Chongqing Shanghai 1 0.6513 −0.3889 2 0.0299** 1.8828 2 0.1085 1.2345 3 0.1297 1.1276 3 0.2893 0.5556 4 0.1070 1.2424 4 0.3169 0.4764 Null hypothesis Lx = Ly P statistics T statistics Null hypothesis Lx = Ly P statistics T statistics Guangzhou Shenzhen 1 0.0198** 2.0585 Shenzhen Guangzhou 1 0.1567 1.0080 2 0.1042 1.2580 2 0.0176** 2.1059 3 0.0167** 2.1281 3 0.0302** 1.8784 4 0.0686* 1.4866 4 0.0244** 1.9711 Null hypothesis Lx = Ly P statistics T statistics Null hypothesis Lx = Ly P statistics T statistics Guangzhou Tianjin 1 0.0746* 1.4425 Tianjin Guangzhou 1 0.1245 1.1526 2 0.1028 1.2655 2 0.1082 1.2364 3 0.0431** 1.7157 3 0.0175** 2.1074 4 0.0660* 1.5064 4 0.0875* 1.3563 Null hypothesis Lx = Ly P statistics T statistics Null hypothesis Lx = Ly P statistics T statistics Guangzhou Chongqing 1 0.0959* 1.3055 Chongqing Guangzhou 1 0.5758 −0.1912 2 0.0333** 1.8345 2 0.1818 0.9087 3 0.0366** 1.7914 3 0.3411 0.4095 4 0.0356** 1.8038 4 0.1366 1.0956 Null hypothesis Lx = Ly P statistics T statistics Null hypothesis Lx = Ly P statistics T statistics Shenzhen Tianjin 1 0.1438 1.0636 Tianjin Shenzhen 1 0.0924* 1.3264 2 0.3599 0.3587 2 0.0307** 1.8709 3 0.0705* 1.4721 3 0.0293** 1.8913 4 0.0519* 1.6266 4 0.0246** 1.9669 Null hypothesis Lx = Ly P statistics T statistics Null hypothesis Lx = Ly P statistics T statistics Shenzhen Chongqing 1 0.7757 −0.7579 Chongqing Shenzhen 1 0.3497 0.3862 2 0.2786 0.5869 2 0.2883 0.5583 3 0.2684 0.6175 3 0.0399** 1.7521 4 0.1012 1.2748 4 0.0335** 1.8314 Null hypothesis Lx = Ly P statistics T statistics Null hypothesis Lx = Ly P statistics T statistics Tianjin Chongqing 1 0.0471** 1.6732 Chongqing Tianjin 1 0.0765* 1.4293 2 0.0176** 2.1065 2 0.0468** 1.6772 3 0.0496** 1.6489 3 0.0660* 1.5064 4 0.0145** 2.1826 4 0.0683* 1.4888  Q. Zhang, D. X. Mei market, Chongqing has a remarkable one-way nonlinear effect on the price fluctuations of Shenzhen. Besides, there are significant two-way causal relationships among among other cities housing prices fluctuations. Collectively, through the nonlinear granger causality test to investigate China’s six major cities housing prices fluc tua tion spillover effect, can find the following characteristics: 1) there is significant spillover effect among housing prices fluctuation; 2) the spillover effect exists is not necessarily related, may also be affected with the space distance, may also be affected by other factors such as economic level; 3) the price fluctuation spillover of the housing market has some asymmetry. Because the nonlinear Granger causality test can only examine the transmission direction of cities housing prices fluctuation spillover effect from the statistical perspective, need to further use the impulse response func- tion to identify the impact strength and direction of the spillover effect. Impulse response function is an efficient tool to research housing prices spillover effect. It can track the dynamic effect of each house price fluctuation variables impact on system. The most commonly used method is to use Cholesky to decompose residual cova- riance matrix to obtain the corresponding orthogonalization pulse, however the Cholesky decomposition results depend heavily on the order of the variables in the model. The generalized impulse response function proposed by Koop et al (1996) effectively overcome the above shortcomings. Therefore, we use generalized impulse re- sponse function to investigate the regional spillover effect of residential real estate market. The result is shown in Figure 1. Overall, the impact of housing prices fluctuation in the six major cities is more remarkable in the short term. However, after the eighth basically stable stage and the response almost disappear at the same time, this shows the long-term impact of spillover effects is not obvious. Combined with the analysis of Figure 1, we found that there is a wide spillover effect among cities housing prices fluctuations, but there are some differences in inten- sity and direction. Firstly, the impact of housing prices fluctuation in all cities has the biggest impact on their market, especially the influence of the former two periods impact is significant compared with other cities, but the pace of decline is more quickly. Secondly, the impact of cities housing prices fluctuation influenced by ex- ternal shocks in stage 2 and 3 is general maximum, then gradually decreases, and the influence gradually disap- pear after the eighth period. So we take phase 2 and 3 as an example, report the impact of cities housing prices fluctuation on other cities real estate market. Beijing housing market is subject to external shocks mainly from Shanghai and Guangzhou. Shanghai housing prices fluctuation has the biggest impact on the market of Chongq- ing. The biggest impact on the housing prices fluctuation in Shanghai is subject to the Guangzhou and Shenzhen real estate market, followed by Beijing and Tianjin. Each city housing prices fluctuation can have a certain in- fluence on Shanghai real estate market, but they are much smaller than the impact of prices fluctuations from Shanghai itself. Shenzhen influenced the impact of Guangzhou housing prices fluctuation in stage 2 is maximum, but in the third period Guangzhou, Shanghai and Chongqing have a greater impact on the housing prices fluctu- ationin Shenzhen. The largest spillover effects of Tianjin real estate market price fluctuations in stage 2 is from Beijing, and it is greater than the effect of its impact in Tianjin, and the Guangzhou and Shanghai housing prices fluctuationin the third phase will also have strong impact on the Tianjin market. Finally, in addition to Chongq- ing has a strong negative spillover effect on the Guangzhou market in the third period, there are obvious positive spillover effects among the rest of the cities’ housing prices fluctuations. Through the investigation, we can get the following characteristics of the six major cities housing prices fluc- tuations: 1) the housing prices fluctuation spillover effects are more obvious in the short term; 2) the housing prices fluctuation of Shanghai has a great influence on other cities generally, this may be related to its strong economic development level; 3) there is significant positive spillover effect among housing prices fluctuations; 4) the biggest impact of cities housing prices fluctuation generally comes from their own. 4. Conclusions This paper selects six major cities, namely, Beijing, Shanghai, Guangzhou, Shenzhen, Tianjin and Chongqing, as the research object, using the nonlinear granger test and generalized impulse response function to analyze the new commodity housing price index for monthly of six cities in July 2005 to January 2015 and to investigate the six cities’ housing price fluctuation spillover effect. Research shows that: 1) cities’ housing prices fluctuation in the short term is a wide range of positive spillover effect, and then the effect will gradually disappear; 2) the spillover effect of housing prices fluctuation and ci- ties’ space distance do not necessarily exist relationship, and may also be affected by factors such as eco- 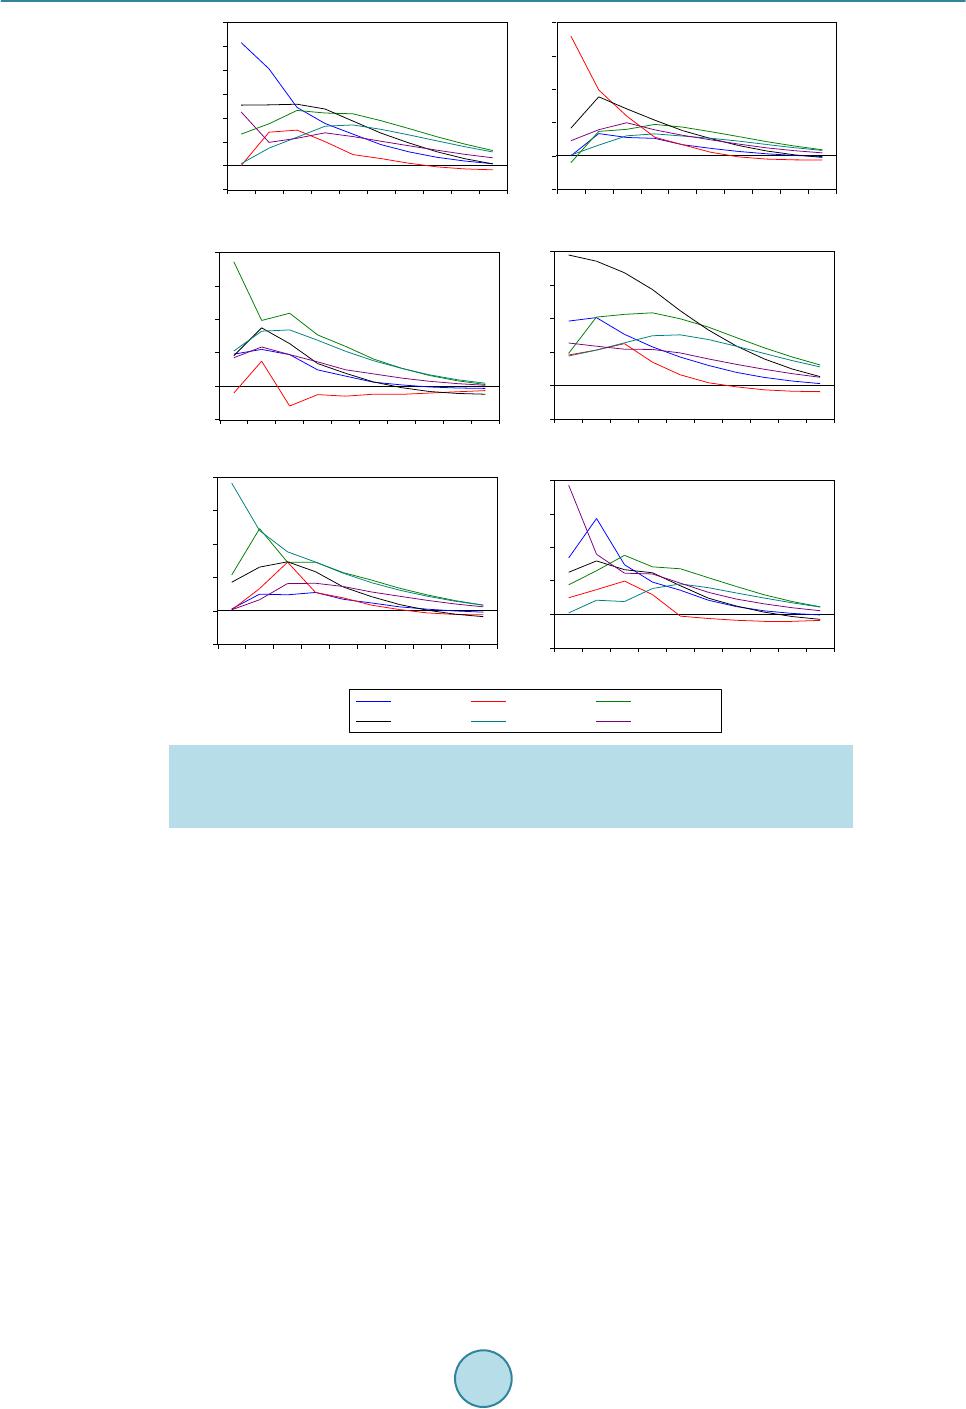 Q. Zhang, D. X. Mei -.001 .000 .001 .002 .003 .004 .005 .006 12345678910 1-1 -.002 .000 .002 .004 .006 .008 123456 7 8910 1-2 -.002 .000 .002 .004 .006 .008 12345678910 1-3 -.001 .000 .001 .002 .003 .004 12345678910 1-4 -.002 .000 .002 .004 .006 .008 1 2 345678910 -.001 .000 .001 .002 .003 .004 1 2 3 4 5678910 Beijing Chongqing Guangzhou Shanghai Shenzhen Tianjin 1-6 1-5 Figure 1. Generalized impulse response function analysis results. Remarks: 1-1, 1-2, 1-3, 1-4, 1-5, 1-6 are the generalized impulse response function graphs which represent respectively Beijing, Chongqing, Guangzhou, Shanghai, Shenzhen, Tianjin is impacted by the other city housing prices fluctuation compositions. nomic development level; 3) Shanghai has a great influence on other cities generally, and this may be related to its strong economic development level. This study is not only conducive to the relevant government departments for the housing market macroeconomic regulation and control, regional and systemic risk prevention, but also good for the housing market participants to risk management. Based on the above research conclusions, this paper has the following suggestions: F i r st , the stability of the real estate regulation and control policies should be kept as far as possible. This is beneficial to avoid sharp fluctuations in housing prices to maintain the steady and healthy development of the real estate market; the second is to strengthen the central government unified guidance for real estate regulation at the same time, ac- cording to the actual situation of different areas of the real estate market development, strengthening the guid- ance and audit of local rules for regulation and control policies, i.e. to adjust measures to local conditions to avoid the “one size fits all”, and to prevent the local government in disguise to resist the policy of regulation; the third is to strengthen real estate regulation and control of the areas where housing prices fluctuate dramatically and have obvious spillover effects, to avoid that the housing price fluctuation spillover effect causes other hous- ing markets’ fluctuation, which is beneficial to the stability of the entire housing market and the prevention of regional and systematic real estate risks. References [1] Holmans, A.E. (1990) House Prices: Changes through Time at National and Sub-National Level. Department of the  Q. Zhang, D. X. Mei Environment, London. [2] Hui, H.-C. (2010) House Price Diffusions across Three Urban Areas in Malaysia. International Journal of Housing Markets and Analysis, 3, 369-379. http://dx.doi.org/10.1108/17538271011080664 [3] Holly, S., Hashem Pesarana, M. and Yamagata, T. (2010) A Spatio-Temporal Model of House Prices in the USA. Journal of Econometrics, 158, 160-173. http://dx.doi.org/10.1016/j.jeconom.2010.03.040 [4] De Bandt, O., Barhoumi, K. and Bruneau, C. (2010) The International Transmission of House Price Shocks. Springer, Berlin, 129-158. http://dx.doi.org/10.1007/978-3-642-15340-2_7 [5] Lee, C.-C. and Chien, M.-S. (2011) Empirical Modelling of Regional House Prices and the Ripple Effect. Urban Stu- dies, 48, 2029-2047. http://dx.doi.org/10.1177/0042098010385257 [6] Simo-Kengne, B.D. , Bittencourt, M. and Gupta, R. (2012) House Prices and Economic Growth in South Africa: Evi- dence From Provincial-Level Data. Journal of Real Estate Literature, 20, 97-117. [7] Lean, H.H. and Smyth, R. (2013) Regional House Prices and the Ripple Effect in Malaysia. Urban Studies, 50, 895- 922. http://dx.doi.org/10.1177/0042098012459582 [8] Ferrari, E. and Rae, A. (2013) The Spatiality of Housing Market Volatility and Selective Migration. Town Planning Review, 84, 107-125. http://dx.doi.org/10.3828/tpr.2013.6 [9] Liu, N. and Roberts, D. (2013) Counter-Urbanisation, Planning and House Prices: An Analysis of the Aberdeen Hous- ing Market Area, 1984-2010. Town Planning Review, 84, 81-105. http://dx.doi.org/10.3828/tpr.2013.5 [10] Zhu, B., Füss, R. and Rottke, N.B. (2013) Spatial Linkages in Returns and Volatilities among U.S. Regional Housing Markets. Real Estate Economics, 41, 29-64. http://dx.doi.org/10.1111/j.1540-6229.2012.00337.x [11] Liang, Y.-F. and Gao, T.-M. (2007) Empirical Analysis on Real Estate Price Fluctuation in Different Provinces of China. Economic Research Journal, 8, 133-142. [12] Hong, T., Xi, B. and Gao, B. (2007) Co-Movement of Real Estate Prices and Spatial Diffusion of Bubbles: Evidence from 35 Metropolis in China from 2000 to 2005. Statistical Research, 24, 64-67. [13] Li, Y.-Y. (2014) Demand Driving and Ripple Effects of Housing Prices Rising: On Strategies to Deal with the Prob- lems of Housing Price. China Economic Quarterly, 2, 443-464. [14] Wang, J.-Y. and Liu, X.-L. (2014) Residential Fundamental Value, Bubble Component and Regional Spillover Effect. China Economic Quarterly, 4, 1283-1302. [15] Liang, Y.-F. and Xing, C.-S. (2012) An Application Research on Dynamic Factor Model of Housing Prices Fluctuation: Based on 26 Cities in China. Mathematics in Practice and Theory, 24, 7-16. [16] Baek, E.G. and Brock, W.A. (1992) A Nonparametric Test for Independence of a Multivariate Time Series. General Information, 2, 137-156. [17] Hiemstra, C. and Jones, J.D. (1994) Testing for Linear and Nonlinear Granger Causality in the Stock Price-Volume Relation. Journal of Finance, 49, 1639-1664.
|