Paper Menu >>
Journal Menu >>
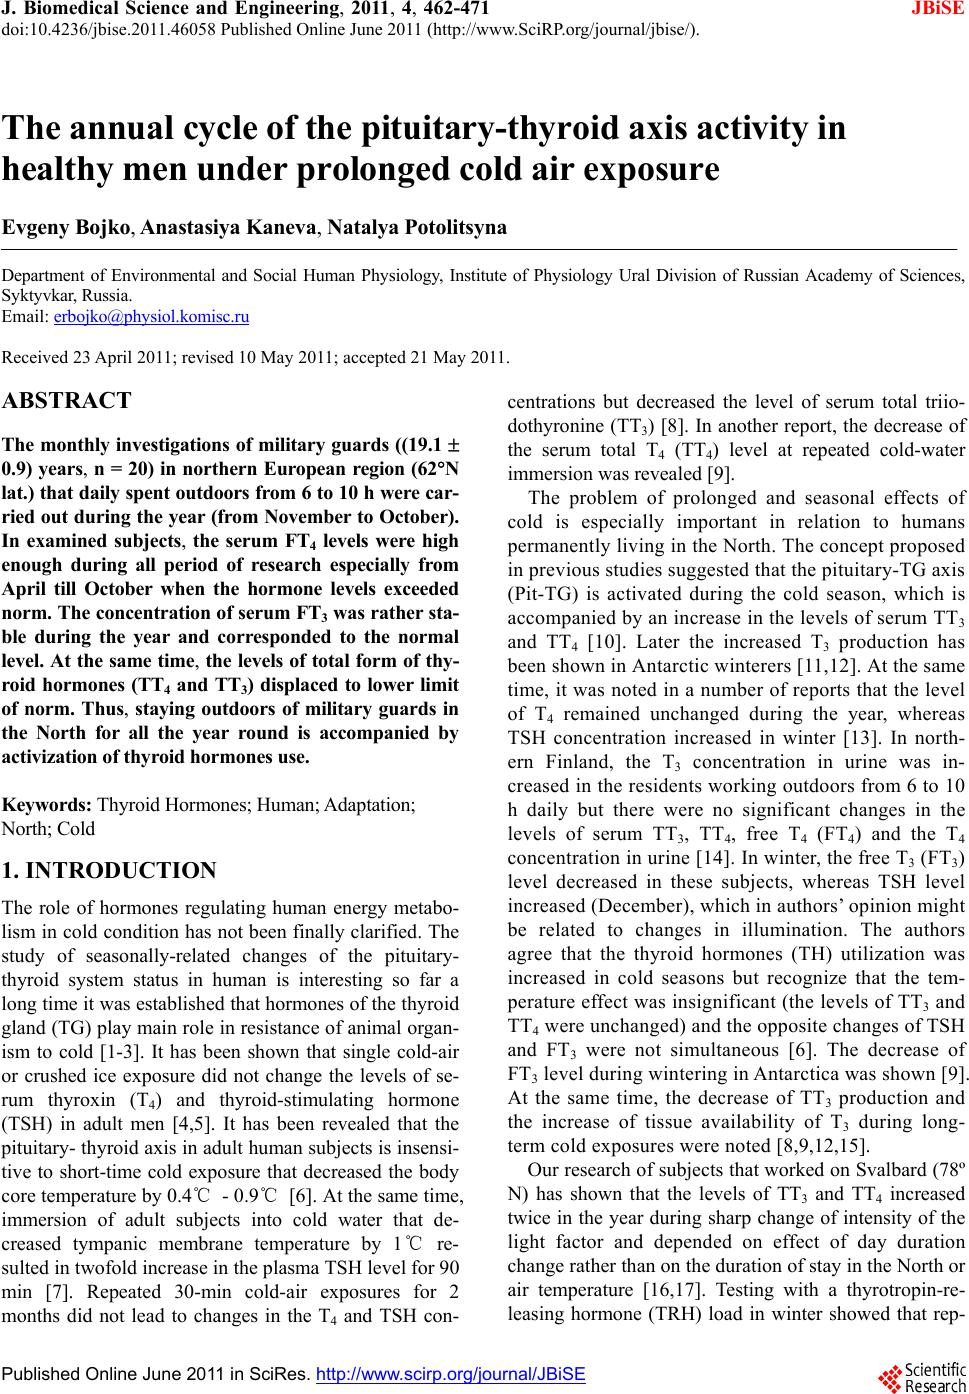 J. Biomedical Science and Engineering, 2011, 4, 462-471 JBiSE doi:10.4236/jbise.2011.46058 Published Online June 2011 (http://www.SciRP.org/journal/jbise/). Published Online June 2011 in SciRes. http://www.scirp.org/journal/JBiSE The annual cycle of the pituitary-thyroid axis activity in healthy men under prolonged cold air exposure Evgeny Bojko, Anastasiya Kaneva, Natalya Potolitsyna Department of Environmental and Social Human Physiology, Institute of Physiology Ural Division of Russian Academy of Sciences, Syktyvkar, Russia. Email: erbojko@physiol.komisc.ru Received 23 April 2011; revised 10 May 2011; accepted 21 May 2011. ABSTRACT The monthly investigations of military guards ((19.1 0.9) years, n = 20) in northern European region (62N lat.) that daily spent outdoors from 6 to 10 h were car- ried out during the year (from November to October). In examined subjects, the serum FT4 levels were high enough during all period of research especially from April till October when the hormone levels exceeded norm. The concentration of serum FT3 was rather sta- ble during the year and corresponded to the normal level. At the same time, the levels of total form of thy- roid hormone s (TT4 and TT3) displaced to lower limit of norm. Thus, staying outdoors of military guards in the North for all the year round is accompanied by activization of thyr oi d hormones use. Keywords: Thyroid Hormones; Human; Adaptation; North; Cold 1. INTRODUCTION The role of hormones regulating human energy metabo- lism in cold condition has not been finally clarified. The study of seasonally-related changes of the pituitary- thyroid system status in human is interesting so far a long time it was established that hormones of the thyroid gland (TG) play main role in resistance of animal organ- ism to cold [1-3]. It has been shown that single cold-air or crushed ice exposure did not change the levels of se- rum thyroxin (Т4) and thyroid-stimulating hormone (TSH) in adult men [4,5]. It has been revealed that the pituitary- thyroid axis in adult human subjects is insensi- tive to short-time cold exposure that decreased the body core temperature by 0.4℃ - 0.9℃ [6]. At the same time, immersion of adult subjects into cold water that de- creased tympanic membrane temperature by 1℃ re- sulted in twofold increase in the plasma TSH level for 90 min [7]. Repeated 30-min cold-air exposures for 2 months did not lead to changes in the Т4 and ТSH con- centrations but decreased the level of serum total triio- dothyronine (TT3) [8]. In another report, the decrease of the serum total T4 (TT4) level at repeated cold-water immersion was revealed [9]. The problem of prolonged and seasonal effects of cold is especially important in relation to humans permanently living in the North. The concept proposed in previous studies suggested that the pituitary-TG axis (Pit-TG) is activated during the cold season, which is accompanied by an increase in the levels of serum TT3 and TT4 [10]. Later the increased T3 production has been shown in Antarctic winterers [11,12]. At the same time, it was noted in a number of reports that the level of T4 remained unchanged during the year, whereas TSH concentration increased in winter [13]. In north- ern Finland, the T3 concentration in urine was in- creased in the residents working outdoors from 6 to 10 h daily but there were no significant changes in the levels of serum TT3, TT4, free T4 (FT4) and the T4 concentration in urine [14]. In winter, the free T3 (FT3) level decreased in these subjects, whereas TSH level increased (December), which in authors’ opinion might be related to changes in illumination. The authors agree that the thyroid hormones (TH) utilization was increased in cold seasons but recognize that the tem- perature effect was insignificant (the levels of TT3 and TT4 were unchanged) and the opposite changes of TSH and FT3 were not simultaneous [6]. The decrease of FT3 level during wintering in Antarctica was shown [9]. At the same time, the decrease of TT3 production and the increase of tissue availability of T3 during long- term cold exposures were noted [8,9,12,15]. Our research of subjects that worked on Svalbard (78º N) has shown that the levels of TT3 and TT4 increased twice in the year during sharp change of intensity of the light factor and depended on effect of day duration change rather than on the duration of stay in the North or air temperature [16,17]. Testing with a thyrotropin-re- leasing hormone (TRH) load in winter showed that rep- 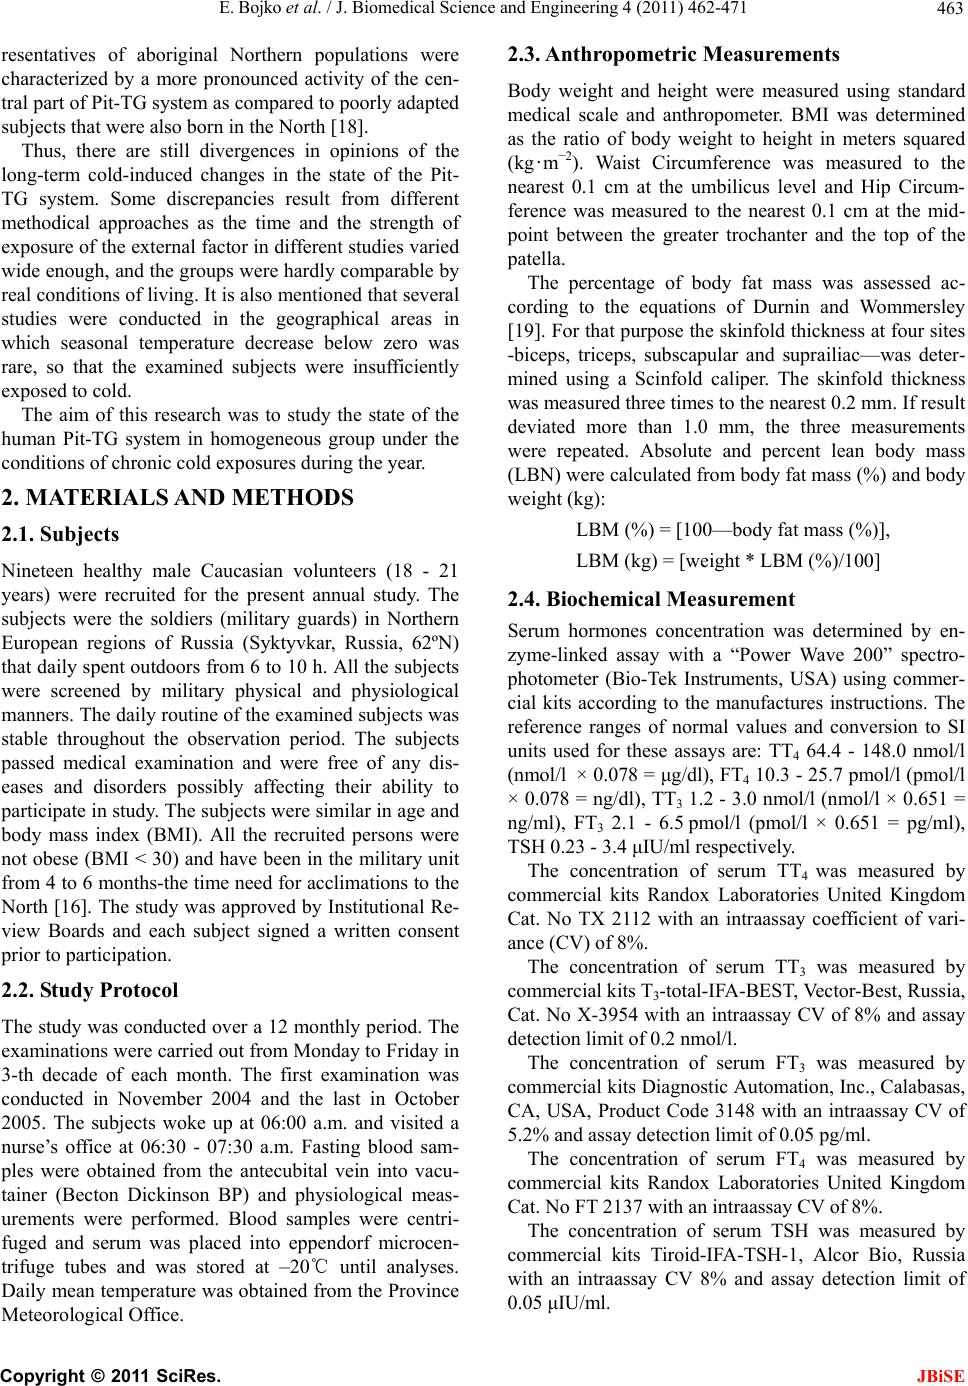 E. Bojko et al. / J. Biomedical Science and Engineering 4 (2011) 462-471 Copyright © 2011 SciRes. JBiSE 463 resentatives of aboriginal Northern populations were characterized by a more pronounced activity of the cen- tral part of Pit-TG system as compared to poorly adapted subjects that were also born in the North [18]. Thus, there are still divergences in opinions of the long-term cold-induced changes in the state of the Pit- TG system. Some discrepancies result from different methodical approaches as the time and the strength of exposure of the external factor in different studies varied wide enough, and the groups were hardly comparable by real conditions of living. It is also mentioned that several studies were conducted in the geographical areas in which seasonal temperature decrease below zero was rare, so that the examined subjects were insufficiently exposed to cold. The aim of this research was to study the state of the human Pit-TG system in homogeneous group under the conditions of chronic cold exposures during the year. 2. MATE RIALS AND METHODS 2.1. Subjects Nineteen healthy male Caucasian volunteers (18 - 21 years) were recruited for the present annual study. The subjects were the soldiers (military guards) in Northern European regions of Russia (Syktyvkar, Russia, 62ºN) that daily spent outdoors from 6 to 10 h. All the subjects were screened by military physical and physiological manners. The daily routine of the examined subjects was stable throughout the observation period. The subjects passed medical examination and were free of any dis- eases and disorders possibly affecting their ability to participate in study. The subjects were similar in age and body mass index (BMI). All the recruited persons were not obese (BMI < 30) and have been in the military unit from 4 to 6 months-the time need for acclimations to the North [16]. The study was approved by Institutional Re- view Boards and each subject signed a written consent prior to participation. 2.2. Study Protocol The study was conducted over a 12 monthly period. The examinations were carried out from Monday to Friday in 3-th decade of each month. The first examination was conducted in November 2004 and the last in October 2005. The subjects woke up at 06:00 a.m. and visited a nurse’s office at 06:30 - 07:30 a.m. Fasting blood sam- ples were obtained from the antecubital vein into vacu- tainer (Becton Dickinson BP) and physiological meas- urements were performed. Blood samples were centri- fuged and serum was placed into eppendorf microcen- trifuge tubes and was stored at –20℃ until analyses. Daily mean temperature was obtained from the Province Meteorological Office. 2.3. Anthropometric Measurements Body weight and height were measured using standard medical scale and anthropometer. BMI was determined as the ratio of body weight to height in meters squared (kg·m–2). Waist Circumference was measured to the nearest 0.1 cm at the umbilicus level and Hip Circum- ference was measured to the nearest 0.1 cm at the mid- point between the greater trochanter and the top of the patella. The percentage of body fat mass was assessed ac- cording to the equations of Durnin and Wommersley [19]. For that purpose the skinfold thickness at four sites -biceps, triceps, subscapular and suprailiac—was deter- mined using a Scinfold caliper. The skinfold thickness was measured three times to the nearest 0.2 mm. If result deviated more than 1.0 mm, the three measurements were repeated. Absolute and percent lean body mass (LBN) were calculated from body fat mass (%) and body weight (kg): LBM (%) = [100—body fat mass (%)], LBM (kg) = [weight * LBM (%)/100] 2.4. Biochemical Measurement Serum hormones concentration was determined by en- zyme-linked assay with a “Power Wave 200” spectro- photometer (Bio-Tek Instruments, USA) using commer- cial kits according to the manufactures instructions. The reference ranges of normal values and conversion to SI units used for these assays are: TT4 64.4 - 148.0 nmol/l (nmol/l × 0.078 = μg/dl), FT4 10.3 - 25.7 pmol/l (pmol/l × 0.078 = ng/dl), TT3 1.2 - 3.0 nmol/l (nmol/l × 0.651 = ng/ml), FT3 2.1 - 6.5 pmol/l (pmol/l × 0.651 = pg/ml), TSH 0.23 - 3.4 μIU/ml respectively. The concentration of serum TT4 was measured by commercial kits Randox Laboratories United Kingdom Cat. No TX 2112 with an intraassay coefficient of vari- ance (CV) of 8%. The concentration of serum TT3 was measured by commercial kits T3-total-IFA-BEST, Vector-Best, Russia, Cat. No X-3954 with an intraassay CV of 8% and assay detection limit of 0.2 nmol/l. The concentration of serum FT3 was measured by commercial kits Diagnostic Automation, Inc., Calabasas, CA, USA, Product Code 3148 with an intraassay CV of 5.2% and assay detection limit of 0.05 pg/ml. The concentration of serum FT4 was measured by commercial kits Randox Laboratories United Kingdom Cat. No FT 2137 with an intraassay CV of 8%. The concentration of serum TSH was measured by commercial kits Tiroid-IFA-TSH-1, Alcor Bio, Russia with an intraassay CV 8% and assay detection limit of 0.05 μIU/ml.  E. Bojko et al. / J. Biomedical Science and Engineering 4 (2011) 462-471 Copyright © 2011 SciRes. JBiSE 464 2.5. Statistical Analysis Data were analyzed with Statistica 6.0 (Statsoft, Tulsa, USA). Descriptive statistics was used to calculate mean and standard deviation (SD). Differences in annual dy- namics of each parameter were tested by Friedman ANOVA. Where Friedman ANOVA revealed significant effect, a Wilcoxon test with Bonferroni correction for multiple comparisons was used to discern differences between months. Data in the figures and tables are pre- sent as mean and SD. The accepted level of significance was P < 0.05. 3. RESULTS The outdoor air temperature at 6 a.m. characterizing the weather during the study is presented in Figure 1. 3.1. Anthropometric Characteristics The anthropometric characteristics of the examined sub- jects are shown in Table 1. No significant changes in subjects’ height and body weight were occurred over the observation period. 3.2. Thyr o id Hormones Measure ments The serum TSH level at the first examination in No- vember was (1.11 ± 0.42) µIU/ml and was invariable in December-January (Figure 2). The TSH concentration in the examined group at the first observation varied within normal range from 0.47 µIU/m to 2.09 µIU/m. The TSH level was the highest in February when the concentration of this hormone elevated significantly (P < 0.05) and -20 -15 -10 -5 0 5 10 15 20 November December January February March April May June July August September October t, 0 C Figure 1. The outdoor air temperature at 6 a.m. during the study. Figure 2. The concentration of TSH in blood serum of northern European male residents during year. The vertical arrow indi- cates the normative values of TSH (0.23 - 3.4 µIU/ml). Data are presented as mean ± SD. *P < 0.05, **P < 0.01, ***P < 0.001 compared to previous month. * **** *** ** 0.20 0.60 1.00 1.40 1.80 2.20 2.60 3.00 November December January February March April May June July August September October TSH, µIU/ml  E. Bojko et al. / J. Biomedical Science and Engineering 4 (2011) 462-471 Copyright © 2011 SciRes. JBiSE 465  E. Bojko et al. / J. Biomedical Science and Engineering 4 (2011) 462-471 Copyright © 2011 SciRes. JBiSE 466 reached (1.54 ± 0.85) µIU/ml. Next two months the TSH level decreased consecutively and was the lowest in April at (0.64 ± 0.18) µIU/m that was significantly lower than during the other months. The next examination performed in May demonstrated an increase in the TSH level to (1.24 ± 0.32) µIU/ml (P < 0.001). In period of May-September, the TSH concentrations were accorded to levels observed in the subjects in November-January. In October, the TSH level elevated to (1.45 ± 0.53) µIU/ml (P < 0.01). The range of TSH concentrations in March- October was 0.39 - 2.61 µIU/m. The TT3 concentration in the subjects at the first ex- amination was (1.45 ± 0.69) nmol/l and ranged within limits of 0.71 - 2.93 nmol/l. In December, this parameters increased (P < 0.01, Figure 3) and was the highest for all observations. In February, the TT3 level decreased slightly while that reduced extremely in March and approached the lowest level of (1.11 ± 0.49) nmol/l in April. In May, the TT3 level was returned back to initial values and was stabile up to September. In October, the TT3 concentration decreased to (1.17 ± 0.41) nmol/l (P < 0.01). The FT3 concentration was (4.46 ± 1.21) pmol/l at the first examination in November and (4.68 ± 1.07) pmol/l at the last that in October (Figure 4). The FT3 level fluctuated insignificantly within limits from 4.15 pmol/l to 4.79 pmol/l over the year. The TT4 level in the subjects at the first examination was (68.2 ± 17.7) nmol/l with range of 41.9 - 89.4 nmol/l (Figure 5). During the next eleven examinations, the TT4 concentration fluctuated in narrow range from (62.3 ± 16.5) nmol/l in March to (91.0 ± 27.64) nmol/l in Au- gust. Seasonal dynamics of the TT4 level are given in more detail in Figure 5. The FT4 level in the subject group in November was (23.2 ± 5.4) pmol/l and ranged from 13.3 pmol/l to 33.4 pmol/l (Figure 6). In November-March, the FT4 level changed slowly. The FT4 concentration in April in- creased significantly (P < 0.001) approaching (28.9 ± 4.0) pmol/l, and individual data ranged within limits of 18.6 - 32.0 pmol/l. This FT4 level was higher than nor- mal range proposed by manufacturer to this hormone. The following examinations showed that this elevated level of FT4 remained unchanged in May-October. 4. DISCUSSION The present study demonstrates that long-term influence of cold air results in formation of the adaptive response of the Pit-TG system. Our results indicate that the chronic effect of low temperatures on human organ- ism(guard service) is accompanied by activation of the TH metabolism. It is necessary to noted that this activa- tion caused by the cold influence during most part of the year results in accumulation of FТ3 and FТ4. Reed et al. have concluded [20] that in the euthyroid subjects (41 years and older) in condition of prolonged Antarctic residence, the increase in the serum TSH level (approximately 30%) was observed without change of the T4 concentration during the winter months. While in the young euthyroid subjects (age 19 to 41), there was no circannual pattern in the TSH or T4 levels but the increase in the plasma T3 clearance rate and production rate (approximately 30%) was revealed during winter Figure 3. The concentration of TT3 in blood serum of northern European male residents during year. The vertical arrow indi- cates the normative values of TT3 (1.2 - 3.0 nM/l). Data are presented as mean ± SD. *P < 0.05, **P < 0.01 compared to previ- ous month. ** * ** 0.20 0.60 1.00 1.40 1.80 2.20 2.60 3.00 3.40 3.80 November December January February March April May June July August September October TT 3 , nM/L  E. Bojko et al. / J. Biomedical Science and Engineering 4 (2011) 462-471 Copyright © 2011 SciRes. JBiSE 467 1.00 2.00 3.00 4.00 5.00 6.00 7.00 November December January February March April May June July August September October FT 3 , pM/L Figure 4. The concentration of FT3 in blood serum of northern European male residents during year. The vertical arrow indi- cates the normative values of FT3 (2.1 - 6.5 pM/l). Data are presented as mean ± SD. Figure 5. The concentration of TT4 in blood serum of northern European male residents during year. The vertical arrow indi- cates the normative values of TT4 (64.4 - 148 nM/l). Data are presented as mean ± SD. *P < 0.05, **P < 0.01 compared to previous month. Figure 6. The concentration of FT4 in blood serum of northern European male residents during year. The vertical arrow indi- cates the normative values of FT4 (10.3 - 25.7 pM/l). Data are presented as mean ± SD. *P < 0.05, ***P < 0.001 compared to previous month. *** * 6.0 10.0 14.0 18.0 22.0 26.0 30.0 34.0 November December January February March April May June July August September October FT 4 , pM/L ** * * * 40 60 80 100 120 140 160 November December January February March April May June July August September October TT 4 , nM/L  E. Bojko et al. / J. Biomedical Science and Engineering 4 (2011) 462-471 Copyright © 2011 SciRes. JBiSE 468 seasons. Young subjects living in Antarctica more than 5 months had a decline in the serum T3 and T4 levels, and the increase in the T3 clearance and production rate. Au- thors have supposed that the T3 kinetic changes have seasonal dependence, and the cold exposure provides this mechanism. To comment these results, it is to be noted that the re- searches of inhabitants of the North have shown that the total tension of endocrine system and the impairment of metabolism were found during the first 6 months after arrival in circumpolar regions [16]. Therefore, the ex- amined group in our research consisted of subjects living on the North no less than 6 months. Data of Indian Antarctic expedition have shown that the levels of total and free fractions of TH varied during wintering. At the end of the Antarctic summer in March, the TT3 concentrations were found to be significantly lower (P < 0.01) compared to values recorded before wintering and showed the significant increase (P < 0.05) during the Antarctic winter. The TT3 levels from May to December were found to be significantly higher than the March or April values. The plasma TT4 concentrations remained unaltered during wintering in Antarctica. The FT4, FT3 levels did not show any appreciable change. Though, the TT3:TT4 ratio tended to decline in March and April suggesting decreased peripheral conversion of T4 to T3 as the possible mechanism for a decline of TT3 level in March. While the monthly studies did not reveal changes in the FT3 and FT4 levels during wintering, the authors have suggested that the serum TH levels during Antarctic wintering were affected by various factors of which the physical activity and the sharp change of day duration were the most significant. The TSH concentra- tions in March, April, November and December were found to be significantly higher than before wintering [21]. These data testify on our opinion about an impor- tant role of ethnic origin of the examined groups. Thus, our results indicating the increase of use and excretion of T3 in condition of long-term cold exposure correspond to data of Reed et al. [12] and Hassi et al. [14]. At the same time, it is to be noted that our data show that the TT3 and TT4 levels varied insignificantly near lower limit of norm at different temperature re- gimes during the year. This confirms active conversion of the connected forms of hormones to the active forms at long stay outdoors in the North during the year. Moreover, our results indicate that the produced stimulus did not cause tension in the central component of the Pit-TG system despite of activation of conversion of TH in the free forms. This is shown by the steadily low level of TSH and testifies that the feedback mechanism is in- active. In research conducted on the similar examined group in Alaska, the essential seasonal variations of the TH concentration were described in the infantry soldiers during different seasons of the year [22]. The TT3 and TT4 levels were the highest in winter while the FT3 and FT4 levels were the highest in early spring. The correla- tion between melatonin and T3 was revealed in spring (light period of year). The seasonal distinctions were also shown between indigenous and newly arrived peo- ple, which may be related not only to cold acclimation but also to day duration. At the same time, this examined group was more heterogeneous in ethnic structure, time spent in the North and professional work than our group, which in the certain degree explains the results received by authors. In another study, the decrease (on 20%) in the serum FT3 level to the 76th day was shown in young military men in Alaska during three monthly field opera- tions [23]. In our study, the temperature of air in February has gone down below –15℃, which was accompanied by slight increase of the TSH level that testified about in- volving of the central mechanisms of regulation. At the same time, the content of TG peripheral hormones both total and free form was almost unchanged. These two facts, slight increase of the TSH concentration and the stable level of TH in condition of accumulation of free forms of hormones, testify in our opinion that the formed adaptive hormonal profile was still sufficient for com- pensation of external influence due to accumulation of active forms of hormones. At the same time, the increase of the TSH level in this period is an adaptive reaction on complex of external influences. In Leppaluoto’s opinion [4], the decrease of the body core temperature more than on 1℃ causes the TSH release. It is possible to suggest that the decrease of air temperature below –15℃ and the long stay of our examined group in these conditions are a critical level followed by the reaction of the central component of the Pit-TG system. Thus, the central stimulus for activation of the TH production is formed. However, the activation of the TH formation in the examined subjects at this pe- riod was not observed. It is possible to suppose some reasons for explanation of observed phenomenon. Firstly, the decrease of air temperature occurred gradually and the gradient of this influence was possibly insufficient for realization of mechanisms of TH synthesis activation in the TG. Secondly, the cold effects may reduce effi- ciency of TH action forming relative resistance to TH effects in tissues. It is known that actions of TH are de- termined by intracellular concentration of free hormones. It was demonstrated that the cytosolic T3-binding pro- teins from human red blood cells rapidly lost activity at low temperature [24]. Moreover, it is necessary to con- sider that the role of cellular transport in modulating  E. Bojko et al. / J. Biomedical Science and Engineering 4 (2011) 462-471 Copyright © 2011 SciRes. JBiSE 469 intracellular concentration of TH has still been poorly understood but the TH extrusion which can modulate availability and action of TH in mammalian cells has been described [25]. It has been demonstrated that tem- perature-sensitive TH efflux mechanism that may con- trol cellular TH-content and TH responsiveness pre- sumably by modulating access of TH to its nuclear re- ceptors is presented in mammalian cells. The altered hormone transport represents one potential explanation for hormone resistance syndromes. So the active hor- mone efflux constitutes a novel mechanism for physiol- ogic regulation of TH action that act through the nuclear hormone receptor. There are data about interrelation of the thyroid func- tion level and the food status. It has been shown that there is significant correlation between the Т3 and Т4 levels and the actual food consumption in Evenki, abo- riginals of Siberia [26]. The interrelation between the serum Т4 concentration and the daily consumption of protein and fat was especially strong. The Т3 level posi- tively correlated with the fatless weight of body and negatively correlated with fatty weight of body in the examined subjects. It has also been noted that there was interrelation between the TH concentration, especially with Т4, and body weight in the examined subjects. Au- thors consider that the received results testify about in- terrelation between the thyroid function parameters and the basal metabolism level in aboriginals of the North and also reflect importance of account of role of food factor in estimation of basal level of metabolism in nor- therners. The study of inhabitants of northern Norway has shown that the TSH level positively correlated with BMI in non-smoking inhabitants whereas there was no this correlation in smokers [27]. In our research, the BMI parameters remained stable during most part of the year. It is possible to note that the significant increase of the air temperature in March-April was accompanied by the decrease in the TSH level to minimal values found for all time of observation. This can confirm supposition that the TSH increase has been caused by the tempera- ture factor. At the same time, the TT3 level decreased to minimal values in March-April, and the TT4 concentra- tion also reduced in March though the level of free forms of hormones was stably high. Thus, the reduction of ex- ternal cold influences is accompanied by decrease of activity of the central component of the Pit-TG system, which affects in the certain degree secretion of the TG hormones. The mechanisms providing accumulation of free forms of hormones are maintained. Moreover in April, the FT4 concentration exceeded the normal level. When the air temperature in May increased considerably (by 25℃ concerning March), the TSH level came back to January value (preceding significant increase of the TSH level). Simultaneously, the TT3 concentration rose insufficiently from the minimal annual levels. At the same time, the increased FT4 level (above the normal values) in the examined subjects was kept up to Sep- tember. In October, the FT4 parameters returned to norm. It is interesting to note that the hormone profile in Octo- ber (the last month of the research) was similar to that in February. In this time, the air temperature approached 0 ℃ that might be a critical value characterizing the ter- mination of the warm period of year. This allows to propose that the mechanism described by us is typical enough for conditions of Arctic region where the envi- ronment conditions and the temperature factor alter crit- ically twice during the year. The similar mechanism could be characterized as a certain “medium-term reac- tion” so far as the accumulation of external factor effect is required for change of functional state of separate components of the Pit-TG system in conditions of aspi- ration of this system to preservation of stability. There is a supposition that the cold exposure may en- hance the T3 production by deiodisation of T4 in skeletal muscle via change in muscle fiber type, which could explain the high level of T4 in the examined subjects in summer [2]. Moreover, we should not exclude possibil- ity that the increase of the FT4 level was caused by the fact that the air temperature was low (from +10℃ to +15℃) even in summer. This conditioned the formation of TH active forms as FT3 level was stably high. The study has shown that the long-term cold expo- sures result in activation of use of TH active forms-FТ3 and FТ4. The change of action intensity of temperature factor can cause acceleration of conversion of total forms of TH in free forms of that. This process is ac- companied by the decrease of levels of connected forms of hormones to lower limit of norm and the accumula- tion of FТ3 and FТ4 in blood serum to higher limit of norm. Under these conditions, the central component of the Pit-TG system is not activated keeping constancy of functional state. The activation of the central component of the Pit-TG system is occurred when influence of cold stimulus exceeds a certain limit. This activation is shown by increase of the level of serum TSH. The decrease of cold factor influence intensity results in reduction of tension of the central component of the Pit-TG system and lowing of the serum TSH level. It is necessary to note specially that mean parameters of the FT3 in our examined group varied from (4.15 ± 0.91) pmol/L in June to (4.79 ± 0.69) pmol/L in December. These results completely correspond to data obtained Hassi et al. [14] in the annual research of young outdoor workers from northern Finland. While our data on the FT4 level, which varied from (21.4 ± 4.3) pmol/L to  E. Bojko et al. / J. Biomedical Science and Engineering 4 (2011) 462-471 Copyright © 2011 SciRes. JBiSE 470 (28.9 ± 4.0) pmol/l, do not conform to data of Hassi et al. that FT4 level averaged 15 pmol/L. This is probably caused by the fact that determination of both FT3 and FT4 in our and above-mentioned studies was performed by various methods and reagents of different producer therefore there could be diverse reference ranges. De- spite in both studies, the levels of free forms of hor- mones were high and accorded height limit of norm. In report of Hassi et al. [14], the important fact show- ing significant elevation of the TSH content during pe- riod of the minimal temperatures observed in northern Finland in December has been described. In our research, the TSH level also raised significantly at achievement of the minimally low temperatures that were in conditions of our region in February. Thus, these data also confirm the phenomenon described earlier and allow to explain its origin that was not possible to make in the above- mentioned report. 5. CONCLUSIONS Thus, the central and peripheral components of the Pit- TG system can show certain plasticity in conditions of long-term exposure of cold air. The results of our re- search allowed to show that adequate selection of the examined groups is important for revealing effect of external long-term stimulus on human organism as it defines obtained results. Our materials allow differenti- ating the adaptive response of the Pit-TG system as a whole on chronic cold air exposure showing activation of Т3 and Т4 active forms use at the “moderate” intensity of the external factor action. The central component of the Pit-TG system is activated in conditions of excess of a certain limit-excess of exposure doze. In conditions of the North, this activation of the central mechanisms can not cause mediated reaction from peripheral target or- gans, and a certain resistance to ТSH effect in the TG is observed. REFERENCES [1] Leblond, C.P. and Gross, J. (1943) Effect of thyroidectomy on resistance to low environmental temperature. Endocri- nology, 33, 155-160. doi:10.1210/endo-33-3-1 55 [2] Laurberg, P., Andersen, S. and Karmisholt, J. (2005) Cold adaptation and thyroid hormone metabolism. Hormone and Metabolic Research , 37, 545-549. doi:10.1055/s-20 05-8704 20 [3] Silvestri, E., Schiavo, L., Lombardi, A. and Goglia, F. (2005) Thyroid hormones as molecular determinants of thermogenesis. Acta Physiologica Scandinavica, 184, 265- 283. doi:10.1111/ j.1365- 201 X.200 5.0146 3.x [4] Leppaluoto, J., Korhonen, I., Huttunen, P. and Hassi, J. (1988) Serum levels of thyroid and adrenal hormones, tes- tosterone, TSH, LH, GH and prolactin in men after 2-h stay in a cold room. Acta Physiologica Scandinavica, 132, 543-548. doi:10.1111/j.1748-1716.1988.tb08363.x [5] Thomas, J.R., Ahlers, S.T., House, J.F., Schrot, J., Van Orden, K.F., Winsborough, M.M., Hesslink, R.L.Jr. and Lewis, S.B. (1990) Adrenergic responses to cognitive ac- tivity in a cold environment. Journal of Applied Physiol- ogy, 68, 962-966. [6] Leppaluoto, J., Paakonen, T., Korhonen, I. and Hassi, J. (2005) Pituitary and autonomic responses to cold expo- sures in man. Acta Physiologica Scandinavica, 184, 255- 264. doi:10.1111/ j.1365- 201 X.200 5.0146 4.x [7] Leppaluoto, J., Lybeck, H., Virkkunen, P., Partanen, J. and Ranta, T. (1982) Effects of immersion in cold water on the plasma ACTH, GH, LH, and TSH concentrations in man. Circumpolar Health, 81, 601-602. [8] Hesslink, R.L.Jr., D’Alessandro, M.M., Armstrong, D.W. and Reed, H.L. (1992) Human cold air habituation is in- dependent of thyroxine and thyrotropin. Journal of Applied Physiology, 72, 2134-2139. [9] Savourey, G., Caravel, J.P., Barnavol, B. and Bittel, J.H. (1994) Thyroid hormone changes in cold air environment after local cold acclimation. Journal of Applied P hysiol ogy, 76, 1963-1967. [10] Nagata, H., Izumiyama, T., Kamata, K., Kono, S. and Yu- kimura, Y. (1976) An increase of plasma triiodothyronine concentration in man in cold environment. Journal of Clinical Endocrinology and Metabolism, 43, 1153-1156. doi:10.1210/jcem-43-5-1153 [11] Reed, H.L., Fereiro, J.A., Shakir, K.M., Burman, K.D. and O`Brain, J.T. (1988) Pituitary and peripheral hormone re- sponses to T3 administration during Antarctic residence. American Journal of Physiology: Endocrinology and Me- tabolism, 254, E733-739. [12] Reed, H.L., Reedy, K.R., Palinkas, L.A., Van Do, N., Fin- ney, N.S., Case, H.S., LeMar, H.J., Wright, J. and Thomas, J. (2001) Impairment in cognitive and exercise perform- ance during prolonced Antarctic residence effect of thy- roxine supplementation in the polar triiodthyronine syn- drome. Journal o f Clinical En docrinology and Met abolism, 86, 110-116. doi:10.1210/jc.86.1.110 [13] Harrop, J.S., Ashwell, K. and Hopton, M.R. (1985) Cir- canual and within-individual variation of thyroid function tests in normal subjects. Annals of Clinical Biochemistry, 22, 371-375. [14] Hassi, J., Sikkila, K., Ruokohen, A. and Leppaluoto, J. (2001) The pituitary-thyroid axis in healthy men living under subarctic climatological conditions. Journal of En- docrinology, 169, 195-203. doi:10.1677/joe.0.1690195 [15] Leppaluoto, J., Sikkila, K. and Hassi, J. (1998) Seasonal variation of serum TSH and thyroid hormones in males living in Subarctic environmental conditions. International Journal of Cir cumpolar Health, 57, 383-385. [16] Boiko, E.R. (1996) Realignment of human metabolism in the North. Human Physiology, 22, 496-502. [17] Bojko, E.R. (1997) Metabolic changes induced by adapta- tion at 78 degrees North: Svalbard study. International Journal of Cir cumpolar Health, 56, 134-141. [18] Boiko, E.R., Bichkaeva, F.A., Tkachev, A.V. and Dogadin, S.A. (1997) Regulation of metabolic reactions in various groups of aboriginal people of Polar Europe: an example of loading test with thyrotropin-releasing hormone. Human  E. Bojko et al. / J. Biomedical Science and Engineering 4 (2011) 462-471 Copyright © 2011 SciRes. JBiSE 471 Physiology, 23, 469-471. [19] Durnin, J.V. and Wommersley, I. (1974) Body fat assessed from total body density and its estimation from skinfold thickness measurements on 481 men and women aged from 16-72 years. British Journal of Nutrition, 32, 77-97. doi:10.1079/BJN1974006 0 [20] Reed, H.L. (1995) Circannual changes in thyroid hormone physiology: the role of cold environmental temperatures. Arctic Medical Research , 54, 9-15. [21] Sawhney, R.C., Malhotra, A.S., Nair, C.S., Bajaj, A.C., Rajan, K.C., Pal, K., Prasad, R. and Basu, M. (1995) Thy- roid function during a prolonged stay in Antarctica. Euro- pean Journal of Applied Physiology and Occupational Physiology, 72, 127-133. doi:10.1007/BF00964 127c [22] Levine, M., Duffy, L., Moore, D.C. and Matej, L.A. (1995) Acclimation of non-indigenous sub-Arctic population: seasonal variation in thyroid function in interior Alaska. Comparative Biochemistry and Physiology. Part A: Com- parative Physiology, 111, 209-214. doi:10.1016/0300-9629( 95)0 001 6-Z [23] McCormack, P.D., Thomas, J., Malik, M. and Staschen, C.M. (1998) Cold stress, reverse T3 and lymphocyte func- tion. Alaska Medicine, 40, 55-62. [24] Fanjul, A.N. and Farias, R.N. (1993) Molecular intercon- version of cold-sensitive cytosolic 3,3’,5-tri-iodo-lthyronine- binding proteins from human erythrocytes: effect of cold, heat and pH treatments. Biochemical Journal, 290, 579- 582. [25] Ribeiro, R.C., Cavalieri, R.R., Lomri, N., Rahmaouli, C.M., Baxter, J.D. and Scharschmidt, B.F. (1996) Thyroid hormone export regulates cellular hormone content and re- sponse. Journal of Biological Chemistry, 271, 17147- 17151. doi:10.1074/jbc.271.29.17147 [26] Leonard, W.R., Galloway, V.A., Ivakine, E., Osipova, L. and Kazakovtseva, M. (1999) Nutrition, thyroid function and basal metabolism of the Evenki of central Siberia. In- ternational Journal of Circumpolar Health, 58, 281-295. [27] Nyrnes, A., Jorde, R. and Sundfjord, J. (2006) Serum TSH is possibly associated with BMI. International Journal of Obesity, 30, 100-105. doi:10.1038/sj.ijo.0803112 |