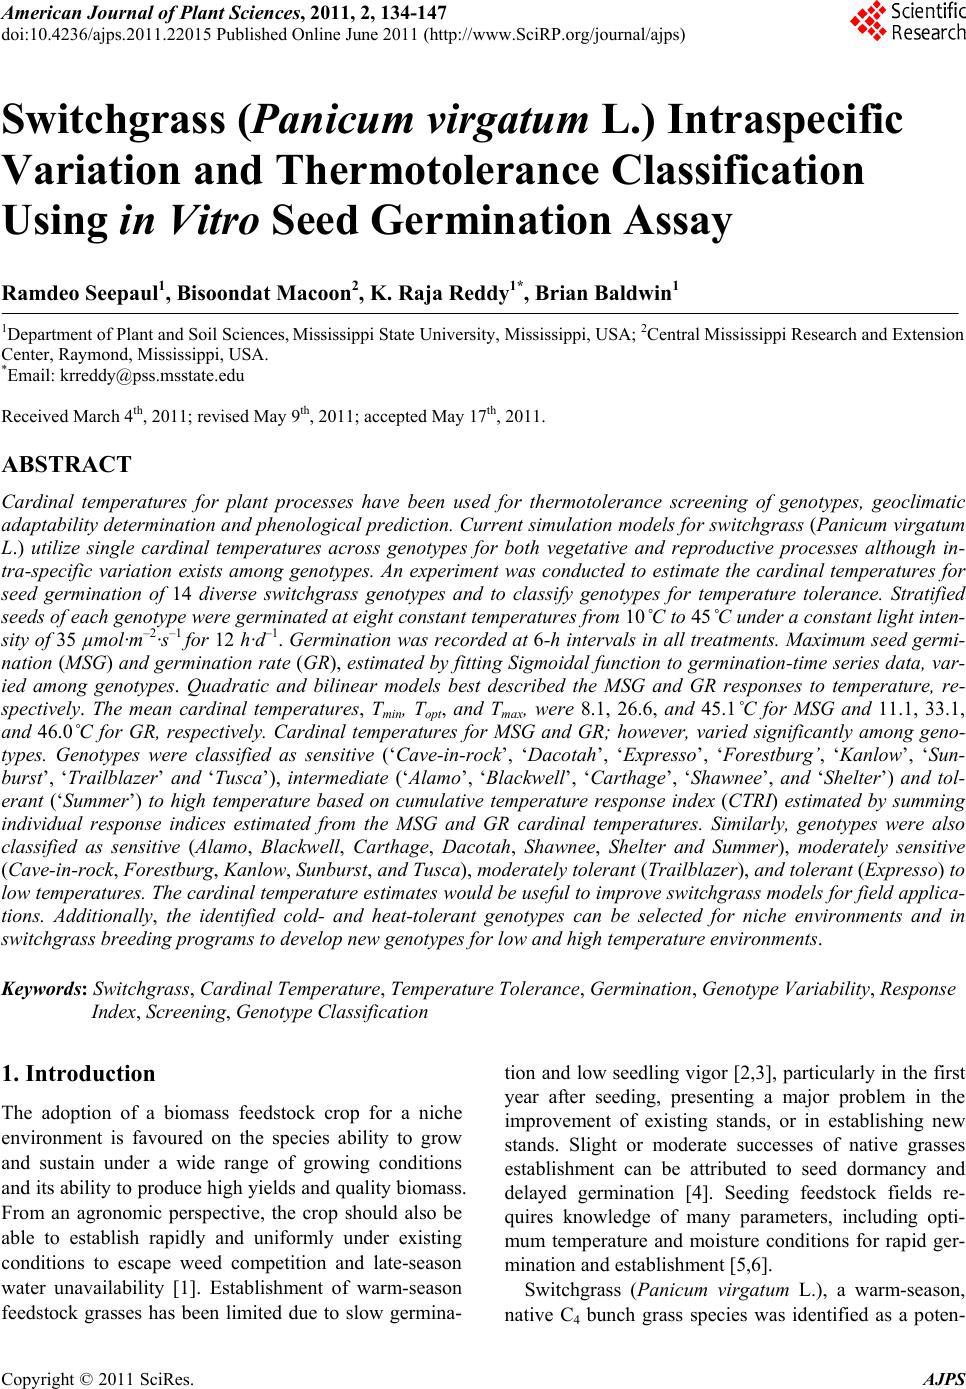
 American Journal of Plant Sciences, 2011, 2, 134-147 doi:10.4236/ajps.2011.22015 Published Online June 2011 (http://www.SciRP.org/journal/ajps) Copyright © 2011 SciRes. AJPS Switchgrass (Panicum virgatum L.) Intraspecific Variation and Thermotolerance Classification Using in Vitro Seed Germination Assay Ramdeo Seepaul1, Bisoondat Macoon2, K. Raja Reddy1*, Brian Baldwin1 1Department of Plant and Soil Sciences, Mississippi State University, Mississippi, USA; 2Central Mississippi Research and Extension Center, Raymond, Mississippi, USA. *Email: krreddy@pss.msstate.edu Received March 4th, 2011; revised May 9th, 2011; accepted May 17th, 2011. ABSTRACT Cardinal temperatures for plant processes have been used for thermotolerance screening of genotypes, geoclimatic adaptability determinatio n and phenological prediction. Curren t simulation models for switchgrass (Panicum virgatum L.) utilize single cardinal temperatures across genotypes for both vegetative and reproductive processes although in- tra-specific variation exists among genotypes. An experiment was conducted to estimate the cardinal temperatures for seed germination of 14 diverse switchgrass genotypes and to classify genotypes for temperature tolerance. Stratified seeds of each genotype were germinated at eight constant temperatures from 10˚C to 45˚C under a constant light inten- sity of 35 µmo l·m–2·s–1 for 12 h·d–1. Germination was recorded at 6-h intervals in all treatmen ts. Maximum seed germi- nation (MSG) and germination rate (GR), estimated by fitting Sigmoidal function to germina tion-time series data, var- ied among genotypes. Quadratic and bilinear models best described the MSG and GR responses to temperature, re- spectively. The mean cardinal temperatures, Tmin, Topt, and Tmax, were 8.1, 26.6, and 45.1˚C for MSG and 11.1, 33.1, and 46.0˚C for GR, respectively. Cardinal temperatures for MSG and GR; however, varied significantly among geno- types. Genotypes were classified as sensitive (‘Cave-in-rock’, ‘Dacotah’, ‘Expresso’, ‘Forestburg’, ‘Kanlow’, ‘Sun- burst’, ‘Trailblazer’ and ‘Tusca’), intermediate (‘Alamo’, ‘Blackwell’, ‘Carthage’, ‘Shawnee’, and ‘Shelter’) and tol- erant (‘Summer’) to high temperature based on cumulative temperature response index (CTRI) estimated by summing individual response indices estimated from the MSG and GR cardinal temperatures. Similarly, genotypes were also classified as sensitive (Alamo, Blackwell, Carthage, Dacotah, Shawnee, Shelter and Summer), moderately sensitive (Cave-in-rock, Forestburg, Kanlow, Sunburst, and Tusca), moderately tolerant (Trailblazer), and tolerant (Expresso) to low temperatures. The cardinal temperature estimates would be useful to improve switchgrass models for field applica- tions. Additionally, the identified cold- and heat-tolerant genotypes can be selected for niche environments and in switchgrass breeding programs to develop new genotypes for low and high temperature environments. Keywords: Switchgrass, Cardinal Temperature, Temperature Tolerance, Germination, Genotype Variability, Response Index, Screening, Genotype Classification 1. Introduction The adoption of a biomass feedstock crop for a niche environment is favoured on the species ability to grow and sustain under a wide range of growing conditions and its ability to produce high yields and quality biomass. From an agronomic perspective, the crop should also be able to establish rapidly and uniformly under existing conditions to escape weed competition and late-season water unavailability [1]. Establishment of warm-season feedstock grasses has been limited due to slow germina- tion and low seedling vigor [2,3], particularly in the first year after seeding, presenting a major problem in the improvement of existing stands, or in establishing new stands. Slight or moderate successes of native grasses establishment can be attributed to seed dormancy and delayed germination [4]. Seeding feedstock fields re- quires knowledge of many parameters, including opti- mum temperature and moisture conditions for rapid ger- mination and establishment [5,6]. Switchgrass (Panicum virgatum L.), a warm-season, native C4 bunch grass species was identified as a poten- 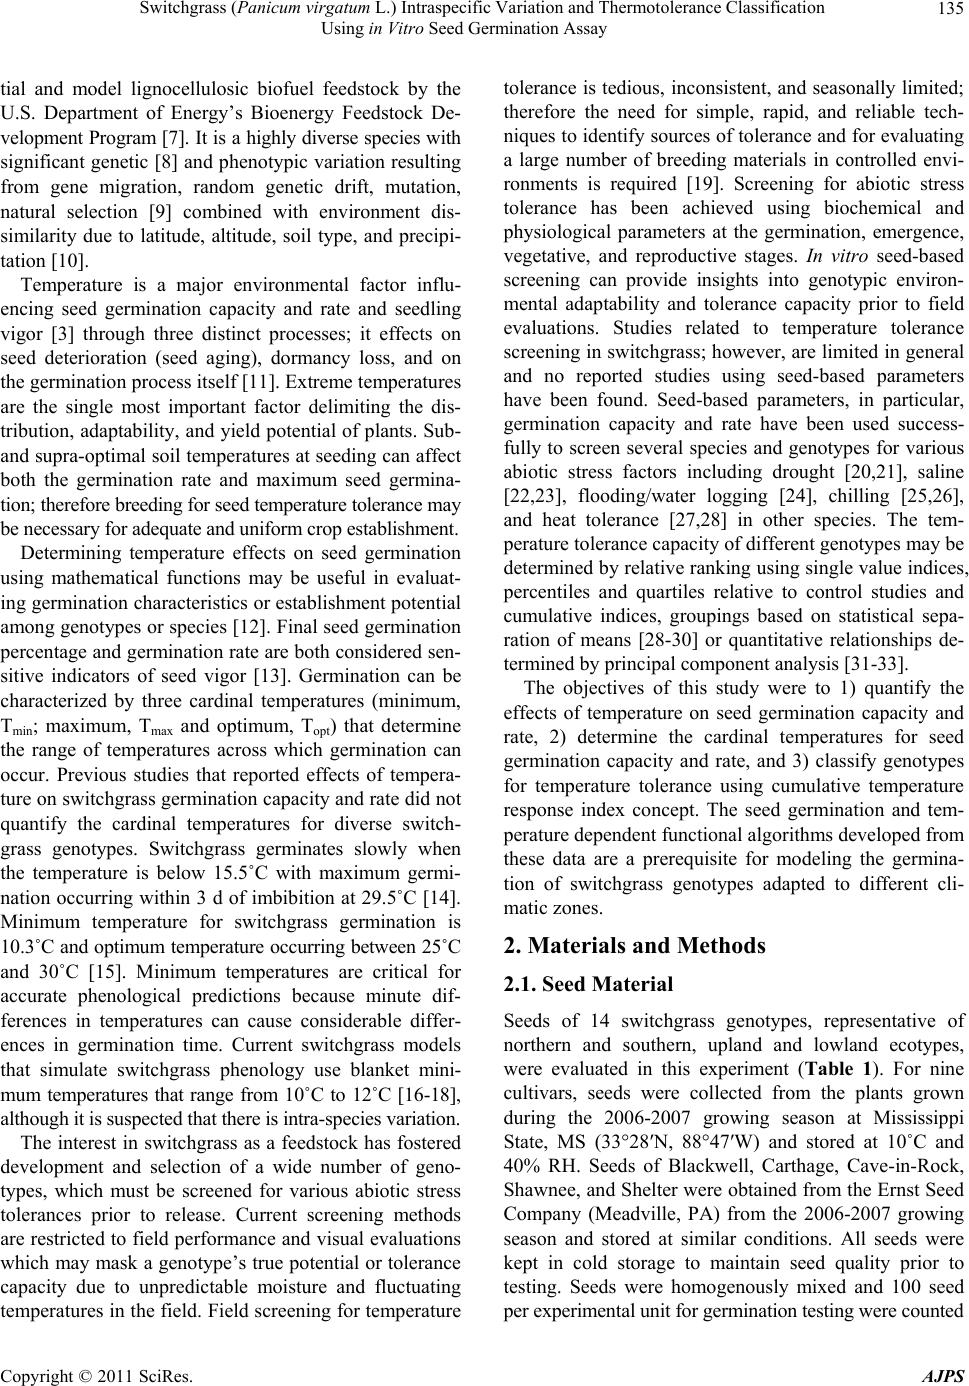 Switchgrass (Panicum virgatum L.) Intraspecific Variation and Thermotolerance Classification 135 Using in Vitro Seed Germination Assay tial and model lignocellulosic biofuel feedstock by the U.S. Department of Energy’s Bioenergy Feedstock De- velopment Program [7]. It is a highly diverse species with significant genetic [8] and phenotypic variation resulting from gene migration, random genetic drift, mutation, natural selection [9] combined with environment dis- similarity due to latitude, altitude, soil type, and precipi- tation [10]. Temperature is a major environmental factor influ- encing seed germination capacity and rate and seedling vigor [3] through three distinct processes; it effects on seed deterioration (seed aging), dormancy loss, and on the germination process itself [11]. Extreme temperatures are the single most important factor delimiting the dis- tribution, adaptability, and yield potential of plants. Sub- and supra-optimal soil temperatures at seeding can affect both the germination rate and maximum seed germina- tion; therefore breeding for seed temperature tolerance may be necessary for adequate and uniform crop establishment. Determining temperature effects on seed germination using mathematical functions may be useful in evaluat- ing germination characteristics or establishment potential among genotypes or species [12]. Final seed germination percentage and germination rate are both considered sen- sitive indicators of seed vigor [13]. Germination can be characterized by three cardinal temperatures (minimum, Tmin; maximum, Tmax and optimum, Topt) that determine the range of temperatures across which germination can occur. Previous studies that reported effects of tempera- ture on switchgrass germination capacity and rate did not quantify the cardinal temperatures for diverse switch- grass genotypes. Switchgrass germinates slowly when the temperature is below 15.5˚C with maximum germi- nation occurring within 3 d of imbibition at 29.5˚C [14]. Minimum temperature for switchgrass germination is 10.3˚C and optimum temperature occurring between 25˚C and 30˚C [15]. Minimum temperatures are critical for accurate phenological predictions because minute dif- ferences in temperatures can cause considerable differ- ences in germination time. Current switchgrass models that simulate switchgrass phenology use blanket mini- mum temperatures that range from 10˚C to 12˚C [16-18], although it is suspected that there is intra-species variation. The interest in switchgrass as a feedstock has fostered development and selection of a wide number of geno- types, which must be screened for various abiotic stress tolerances prior to release. Current screening methods are restricted to field performance and visual evaluations which may mask a genotype’s true potential or tolerance capacity due to unpredictable moisture and fluctuating temperatures in the field. Field screening for temperature tolerance is tedious, inconsistent, and seasonally limited; therefore the need for simple, rapid, and reliable tech- niques to identify sources of tolerance and for evaluating a large number of breeding materials in controlled envi- ronments is required [19]. Screening for abiotic stress tolerance has been achieved using biochemical and physiological parameters at the germination, emergence, vegetative, and reproductive stages. In vitro seed-based screening can provide insights into genotypic environ- mental adaptability and tolerance capacity prior to field evaluations. Studies related to temperature tolerance screening in switchgrass; however, are limited in general and no reported studies using seed-based parameters have been found. Seed-based parameters, in particular, germination capacity and rate have been used success- fully to screen several species and genotypes for various abiotic stress factors including drought [20,21], saline [22,23], flooding/water logging [24], chilling [25,26], and heat tolerance [27,28] in other species. The tem- perature tolerance capacity of different genotypes may be determined by relative ranking using single value indices, percentiles and quartiles relative to control studies and cumulative indices, groupings based on statistical sepa- ration of means [28-30] or quantitative relationships de- termined by principal component analysis [31-33]. The objectives of this study were to 1) quantify the effects of temperature on seed germination capacity and rate, 2) determine the cardinal temperatures for seed germination capacity and rate, and 3) classify genotypes for temperature tolerance using cumulative temperature response index concept. The seed germination and tem- perature dependent functional algorithms developed from these data are a prerequisite for modeling the germina- tion of switchgrass genotypes adapted to different cli- matic zones. 2. Materials and Methods 2.1. Seed Material Seeds of 14 switchgrass genotypes, representative of northern and southern, upland and lowland ecotypes, were evaluated in this experiment (Table 1). For nine cultivars, seeds were collected from the plants grown during the 2006-2007 growing season at Mississippi State, MS (33°28′N, 88°47′W) and stored at 10˚C and 40% RH. Seeds of Blackwell, Carthage, Cave-in-Rock, Shawnee, and Shelter were obtained from the Ernst Seed Company (Meadville, PA) from the 2006-2007 growing season and stored at similar conditions. All seeds were kept in cold storage to maintain seed quality prior to testing. Seeds were homogenously mixed and 100 seed er experimental unit for germination testing were counted p Copyright © 2011 SciRes. AJPS 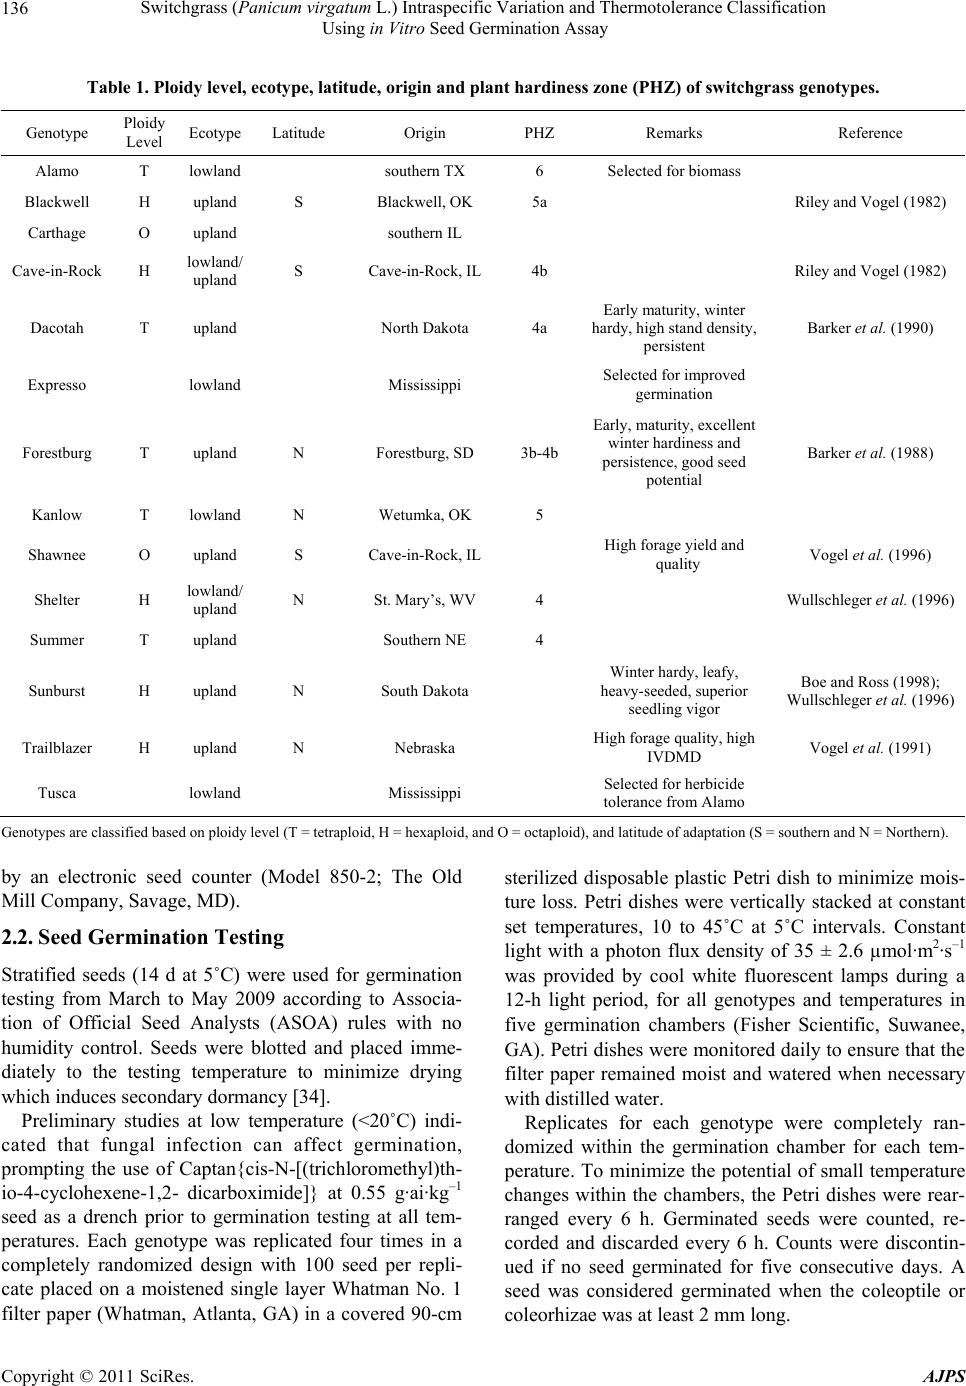 Switchgrass (Panicum virgatum L.) Intraspecific Variation and Thermotolerance Classification Using in Vitro Seed Germination Assay Copyright © 2011 SciRes. AJPS 136 Table 1. Ploidy level, ecotype, latitude, origin and plant hardiness zone (PHZ) of switchgrass ge notypes. Genotype Ploidy Level EcotypeLatitude Origin PHZ Remarks Reference Alamo T lowland southern TX 6 Selected for biomass Blackwell H upland S Blackwell, OK 5a Riley and Vogel (1982) Carthage O upland southern IL Cave-in-Rock H lowland/ upland S Cave-in-Rock, IL 4b Riley and Vogel (1982) Dacotah T upland North Dakota 4a Early maturity, winter hardy, high stand density, persistent Barker et al. (1990) Expresso lowland Mississippi Selected for improved germination Forestburg T upland N Forestburg, SD 3b-4b Early, maturity, excellent winter hardiness and persistence, good seed potential Barker et al. (1988) Kanlow T lowlandN Wetumka, OK 5 Shawnee O upland S Cave-in-Rock, IL High forage yield and quality Vogel et al. (1996) Shelter H lowland/ upland N St. Mary’s, WV 4 Wullschleger et al. (1996) Summer T upland Southern NE 4 Sunburst H upland N South Dakota Winter hardy, leafy, heavy-seeded, superior seedling vigor Boe and Ross (1998); Wullschleger et al. (1996) Trailblazer H upland N Nebraska High forage quality, high IVDMD Vogel et al. (1991) Tusca lowland Mississippi Selected for herbicide tolerance from Alamo Genotypes are classified based on ploidy level (T = tetraploid, H = hexaploid, and O = octaploid), and latitude of adaptation (S = southern and N = Northern). by an electronic seed counter (Model 850-2; The Old Mill Company, Savage, MD). 2.2. Seed Germination Testing Stratified seeds (14 d at 5˚C) were used for germination testing from March to May 2009 according to Associa- tion of Official Seed Analysts (ASOA) rules with no humidity control. Seeds were blotted and placed imme- diately to the testing temperature to minimize drying which induces secondary dormancy [34]. Preliminary studies at low temperature (<20˚C) indi- cated that fungal infection can affect germination, prompting the use of Captan{cis-N-[(trichloromethyl)th- io-4-cyclohexene-1,2- dicarboximide]} at 0.55 g·ai·kg–1 seed as a drench prior to germination testing at all tem- peratures. Each genotype was replicated four times in a completely randomized design with 100 seed per repli- cate placed on a moistened single layer Whatman No. 1 filter paper (Whatman, Atlanta, GA) in a covered 90-cm sterilized disposable plastic Petri dish to minimize mois- ture loss. Petri dishes were vertically stacked at constant set temperatures, 10 to 45˚C at 5˚C intervals. Constant light with a photon flux density of 35 ± 2.6 µmol·m2·s–1 was provided by cool white fluorescent lamps during a 12-h light period, for all genotypes and temperatures in five germination chambers (Fisher Scientific, Suwanee, GA). Petri dishes were monitored daily to ensure that the filter paper remained moist and watered when necessary with distilled water. Replicates for each genotype were completely ran- domized within the germination chamber for each tem- perature. To minimize the potential of small temperature changes within the chambers, the Petri dishes were rear- ranged every 6 h. Germinated seeds were counted, re- corded and discarded every 6 h. Counts were discontin- ued if no seed germinated for five consecutive days. A seed was considered germinated when the coleoptile or coleorhizae was at least 2 mm long. 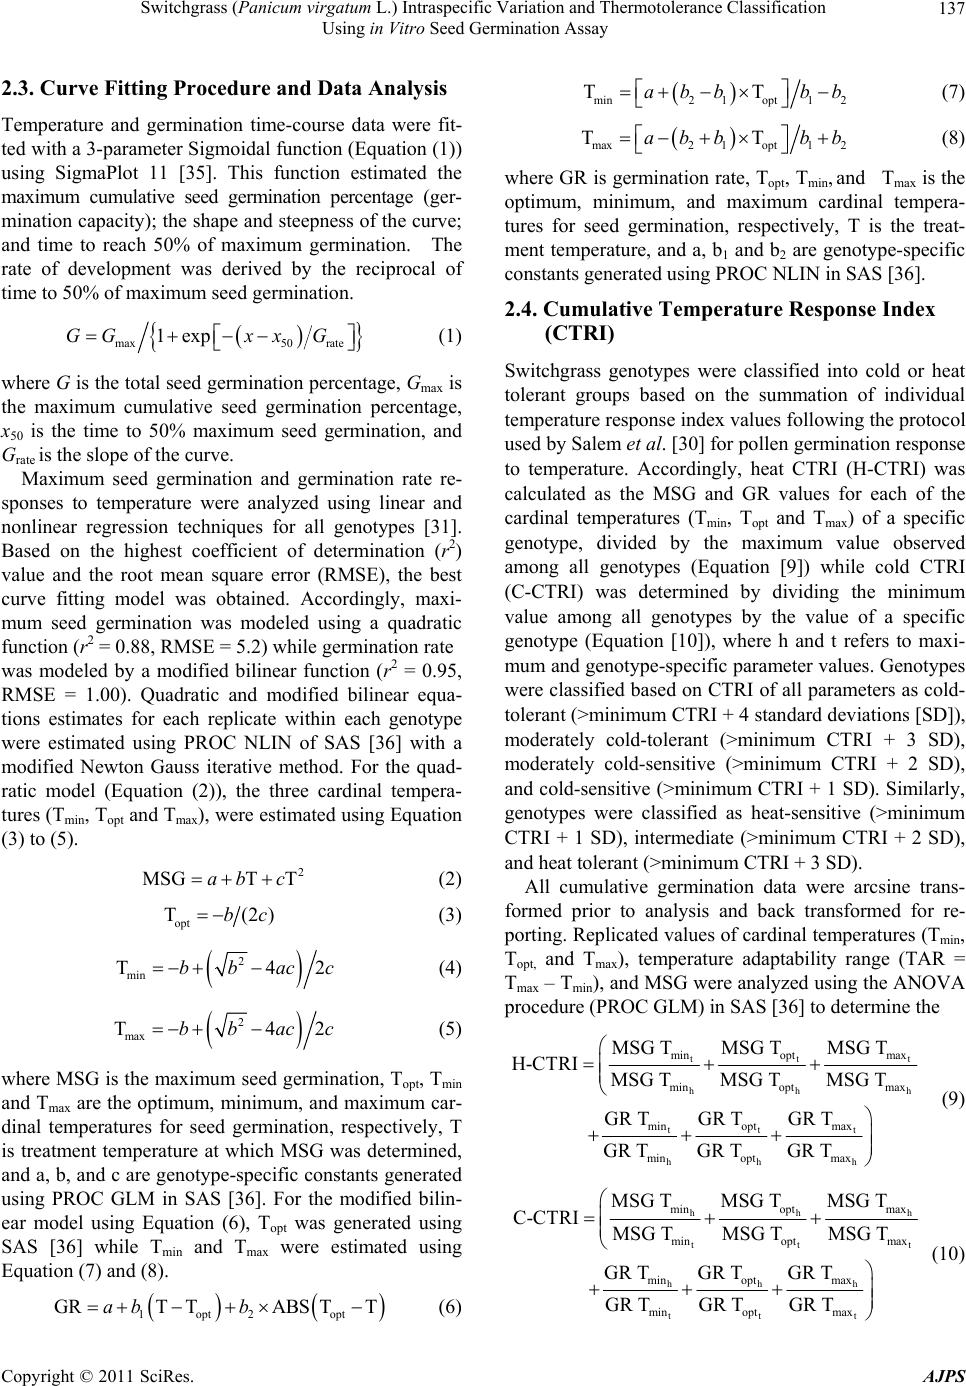 Switchgrass (Panicum virgatum L.) Intraspecific Variation and Thermotolerance Classification 137 Using in Vitro Seed Germination Assay 2.3. Curve Fitting Procedure and Data Analysis Temperature and germination time-course data were fit- ted with a 3-parameter Sigmoidal function (Equation (1)) using SigmaPlot 11 [35]. This function estimated the maximum cumulative seed germination percentage (ger- mination capacity); the shape and steepness of the curve; and time to reach 50% of maximum germination. The rate of development was derived by the reciprocal of time to 50% of maximum seed germination. max50 rate 1expGGxx G (1) where G is the total seed germination percentage, Gmax is the maximum cumulative seed germination percentage, x50 is the time to 50% maximum seed germination, and Grate is the slope of the curve. Maximum seed germination and germination rate re- sponses to temperature were analyzed using linear and nonlinear regression techniques for all genotypes [31]. Based on the highest coefficient of determination (r2) value and the root mean square error (RMSE), the best curve fitting model was obtained. Accordingly, maxi- mum seed germination was modeled using a quadratic function (r2 = 0.88, RMSE = 5.2) while germination rate was modeled by a modified bilinear function (r2 = 0.95, RMSE = 1.00). Quadratic and modified bilinear equa- tions estimates for each replicate within each genotype were estimated using PROC NLIN of SAS [36] with a modified Newton Gauss iterative method. For the quad- ratic model (Equation (2)), the three cardinal tempera- tures (Tmin, Topt and Tmax), were estimated using Equation (3) to (5). 2 MSGT Tab c (2) opt T(2)bc (3) 2 Tbb min42acc (4) 2 max T4bbac 2c (5) where MSG is the maximum seed germination, Topt, Tmin and Tmax are the optimum, minimum, and maximum car- dinal temperatures for seed germination, respectively, T is treatment temperature at which MSG was determined, and a, b, and c are genotype-specific constants generated using PROC GLM in SAS [36]. For the modified bilin- ear model using Equation (6), Topt was generated using SAS [36] while Tmin and Tmax were estimated using Equation (7) and (8). 1opt 2opt GRTTABS TTab b (6) min2 1opt12 TTabb bb (7) max2 1opt1 2 TTabb bb (8) where GR is germination rate, Topt, Tmin, and T max is the optimum, minimum, and maximum cardinal tempera- tures for seed germination, respectively, T is the treat- ment temperature, and a, b1 and b2 are genotype-specific constants generated using PROC NLIN in SAS [36]. 2.4. Cumulative Temperature Response Index (CTRI) Switchgrass genotypes were classified into cold or heat tolerant groups based on the summation of individual temperature response index values following the protocol used by Salem et al. [30] for pollen germination response to temperature. Accordingly, heat CTRI (H-CTRI) was calculated as the MSG and GR values for each of the cardinal temperatures (Tmin, Topt and Tmax) of a specific genotype, divided by the maximum value observed among all genotypes (Equation [9]) while cold CTRI (C-CTRI) was determined by dividing the minimum value among all genotypes by the value of a specific genotype (Equation [10]), where h and t refers to maxi- mum and genotype-specific parameter values. Genotypes were classified based on CTRI of all parameters as cold- tolerant (>minimum CTRI + 4 standard deviations [SD]), moderately cold-tolerant (>minimum CTRI + 3 SD), moderately cold-sensitive (>minimum CTRI + 2 SD), and cold-sensitive (>minimum CTRI + 1 SD). Similarly, genotypes were classified as heat-sensitive (>minimum CTRI + 1 SD), intermediate (>minimum CTRI + 2 SD), and heat tolerant (>minimum CTRI + 3 SD). All cumulative germination data were arcsine trans- formed prior to analysis and back transformed for re- porting. Replicated values of cardinal temperatures (Tmin, Topt, and Tmax), temperature adaptability range (TAR = Tmax – Tmin), and MSG were analyzed using the ANOVA procedure (PROC GLM) in SAS [36] to determine the tt hh tt t hh h min optmax min optmax min opt max min opt max MSG TMSG TMSG T H-CTRI MSG TMSG TMSG T GR TGR TGR T GR TGR TGR T t h (9) hh tt hh h tt t min opt max min optmax min opt max min opt max MSG TMSG TMSG T C-CTRI MSG TMSG TMSG T GR TGR TGR T GR TGR TGR T h t (10) Copyright © 2011 SciRes. AJPS 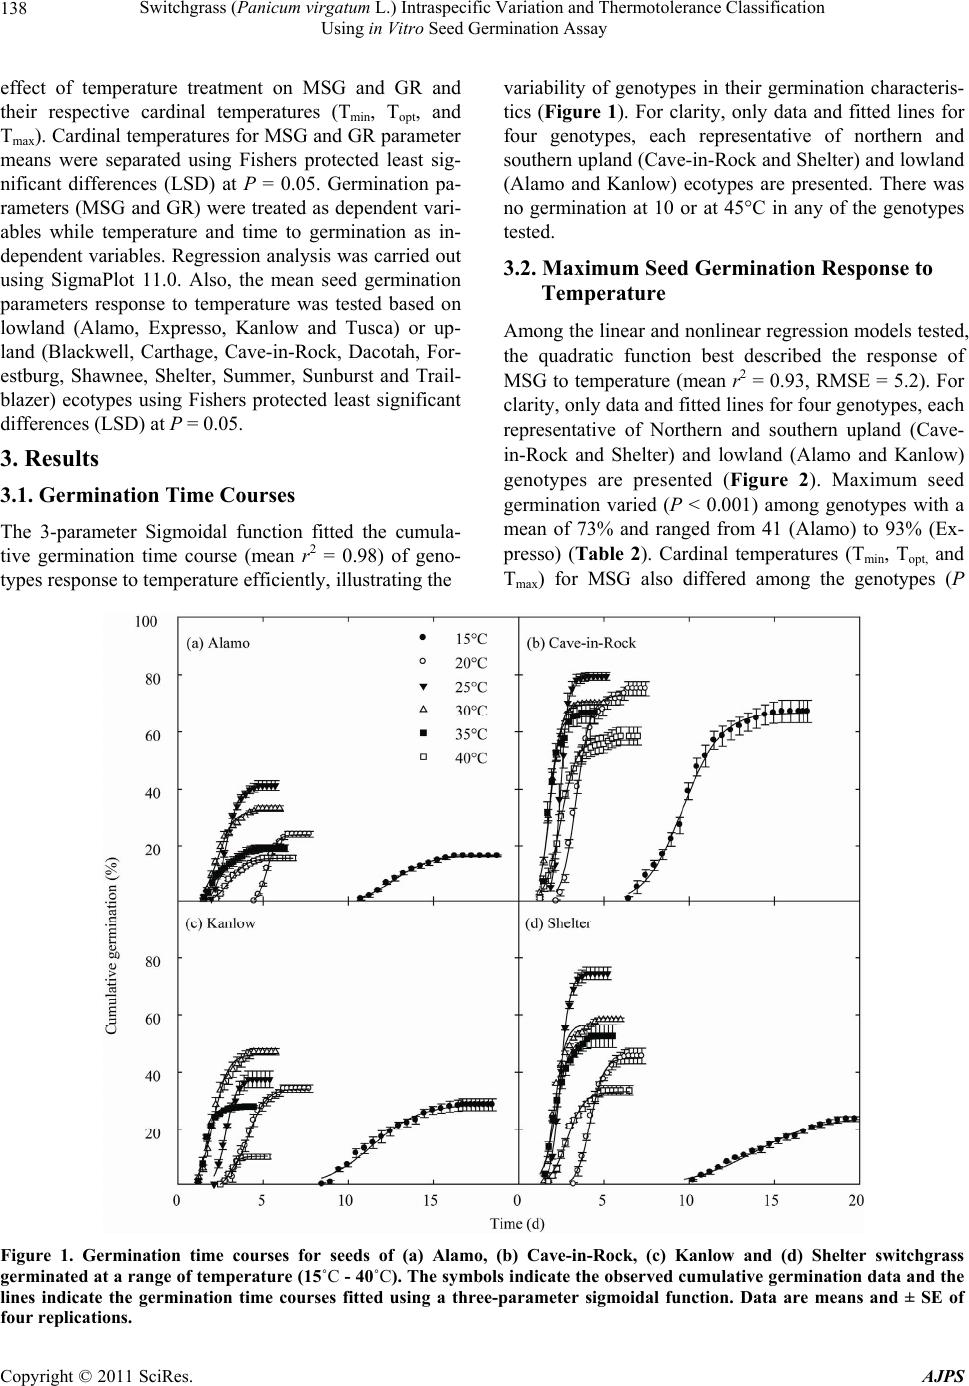 Switchgrass (Panicum virgatum L.) Intraspecific Variation and Thermotolerance Classification Using in Vitro Seed Germination Assay Copyright © 2011 SciRes. AJPS 138 effect of temperature treatment on MSG and GR and their respective cardinal temperatures (Tmin, Topt, and Tmax). Cardinal temperatures for MSG and GR parameter means were separated using Fishers protected least sig- nificant differences (LSD) at P = 0.05. Germination pa- rameters (MSG and GR) were treated as dependent vari- ables while temperature and time to germination as in- dependent variables. Regression analysis was carried out using SigmaPlot 11.0. Also, the mean seed germination parameters response to temperature was tested based on lowland (Alamo, Expresso, Kanlow and Tusca) or up- land (Blackwell, Carthage, Cave-in-Rock, Dacotah, For- estburg, Shawnee, Shelter, Summer, Sunburst and Trail- blazer) ecotypes using Fishers protected least significant differences (LSD) at P = 0.05. variability of genotypes in their germination characteris- tics (Figure 1). For clarity, only data and fitted lines for four genotypes, each representative of northern and southern upland (Cave-in-Rock and Shelter) and lowland (Alamo and Kanlow) ecotypes are presented. There was no germination at 10 or at 45°C in any of the genotypes tested. 3.2. Maximum Seed Germination Response to Temperature Among the linear and nonlinear regression models tested, the quadratic function best described the response of MSG to temperature (mean r2 = 0.93, RMSE = 5.2). For clarity, only data and fitted lines for four genotypes, each representative of Northern and southern upland (Cave- in-Rock and Shelter) and lowland (Alamo and Kanlow) genotypes are presented (Figure 2). Maximum seed germination varied (P < 0.001) among genotypes with a mean of 73% and ranged from 41 (Alamo) to 93% (Ex- presso) (Table 2). Cardinal temperatures (Tmin, Topt, and Tmax) for MSG also differed among the genotypes (P 3. Results 3.1. Germination Time Courses The 3-parameter Sigmoidal function fitted the cumula- tive germination time course (mean r2 = 0.98) of geno- types response to temperature efficiently, illustrating the Figure 1. Germination time courses for seeds of (a) Alamo, (b) Cave-in-Rock, (c) Kanlow and (d) Shelter switchgrass germinated at a range of temperature (15˚C - 40˚C). The symbols indicate the observed cumulative germination data and the lines indicate the germination time courses fitted using a three-parameter sigmoidal function. Data are means and ± SE of four replications. 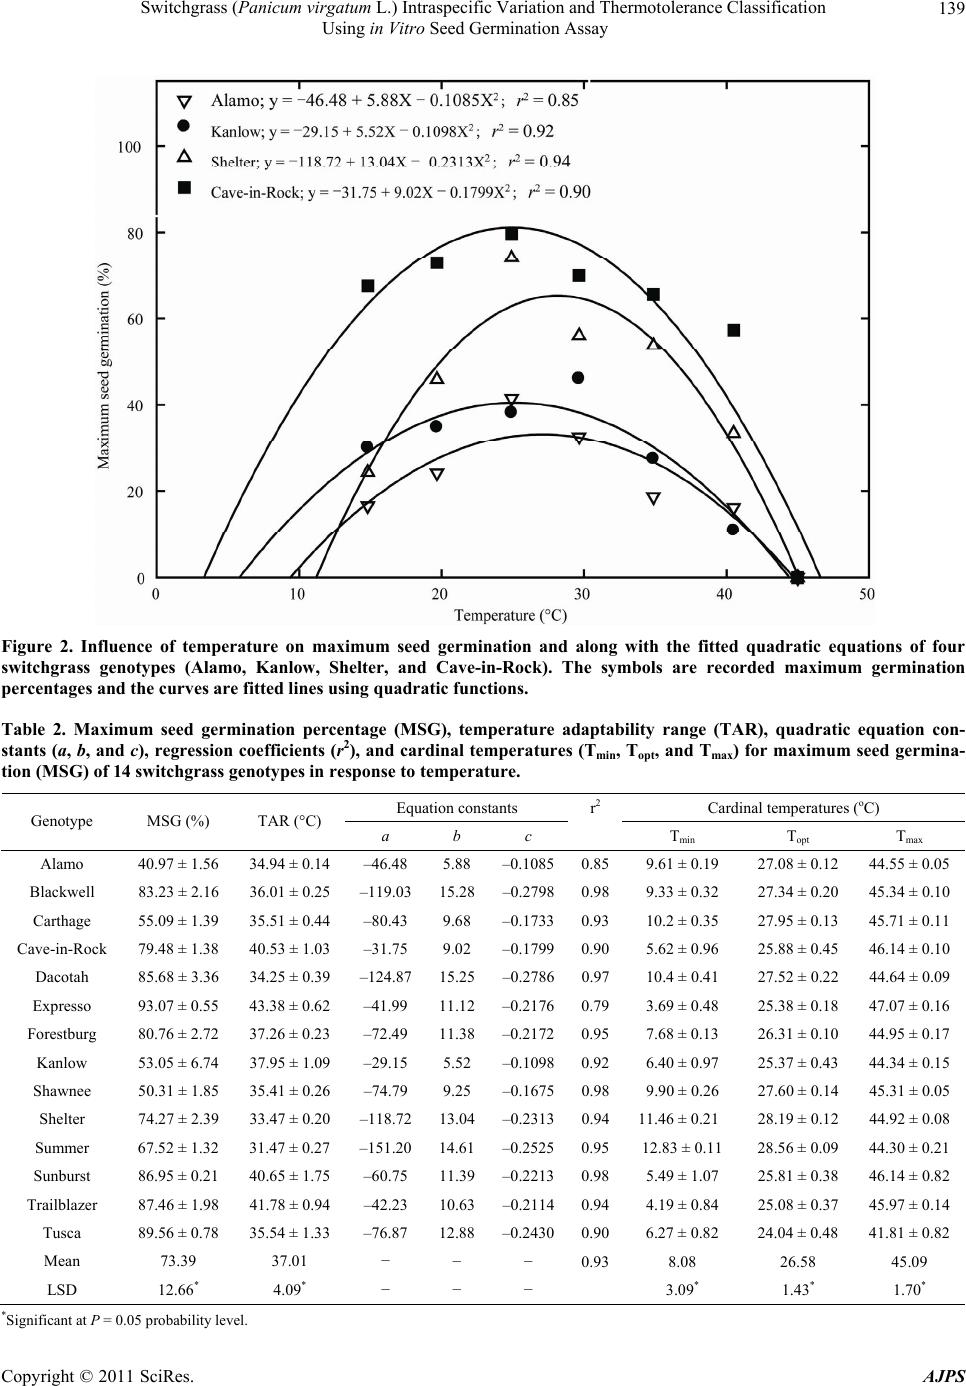 Switchgrass (Panicum virgatum L.) Intraspecific Variation and Thermotolerance Classification 139 Using in Vitro Seed Germination Assay Figure 2. Influence of temperature on maximum seed germination and along with the fitted quadratic equations of four switchgrass genotypes (Alamo, Kanlow, Shelter, and Cave-in-Rock). The symbols are recorded maximum germination percentages and the curves are fitted lines using quadratic functions. Table 2. Maximum seed germination percentage (MSG), temperature adaptability range (TAR), quadratic equation con- stants (a, b, and c), regression coefficients (r2), and cardinal temperatures (Tmin, Topt, and Tmax) for maximum seed germina- tion (MSG) of 14 switchgrass genotypes in response to temperature. Equation constants r2 Cardinal temperatures (oC) Genotype MSG (%) TAR (°C) a b c Tmin T opt T max Alamo 40.97 ± 1.56 34.94 ± 0.14 –46.48 5.88 –0.10850.859.61 ± 0.19 27.08 ± 0.12 44.55 ± 0.05 Blackwell 83.23 ± 2.16 36.01 ± 0.25 –119.0315.28–0.27980.989.33 ± 0.32 27.34 ± 0.20 45.34 ± 0.10 Carthage 55.09 ± 1.39 35.51 ± 0.44 –80.43 9.68 –0.17330.9310.2 ± 0.35 27.95 ± 0.13 45.71 ± 0.11 Cave-in-Rock 79.48 ± 1.38 40.53 ± 1.03 –31.75 9.02 –0.17990.905.62 ± 0.96 25.88 ± 0.45 46.14 ± 0.10 Dacotah 85.68 ± 3.36 34.25 ± 0.39 –124.8715.25–0.27860.9710.4 ± 0.41 27.52 ± 0.22 44.64 ± 0.09 Expresso 93.07 ± 0.55 43.38 ± 0.62 –41.99 11.12–0.21760.793.69 ± 0.48 25.38 ± 0.18 47.07 ± 0.16 Forestburg 80.76 ± 2.72 37.26 ± 0.23 –72.49 11.38–0.21720.957.68 ± 0.13 26.31 ± 0.10 44.95 ± 0.17 Kanlow 53.05 ± 6.74 37.95 ± 1.09 –29.15 5.52 –0.10980.926.40 ± 0.97 25.37 ± 0.43 44.34 ± 0.15 Shawnee 50.31 ± 1.85 35.41 ± 0.26 –74.79 9.25 –0.16750.989.90 ± 0.26 27.60 ± 0.14 45.31 ± 0.05 Shelter 74.27 ± 2.39 33.47 ± 0.20 –118.7213.04–0.23130.9411.46 ± 0.21 28.19 ± 0.12 44.92 ± 0.08 Summer 67.52 ± 1.32 31.47 ± 0.27 –151.2014.61–0.25250.9512.83 ± 0.11 28.56 ± 0.09 44.30 ± 0.21 Sunburst 86.95 ± 0.21 40.65 ± 1.75 –60.75 11.39–0.22130.985.49 ± 1.07 25.81 ± 0.38 46.14 ± 0.82 Trailblazer 87.46 ± 1.98 41.78 ± 0.94 –42.23 10.63–0.21140.944.19 ± 0.84 25.08 ± 0.37 45.97 ± 0.14 Tusca 89.56 ± 0.78 35.54 ± 1.33 –76.87 12.88–0.24300.906.27 ± 0.82 24.04 ± 0.48 41.81 ± 0.82 Mean 73.39 37.01 − − − 0.938.08 26.58 45.09 LSD 12.66* 4.09* − − − 3.09* 1.43* 1.70* *Significant at P = 0.05 probability level. Copyright © 2011 SciRes. AJPS  Switchgrass (Panicum virgatum L.) Intraspecific Variation and Thermotolerance Classification Using in Vitro Seed Germination Assay Copyright © 2011 SciRes. AJPS 140 3.3. Germination Rate Response to Temperature < 0.001). The Tmin values ranged from 3.69 (Expresso) to 12.83˚C (Summer) with a mean of 8.08˚C. The Topt was 26.58˚C (Table 2); however, there was variation among the genotypes (P < 0.001). Summer recorded the highest Topt (28.56˚C) while Tusca showed the lowest (24.04˚C). The Tmax ranged from 41.81 (Tusca) to 47.07˚C (Ex- presso) with a mean of 45.07˚C (Table 2). The TAR for MSG ranged from 43.38 (Expresso) to 31.37˚C (Summer) with a mean of 37˚C for all genotypes. The modified bilinear equation best described the rela- tionship between GR and temperature (mean r2 = 0.95, RMSE = 1.0) among the linear and non-linear models tested. Cardinal temperatures for GR differed among genotypes (P < 0.05) (Table 3). For clarity, only data and predictor lines of four genotypes are presented in Figure 3. The Tmin ranged from 9.09 (Dacotah) to 12.92˚C (Shelter) with a mean of 11.13˚C. A mean of 33.12˚C was estimated for Topt which ranged from 29.55 (Shelter) to 35.73˚C (Tusca). Highest Tmax was recorded in Shelter (48.15˚C), while the lowest Tmax (45.0˚C) was observed in Kanlow. The TAR ranged from 32.92 (Blackwell) to 36.18˚C (Dacotah) with a mean of 34.88˚C (Table 3). Ecotypic classification of genotypes indicate that TAR, Tmin and Tmax did not differ, but Topt was different (P < 0.05) with a mean of 32.37 and 34.98˚C for upland and lowland ecotypes, respectively (P = 0.0477; LSD = 2.57). Cardinal temperatures variation was small between ecotypes (<4%) with germination rate Tmin being more variable than Topt and Tmax for both upland and lowland ecotypes (Table 3). Grouping genotypes based on upland and lowland ecotype revealed no differences (P > 0.05) for MSG, TAR, Tmin and Tmax; however, Topt for MSG was differ- ent (P = 0.0471, LSD = 1.53) with mean of 27.02 and 25.47˚C for upland and lowland ecotypes, respectively. Maximum seed germination for both upland and lowland ecotypes also varied ( 10%) (data not shown). Cardinal temperature (Tmin, Topt and Tmax) variation was small between ecotypes (<4%). Maximum seed germination Tmin was more variable than Topt and Tmax for both upland and lowland ecotypes. On average, MSG cardinal temperatures were 10 and 6% more variable than germina- tion rate cardinal temperatures for upland and lowland ecotypes, respectively. Figure 3. Effect of temperature on germination rate along with the fitted modified bilinear fitted lines and equations of four switchgrass genotypes (Alamo, Kanlow, Shelter, and Cave-in-Rock). The symbols are the derived germination rate and the lines are predicted values by the fitted modified bilinear equations.  Switchgrass (Panicum virgatum L.) Intraspecific Variation and Thermotolerance Classification 141 Using in Vitro Seed Germination Assay Table 3. Temperature adaptability range (TAR), modified bilinear equation constants (a, b, and c), regression coefficients (r2), and cardinal temperatures (Tmin, Topt, and Tma x) for germination rate of 14 switchgrass genotypes in response to temperature. Equation Constants Cardinal temperatures (oC) GeNotype TAR (˚C) a b c r2 Tmin T opt T max Alamo 34.29 ± 0.86 0.5255 –0.0094 –0.0334 0.95 11.96 ± 0.60 33.02 ± 1.40 46.25 ± 0.78 Blackwell 32.92 ± 0.26 0.6791 –0.0142 –0.0459 1.00 12.14 ± 0.21 33.91 ± 0.08 45.06 ± 0.07 Carthage 34.06 ± 0.47 0.5945 0.0010 –0.0349 0.87 12.83 ± 0.22 30.45 ± 1.00 46.89 ± 0.64 Cave-in-Rock 35.11 ± 0.57 0.6430 –0.0282 –0.0509 0.98 10.16 ± 0.60 34.43 ± 0.88 45.27 ± 0.37 Dacotah 36.18 ± 0.30 0.6469 –0.0266 –0.0496 0.97 9.09 ± 0.49 35.34 ± 0.88 45.27 ± 0.26 Expresso 35.77 ± 0.53 0.7545 –0.0290 –0.0566 0.98 9.33 ± 0.63 35.50 ± 0.83 45.09 ± 0.10 Forestburg 35.17 ± 0.44 0.5884 –0.0121 –0.0374 0.98 10.18 ± 0.52 34.03 ± 0.78 45.35 ± 0.12 Kanlow 35.06 ± 0.84 0.6227 –0.0196 –0.0453 1.00 9.94 ± 0.84 35.65 ± 0.26 45.00 ± 0.00 Shawnee 35.01 ± 0.45 0.5940 0.0024 –0.0338 0.82 12.54 ± 0.26 30.56 ± 1.05 47.55 ± 0.71 Shelter 35.23 ± 0.15 0.5661 0.0023 –0.0326 0.87 12.92 ± 0.08 29.55 ± 0.07 48.15 ± 0.10 Summer 35.02 ± 0.36 0.4765 0.0009 –0.0270 0.86 12.06 ± 0.49 30.77 ± 1.36 47.08 ± 0.68 Sunburst 35.35 ± 0.34 0.6072 –0.0008 –0.0343 0.89 11.21 ± 0.23 30.48 ± 1.04 46.55 ± 0.50 Trailblazer 35.59 ± 0.18 0.7006 –0.0273 –0.0524 0.97 9.86 ± 0.27 34.21 ± 0.39 45.44 ± 0.15 Tusca 33.52 ± 0.39 0.6361 –0.0089 –0.0384 0.90 11.65 ± 0.34 35.73 ± 1.02 45.16 ± 0.22 Mean 34.88 - - - 0.93 11.13 33.12 46.01 LSD 2.47* - - - - 2.32* 4.49* 2.17* *Significant at P = 0.05 probability level. 3.4. Genotype Classification Using Cumulative Temperature Response Index (CTRI) Six parameters (Tmin, Topt, and Tmax for both MSG and GR) were used for both heat- and cold-tolerance classi- fication of genotypes based on CTRI. Each parameter contributed differently based on its relation to the mini- mum or maximum value for that parameter across the genotypes. Using one standard deviation permitted the classification of heat-CTRI values (which ranged from 4.83 to 6.05) into three groups (heat-sensitive [4.83 - 5.43]; intermediate [5.44 - 5.74], and heat-tolerant [5.73 - 6.05]). Summer was identified as the most heat-tolerant genotype while Cave-in-Rock, Dacotah, Expresso, For- estburg, Kanlow, Sunburst, Trailblazer and Tusca as heat-sensitive genotypes (Tab le 4). Using the same parameters used for heat tolerance, the genotypes were similarly classified for cold-tolerance (Table 4). Cold-CTRI values, which ranged from 4.74 to 6.21, allowed grouping of genotypes into four tolerance categories (cold sensitive [4.74 - 5.03]; moderately cold sensitive [5.04 - 5.32], moderately cold tolerant [5.33 - 5.62], and cold tolerant [5.63 - 6.21]). Expresso had the highest cold-CTRI (5.64), and therefore consid- ered as most cold-tolerant genotype, while Summer had the lowest cold-CTRI (4.74) and was classified as cold-sensitive genotype (Table 4). 3.5. Parameter Relationships No correlation was found between MSG Tmin and Tmax and Topt and Tma x (P > 0.05), however, a positive linear correlation existed between Tmin and Topt (r2 = 0.81, P < 0.0001). As GR Tmin increased among the genotypes, Tmax generally increased (r2 = 0.56, P < 0.0021). An inverse relationship was found between GR Tmin and Topt (r2 = 0.58, P < 0.0014) as well as Topt and Tmax (r2 = 0.88, P < 0.0001). The correlation between MSG and GR car- dinal temperatures varied, but a weak positive correlation was found between MSG and GR Tmin (r2 = 0.39, P = 0.0163), while a weak negative correlation was found etween MSG and GR Topt (r2 = 0.46, P = 0.0071). b Copyright © 2011 SciRes. AJPS 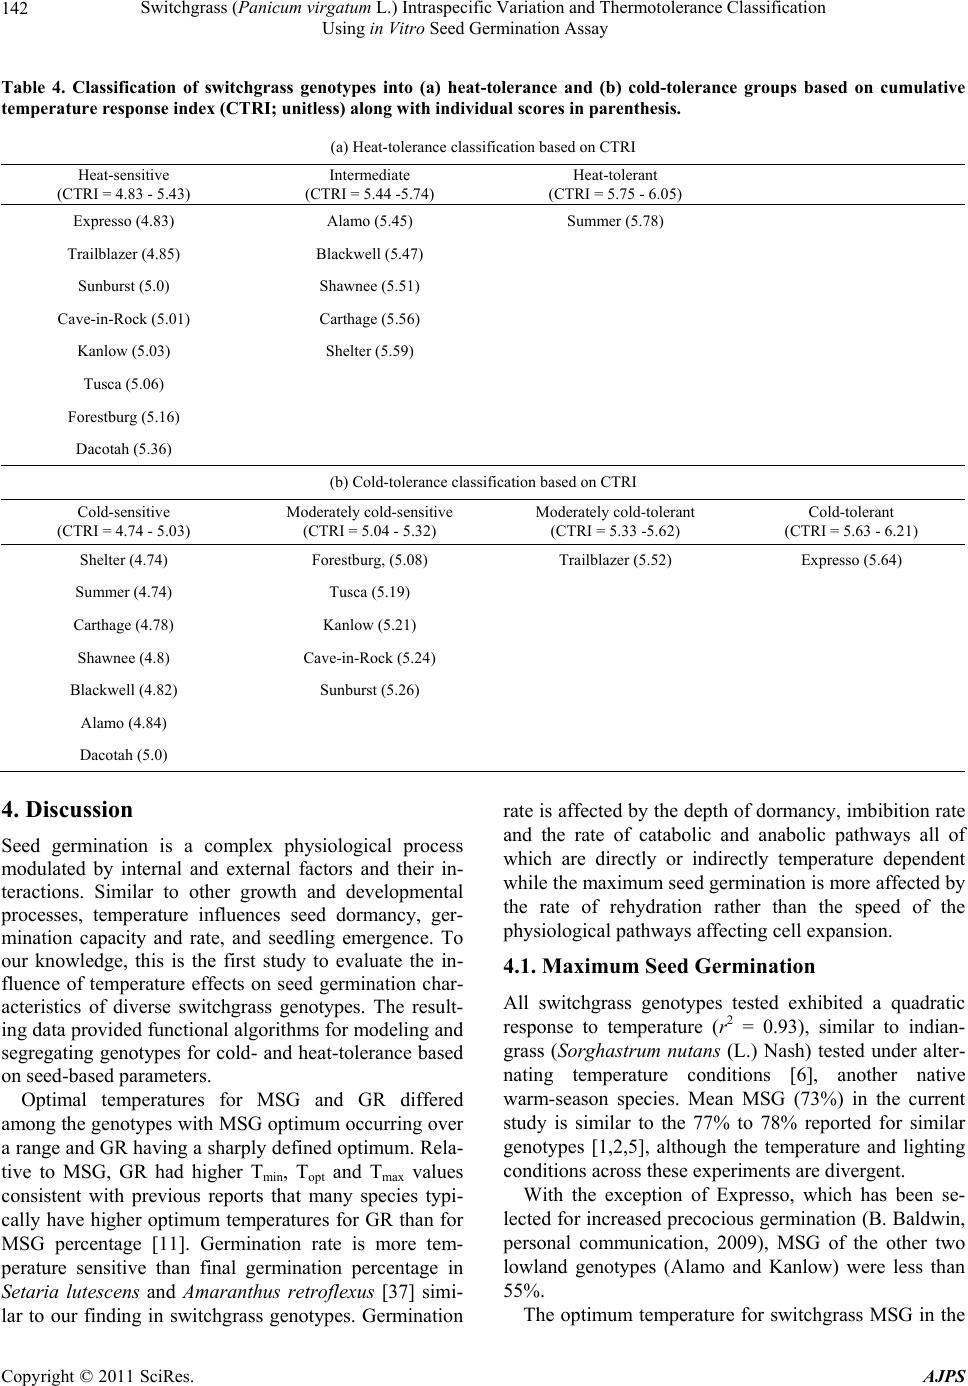 Switchgrass (Panicum virgatum L.) Intraspecific Variation and Thermotolerance Classification 142 Using in Vitro Seed Germination Assay Table 4. Classification of switchgrass genotypes into (a) heat-tolerance and (b) cold-tolerance groups based on cumulative temperature response index (CTRI; unitless) along with individual scores in parenthesis. (a) Heat-tolerance classification based on CTRI Heat-sensitive (CTRI = 4.83 - 5.43) Intermediate (CTRI = 5.44 -5.74) Heat-tolerant (CTRI = 5.75 - 6.05) Expresso (4.83) Alamo (5.45) Summer (5.78) Trailblazer (4.85) Blackwell (5.47) Sunburst (5.0) Shawnee (5.51) Cave-in-Rock (5.01) Carthage (5.56) Kanlow (5.03) Shelter (5.59) Tusca (5.06) Forestburg (5.16) Dacotah (5.36) (b) Cold-tolerance classification based on CTRI Cold-sensitive (CTRI = 4.74 - 5.03) Moderately cold-sensitive (CTRI = 5.04 - 5.32) Moderately cold-tolerant (CTRI = 5.33 -5.62) Cold-tolerant (CTRI = 5.63 - 6.21) Shelter (4.74) Forestburg, (5.08) Trailblazer (5.52) Expresso (5.64) Summer (4.74) Tusca (5.19) Carthage (4.78) Kanlow (5.21) Shawnee (4.8) Cave-in-Rock (5.24) Blackwell (4.82) Sunburst (5.26) Alamo (4.84) Dacotah (5.0) 4. Discussion Seed germination is a complex physiological process modulated by internal and external factors and their in- teractions. Similar to other growth and developmental processes, temperature influences seed dormancy, ger- mination capacity and rate, and seedling emergence. To our knowledge, this is the first study to evaluate the in- fluence of temperature effects on seed germination char- acteristics of diverse switchgrass genotypes. The result- ing data provided functional algorithms for modeling and segregating genotypes for cold- and heat-tolerance based on seed-based parameters. Optimal temperatures for MSG and GR differed among the genotypes with MSG optimum occurring over a range and GR having a sharply defined optimum. Rela- tive to MSG, GR had higher Tmin, Topt and Tmax values consistent with previous reports that many species typi- cally have higher optimum temperatures for GR than for MSG percentage [11]. Germination rate is more tem- perature sensitive than final germination percentage in Setaria lutescens and Amaranthus retroflexus [37] simi- lar to our finding in switchgrass genotypes. Germination rate is affected by the depth of dormancy, imbibition rate and the rate of catabolic and anabolic pathways all of which are directly or indirectly temperature dependent while the maximum seed germination is more affected by the rate of rehydration rather than the speed of the physiological pathways affecting cell expansion. 4.1. Maximum Seed Germination All switchgrass genotypes tested exhibited a quadratic response to temperature (r2 = 0.93), similar to indian- grass (Sorghastrum nutans (L.) Nash) tested under alter- nating temperature conditions [6], another native warm-season species. Mean MSG (73%) in the current study is similar to the 77% to 78% reported for similar genotypes [1,2,5], although the temperature and lighting conditions across these experiments are divergent. With the exception of Expresso, which has been se- lected for increased precocious germination (B. Baldwin, personal communication, 2009), MSG of the other two lowland genotypes (Alamo and Kanlow) were less than 55%. The optimum temperature for switchgrass MSG in the Copyright © 2011 SciRes. AJPS  Switchgrass (Panicum virgatum L.) Intraspecific Variation and Thermotolerance Classification 143 Using in Vitro Seed Germination Assay current study varied between 24.04˚C and 28.56˚C among the genotypes, which is within the range of values reported in other warm-season grasses; 20˚C to 30˚C for Cane beardgrass [Bothriochloa barbinodis (Lag.) Herter], sideoats grama [Bouteloua curtipendula (Michx.) Torr.], and tanglehead [Heteropogon contortus (L.) P. Beauv. ex Roem. & Schult.] [38] and 16.5˚C to 27˚C for indian- grass [39]. Maximum seed germination minimum tem- perature averaged 8.08˚C and ranged from 3.69 to 12.83˚C, which is similar to Tmin of other warm-season grasses [40]; 5.5˚C to 10.9˚C for switchgrass, 7.3˚C to 8.7˚C for big bluestem (Andropogon gerardii Vitman), 7.5˚C to 9.6˚C for indiangrass, and 4.5˚C to 7.9˚C for prairie sandreed (Calamovilfa longifolia (Hook.) Scribn.). 4.2. Germination Rate Thermal response of switchgrass seed germination is consistent with thermal response patterns of a number of other physiological processes [41]. At suboptimal tem- peratures (Tmin to Topt), germination rate (reciprocal time to 50% germination) generally increases linearly with temperature, but decreases linearly with temperature at supra-optimal temperatures (Topt to Tmax). This character- istic thermal response is similar to germination rate of chickpea (Cicer arietinum L.) [2,27], lentil (Lens culi- naris Medic.) and soybean (Glycine max (L.) Merr.) [27], pearl millet (Pennisetum glaucum (L.) R. Br.) [42], sor- ghum [Sorghum bicolor (L.) Moench.] [43] and cool season weeds [44]. A decline in germination rate with decreasing temperature is partly associated with decline in the imbibition rate observed with a reduction in tem- perature [45]. Germination rate response to temperature was described previously by two linear equations; the first describing the positive linear relationship between the minimum and optimum temperatures and the second describing the negative linear relationship between opti- mum and maximum temperature [2,27]. In the current study, GR was modeled using a single modified bilinear equation, which was previously used by several studies ([30-33,46]) to quantify pollen germination and pollen tube growth responses to temperature. Analogous to pol- len, seeds are considered independent functional units that are responsive to temperature changes. Even though MSG percentage is the most important parameter determining commercial value of seedlots, GR influences the uniformity and rapidity of emergence in nurseries [47]. Germination rates are most rapid at opti- mum temperature ranging from 29.5˚C to 35.6˚C. 4.3. Cardinal Temperatures Biological processes are typically characterized by car- dinal temperatures describing the range of temperature over which a process can occur. The effect of tempera- ture on seed germination can be expressed in terms of car- dinal temperatures, that is, Tmin, Topt, and Tmax at which germination will occur [48]. Cardinal temperatures may be used to describe the range of adaptation of a species. Though switchgrass is reported to be the most tem- perature specific of the warm-season grasses [15], there exists significant intra-specific differences in cardinal temperatures that may be related to the different areas of origin or adaptation [40,49]. The genotypes Cave-in- Rock, Dacotah, Forestburg, Shawnee, Shelter, Summer, Sunburst, and Trailblazer are from the cooler northern regions where average minimum temperatures range from –23.3˚C to –17.8˚C, while Alamo, Blackwell, Ex- presso, Kanlow, and Tusca are from warmer growing regions with average minimum temperatures ranging from –17.8˚C to 4.4˚C. Cardinal temperature coefficients can be directly compared for screening germplasm [44]. The cardinal temperatures derived for both MSG and GR can be used in evaluation of potential regions for intro- duction of switchgrass and also aid in on-farm opera- tional practices such as appropriate sowing dates when soil temperature would be conducive to optimum germi- nation and emergence and ultimately optimum stand es- tablishment and crop performance. Genotypes with lower Tmin values can be subjected to early-season sowing be- cause of their inherent capacity to germinate in cooler temperatures. The variability of cardinal temperatures both for MSG and GR indicates broad latitudinal adapta- tion across the various plant hardiness zones of the USA [50]. The cardinal temperatures derived for GR may be comparable with subsequent developmental stages of switchgrass ontogeny (morphological development). Kiniry et al. [16] assumed a base temperature of 12˚C for all growth stages of switchgrass in the ALMANAC model, however, the results in this study suggest that cardinal temperatures are genotype-specific and may be proc- ess-specific as well. Therefore, the derived cardinal tem- peratures in this study may be used to refine model algo- rithms for on-farm application and policy assessments. 4.4. Temperature Tolerance Classification Temperature tolerance refers to the ability of an organ- ism to cope with excessively high or low temperatures. Direct selection under field conditions is generally diffi- cult because uncontrollable environmental factors affect the precision and repeatability of such trials. Stress tol- erance is a developmentally regulated, stage-specific phenomenon; hence species may show different sensitiv- ity to stress at different developmental stages. All stages through a plant’s ontogeny are sensitive to temperature; Copyright © 2011 SciRes. AJPS  Switchgrass (Panicum virgatum L.) Intraspecific Variation and Thermotolerance Classification Using in Vitro Seed Germination Assay Copyright © 2011 SciRes. AJPS 144 will validate the use of seed-based parameters as a screening tool. This information is lacking in the litera- ture with respect to screening temperature tolerance of diverse switchgrass genotypes, even though several studies link intraspecific differences in germination to geographical and ecological areas of distribution or ori- gin [51]. therefore, screening for tolerance should be conducted at the most sensitive stage. Seed germination is temperature dependent and can be used to screen for temperature tol- erance. In vitro assays are not subjected to uncontrollable biotic and abiotic stress factors marring true tolerance potential. In the field, genotypes with high minimum temperature would experience little germination in early spring when temperatures would frequently drop below the Tmin level. The classification method tested suggests that CTRI for heat- and cold-tolerance are inversely related (r2 = 0.64, P = 0.0006), suggesting that it may be difficult to identify a cultivar that possesses both heat- and cold- tolerance characteristics (Figure 4). Variability among genotypes for heat- and cold-tolerance suggests that se- lection or breeding among genotypes is a viable objective. Switchgrass adaptation to a specific ecoclimatic and ed- aphic region is determined by the growth rate, photope- riodism, heat tolerance, and cold or freezing tolerance of a specific genotype [10]. In the current study, the successful use of CTRI, based on the summation of individual temperature response indices and then separated by standard deviation based on the number of classes of interest, confirms that seed-based parameters derived from in vitro seed germi- nation assay can be used for genotype temperature toler- ance classification. Genotype variability associated with temperature tolerance was demonstrated in this study. Alamo, Blackwell, Carthage, Dacotah, Shawnee, Shelter, and Summer were classified as cold-sensitive while Ex- presso was classified as cold-tolerant. Conversely, Cave- in-Rock, Dacotah, Expresso, Forestburg, Kanlow, Sun- burst, Trailblazer, and Tusca were determined to be heat-sensitive and Summer as heat-tolerant. Since basal temperature tolerance is a function of genetics and ac- quired temperature tolerance is latitude and tempera- ture-induced, corroborating seed-based temperature tol- erance with vegetative or other reproductive responses Ecotype classification in this study did not necessarily confer the temperature tolerance characteristic of a spe- cific ecotype. For example, Alamo, a lowland genotype, was classified as intermediately heat-tolerant while Summer, an upland genotype was classified as heat- tolerant using seed-based parameters. Genotype tempera- ture tolerance is determined not only by ecotypic classi- fication, but also latitude of origin, photoperiodism and Figure 4. The relationship between heat- and cold-tolerance cumulative temperature response index (CTRI) for 14 swi tchgr ass genotypes.  Switchgrass (Panicum virgatum L.) Intraspecific Variation and Thermotolerance Classification 145 Using in Vitro Seed Germination Assay genetics. Being photoperiod sensitive [52], switchgrass morphological development is determined primarily by its response to daylength [53]. Since ecotypic classifica- tion are more related to photoperiod responsiveness than temperature, the small or little variation observed be- tween upland and lowland ecotypes for seed germination characteristics may be as result of ecotypic temperature insensitivity. Since tolerance mechanisms are developmentally regulated, it is prudent to validate controlled in vitro seed germination assay with field performance tests. In the current study, GR and MSG were evaluated as estimators of temperature tolerance using 14 diverse genotypes. Using similar techniques, 12 genotypes of sorghum were screened for cold tolerance in controlled in vitro germi- nation studies and GR was found to be strongly corre- lated with rate of emergence under field conditions, con- firming that screening using parameters based on in vitro studies is a rapid and reliable method for handling large number of genotypes before evaluation in the field [26]. The current study quantified the relation between GR and temperature, highlighting genotypic differences. It is necessary in future work, therefore, to determine whether in vitro seed germination assay has potential in selection and screening procedures in breeding programs. 5. Conclusions The current study quantified the effects of temperature on seed germination rate and capacity of 14 diverse switchgrass genotypes and determined the cardinal tem- peratures for MSG and GR. Genotypic variability for MSG, GR, their respective cardinal temperatures, and TAR were found to exist among the switchgrass geno- types tested. Mean minimum temperatures for MSG and GR were 8.08˚C and 11.1˚C, respectively, while opti- mum temperatures were 26.6˚C and 33.1˚C, respectively. The cumulative temperature response index method used in the current study identified both heat and cold tolerant genotypes and demonstrated that variability existed among genotypes and ecotypes. The cardinal temperature estimates would be useful to improve switchgrass models for field applications. Additionally, the identified cold- and heat-tolerant genotypes can be selected for niche environments and in switchgrass breeding programs to develop new genotypes for cold and hot environments. 6. Acknowledgements The authors are grateful to Ernst Seed Company for providing seeds of 5 switchgrass genotypes. This research was funded in part by the Department of Energy through Sustainable Energy Center, Mississippi State University, Mississippi State, MS, the USDA-UV-B Monitoring and Research Program, and the USDA-ARS 58-6402-7-241. This article has been approved for publication as Journal Article No. J11898 of the Mississippi Agricultural and Forestry Experiment Station, Mississippi State University. REFERENCES [1] G. Hacisalihoglu, “Responses of Three Switchgrass (Panicum virgatum L.) Cultivars to Seed Priming and Differential Aging Conditions,” Acta Agriculturae Scan- dinavica Section B-Soil and Plant Science, Vol. 58, No. 3, 2008, pp. 280-284. [2] G. E. Aiken and T. L. Springer, “Seed Size Distribution, Germination, and Emergence of Six Switchgrass Culti- vars,” Journal of Range Ma nagement, Vol. 48, No. 5, 1995, pp. 455-458. doi:10.2307/4002252 [3] F. H. Hsu, C. J. Nelson and W. S. Chow, “A Mathemati- cal Model to Utilize the Logistic Function in Germination and Seedling Growth,” Journal of Experimental Botany, Vol. 35, No. 11, 1984, pp. 1629-1640. doi:10.1093/jxb/35.11.1629 [4] W. Robocker, J. Curtis and H. Ahlgren, “Some Factors Affecting Emergence and Establishment of Native Grass Seedlings in Wisconsin,” Ecology, Vol. 34, No. 1, 1953, pp. 194-199. doi:10.2307/1930322 [5] J. D. Hanson and H. A. Johnson, “Germination of Swi- tchgrass under Various Temperature and pH Regimes,” Seed Technology, Vol. 27, No. 2, 2005, pp. 203-210. [6] T. E. Fulbright, “Effects of Temperature, Water Potential and Sodium Chloride on Indiangrass Germination,” Jour- nal of Range Management, Vol. 41, No. 3, 1988, pp. 207- 210. doi:10.2307/3899168 [7] S. B. McLaughlin and M. E. Walsh, “Evaluating Envi- ronmental Consequences of Producing Herbaceous Crops for Bioenergy,” Biomass and Bioenergy, Vol. 14, No. 4, 1998, pp. 317-324. doi:10.1016/S0961-9534(97)10066-6 [8] M. K. Das, R. G. Fuentes and C. M. Taliaferro, “Genetic Variability and Trait Relationships in Switchgrass,” Crop Science, Vol. 44, No. 2, 2004, pp. 443-448. [9] S. A. Eberhart and L. C. Newell, “Variation in Domestic Collections of Switchgrass, Panicum virgatum L,” Agronomy Journal, Vol. 51, No. 10, 1959, pp. 613-616. doi:10.2134/agronj1959.00021962005100100015x [10] M. D. Casler, et al., “Latitudinal and Longitudinal Adap- tation of Switchgrass Populations,” Crop Science, Vol. 47, No. 6, 2007, pp. 2249-2260. doi:10.2135/cropsci2006.12.0780 [11] E. H. Roberts, “Temperature and Seed Germination,” In: S. P. Long and F. I. Woodword, Eds., Plants and Tem- perature, Symposia of the Society for Experimental Biol- ogy, Cambridge, 1988, pp. 109-132. [12] G. L. Jordan and M. R. Haferkamp, “Temperature Re- sponses and Calculated Heat Units for Germination of Several Range Grasses and Shrubs,” Journal of Range Copyright © 2011 SciRes. AJPS  Switchgrass (Panicum virgatum L.) Intraspecific Variation and Thermotolerance Classification 146 Using in Vitro Seed Germination Assay Management, Vol. 42, No. 1, 1989, pp. 41-45. doi:10.2307/3899656 [13] R. Ellis, E. Roberts and P. Hebblethwaite, “Towards a Rational Basis for Testing Seed Quality,” In: P. Heb- blethwaite, Ed., Seed Production, Butterworths, London, 1980, pp. 605-635. [14] D. J. Parrish and J. H. Fike, “The Biology and Agronomy of Switchgrass for Biofuels,” Critical Reviews in Plant Sciences, Vol. 24, No. 5-6, 2005, pp. 423-459. doi:10.1080/07352680500316433 [15] F. H. Hsu, C. J. Nelson and A. G. Matches, “Temperature Effects on Germination of Perennial Warm-Season For- age Grasses,” Crop Science, Vol. 25, No. 2, 1985, pp. 215-215. doi:10.2135/cropsci1985.0011183X002500020005x [16] J. R. Kiniry, et al., “Switchgrass Simulation by the AL- MANAC Model at Diverse Sites in the Southern US,” Biomass and Bioenergy, Vol. 29, No. 6, 2005, pp. 419-425. doi:10.1016/j.biombioe.2005.06.003 [17] E. Heaton, T. Voigt and S. P. Long, “A Quantitative Re- view Comparing the Yields of Two Candidate C4 Peren- nial Biomass Crops in Relation to Nitrogen, Temperature and Water,” Biomass and Bioenergy, Vol. 27, No. 1, 2004, pp. 21-30. doi:10.1016/j.biombioe.2003.10.005 [18] S. McLaughlin, et al., “Developing Switchgrass as a Bio- energy Crop,” In: J. Janick, Ed., Perspectives on New Crops and New Uses, ASHS Press, Alexandria, 1999. pp. 282-289. [19] P. S. Setimela, et al., “Screening Sorghum Seedlings for Heat Tolerance Using a Laboratory Method,” European Journal of Agronomy, Vol. 23, No. 2, 2005, pp. 103-107. doi:10.1016/j.eja.2004.09.008 [20] M. Bouslama and W. T. Schapaugh Jr, “Stress Tolerance in Soybeans. I. Evaluation of Three Screening Techniques for Heat and Drought Tolerance,” Crop Science, Vol. 24, No. 5, 1984, pp. 933-933. doi:10.2135/cropsci1984.0011183X002400050026x [21] S. Sadasivam, et al., “Genetic Variation in Seed Germi- nation, Root Traits and Drought Recovery in Rice,” In- dian Journal of Plant Physiology, Vol. 5, No. 1, 2000, pp. 73-78. [22] M. R. Foolad and G. Y. Lin, “Genetic Potential for Salt Tolerance during Germination in Lycopersicon Species,” HortScience, Vol. 32, 1997, pp. 296-300. [23] N. Misra and U. N. Dwivedi, “Genotypic Difference in Salinity Tolerance of Green Gram Cultivars,” Plant Sci- ence, Vol. 166, No. 5, 2004, pp. 1135-1142. doi:10.1016/j.plantsci.2003.11.028 [24] F. F. Hou and F. S. Thseng, “Studies on the Screening Technique for Pre-Germination Flooding Tolerance in Soybean,” Japanese Journal of Crop Science, Vol. 61, No. 3, 1992, pp. 447-453. doi:10.1016/j.plantsci.2003.11.028 [25] S. N. Acharya, J. Dueck and R. K. Downey, “Selection and Heritability Studies on Canola/Rapeseed for Low Temperature Germination,” Canadian Journal of Plant Science, Vol. 63, No. 2, 1983, pp. 377-384. doi:10.4141/cjps83-043 [26] I. Tiryaki and D. J. Andrews, “Germination and Seedling Cold Tolerance in Sorghum. I. Evaluation of Rapid Screening Methods,” Agronomy Journal, Vol. 93, No. 6, 2001, pp. 1386-1391. doi:10.2134/agronj2001.1386 [27] S. Covell, et al., “The Influence of Temperature on Seed Germination Rate in Grain Legumes. I. A Comparison of Chickpea, Lentil, Soybean and Cowpea at Constant Temperatures,” Journal of Experimental Botany, Vol. 37, No. 5, 1986, pp. 705-715. doi:10.1093/jxb/37.5.705 [28] B. N. Emerson and H. C. MiNor, “Response of Soybeans to High Temperature during Germination,” Crop Science, Vol. 19, No. 4, 1979, pp. 553-553. doi:10.2135/cropsci1979.0011183X001900040029x [29] S. Koti, et al., “Soybean (Glycine Max) Pollen Germina- tion Characteristics, Flower and Pollen Morphology in Response to Enhanced Ultraviolet-B Radiation,” Annals of Botany, Vol. 94, No. 6, 2004, pp. 855. doi:10.1093/aob/mch212 [30] M. A. Salem, et al., “Pollen-based Screening of Soybean Genotypes for High Temperatures,” Crop Science, Vol. 47, No. 1, 2007, pp. 219-231. doi:10.2135/cropsci2006.07.0443 [31] V. G. Kakani, et al., “Response of in Vitro Pollen Ger- mination and Pollen Tube Growth of Groundnut (Arachis hypogaea L.) Genotypes to Temperature,” Plant Cell and Environment, Vol. 25, No. 12, 2002, pp. 1651-1661. doi:10.1046/j.1365-3040.2002.00943.x [32] V. G. Kakani, et al., “Differences in in vitro Pollen Ger- mination and Pollen Tube Growth of Cotton Cultivars in Response to High Temperature,” Annals of Botany, Vol. 96, No. 1, 2005, pp. 59-67. doi:10.1093/aob/mci149 [33] S. K. Singh, et al., “Assessment of Cold and Heat Toler- ance of Winter-Grown Canola (Brassica napus L.) Culti- vars by Pollen-Based Parameters,” Journal of Agronomy and Crop Science, Vol. 194, No. 3, 2008, pp. 225-236. doi:10.1111/j.1439-037X.2008.00309.x [34] Z. X. Shen, et al., “Stratification in Switchgrass Seeds is Reversed and Hastened by Drying,” Crop Science, Vol. 41, No. 5, 2001, pp. 1546-1551. doi:10.2135/cropsci2001.4151546x [35] Systat Software Inc., “SigmaPlot 10.0—User’s Guide,” Point Richmond, 2006. [36] SAS Institute Inc., “SAS/STAT User’s Guide, Version 9.1.3.” SAS Institute Inc., Cary, 2004. [37] D. J. Schimpf, S. D. Flint and I. G. Palmblad, “Represen- tation of Germination Curves with the Logistic Function,” Annals of Botany, Vol. 41, No. 6, 1977, pp. 1357-1360. [38] B. A. Roundy and S. H. Biedenbender, “Germination of Warm-Season Grasses under Constant and Dynamic Temperatures,” Journal of Range Management, Vol. 49, No. 5, 1996, pp. 425-431. doi:10.2307/4002924 [39] D. G. Sabo and R. M. Forest, “Germination Requirements of 19 Species of Arid Land Plants,” Rocky Mountain Copyright © 2011 SciRes. AJPS  Switchgrass (Panicum virgatum L.) Intraspecific Variation and Thermotolerance Classification Using in Vitro Seed Germination Assay Copyright © 2011 SciRes. AJPS 147 Forest and Range Experiment Station, Forest Service, US Department of Agriculture, 1979. [40] I. C Madakadze, et al., “Variation in Base Temperatures for Germination in Warm Season Grasses,” Seed Science and Technology, Vol. 29, No. 1, 2001, pp. 31-38. [41] R. Probert, “The Role of Temperature in the Regulation of Seed Dormancy and Germination,” In: M. Fenner, Ed., The Ecology of Regeneration in Plant Communities, CABI Publishing, Wallingford, 2000, pp. 261-292. doi:10.1079/9780851994321.0261 [42] J. Garcia-Huidobro, J. L. Monteith and G. R. Squire, “Time, Temperature and Germination of Pearl Millet (Pennisetum Typhoides S. & H.) I. Constant Tempera- ture,” Journal of Experimental Botany, Vol. 33, No. 2, 1982, pp. 288-296. doi:10.1093/jxb/33.2.288 [43] R. L. Benech-ArNold, et al., “Temperature Effects on Dormancy Release and Germination Rate in Sorghum halepense (L.) Pers. Seeds: A Quantitative Analysis,” Weed Research, Vol. 30, No. 2, 1990, pp. 81 - 89. [44] S. P. Hardegree, “Predicting Germination Response to Temperature. I. Cardinal-Temperature Models and Sub- population-Specific Regression,” Annals of Botany, Vol. 97, No. 6, 2006, pp. 1115-1125. doi:10.1093/aob/mcl071 [45] M. Lopez, et al., “The Effect of Temperature and Water Stress on Laboratory Germination of Eucalyptus Globu- lus Labill. Seeds of Different Sizes,” Annals of Forest Science, Vol. 57, No. 3, 2000, pp. 245-250. doi:10.1051/forest:2000115 [46] K. R. Reddy and V. G. Kakani, “Screening Capsicum Species of Different Origins for High Temperature Tol- erance by in Vitro Pollen Germination and Pollen Tube Length,” Scientia Horticulturae, Vol. 112, No. 2, 2007, pp. 130-135. doi:10.1016/j.scienta.2006.12.014 [47] Y. A. El-Kassaby, et al., “Seed Germination: Mathemati- cal Representation and Parameters Extraction,” Forest Science, Vol. 54, No. 2, 2008, pp. 220-227. [48] L. Copeland and M. B. McDonald, “Principles of Seed Science and Technology,” 4th Edtion, Springer, Berlin, 2001. [49] M. D. Casler and A. R. Boe, “Cultivar X Environment Interactions in Switchgrass,” Crop Science, Vol. 43, No. 6, 2003, pp. 2226-2233. doi:10.2135/cropsci2003.2226 [50] M. D. Casler, et al., “Latitudinal Adaptation of Switch- grass Populations,” Crop Science, Vol. 44, No. 1, 2004, pp. 293-303. [51] A. Orozco-Segovia, et al., “A Mathematical Model that Uses Gaussian Distribution to Analyze the Germination of Manfreda brachystachya (Agavaceae) in a Thermo- gradient,” Physiologia Plantarum, Vol. 98, No. 3, 1996, pp. 431-438. doi:10.1111/j.1399-3054.1996.tb05696.x [52] L. E. Moser and K. P. Vogel, “Switchgrass, Big Bluestem and Indiangrass,” In: R. F. Barnes, D. A. Miller and C. J. Nelson, Eds., An Introduction to Grassland Agriculture, Iowa State University Press, Ames, 1995, pp. 409-420. [53] R. Mitchell and L. Moser, “Developmental Morphology and Tiller Dynamics of Warm-Season Grass Swards,” In: Anderson, Ed., CSSA, Madison, 2000, pp. 49-66.
|