Paper Menu >>
Journal Menu >>
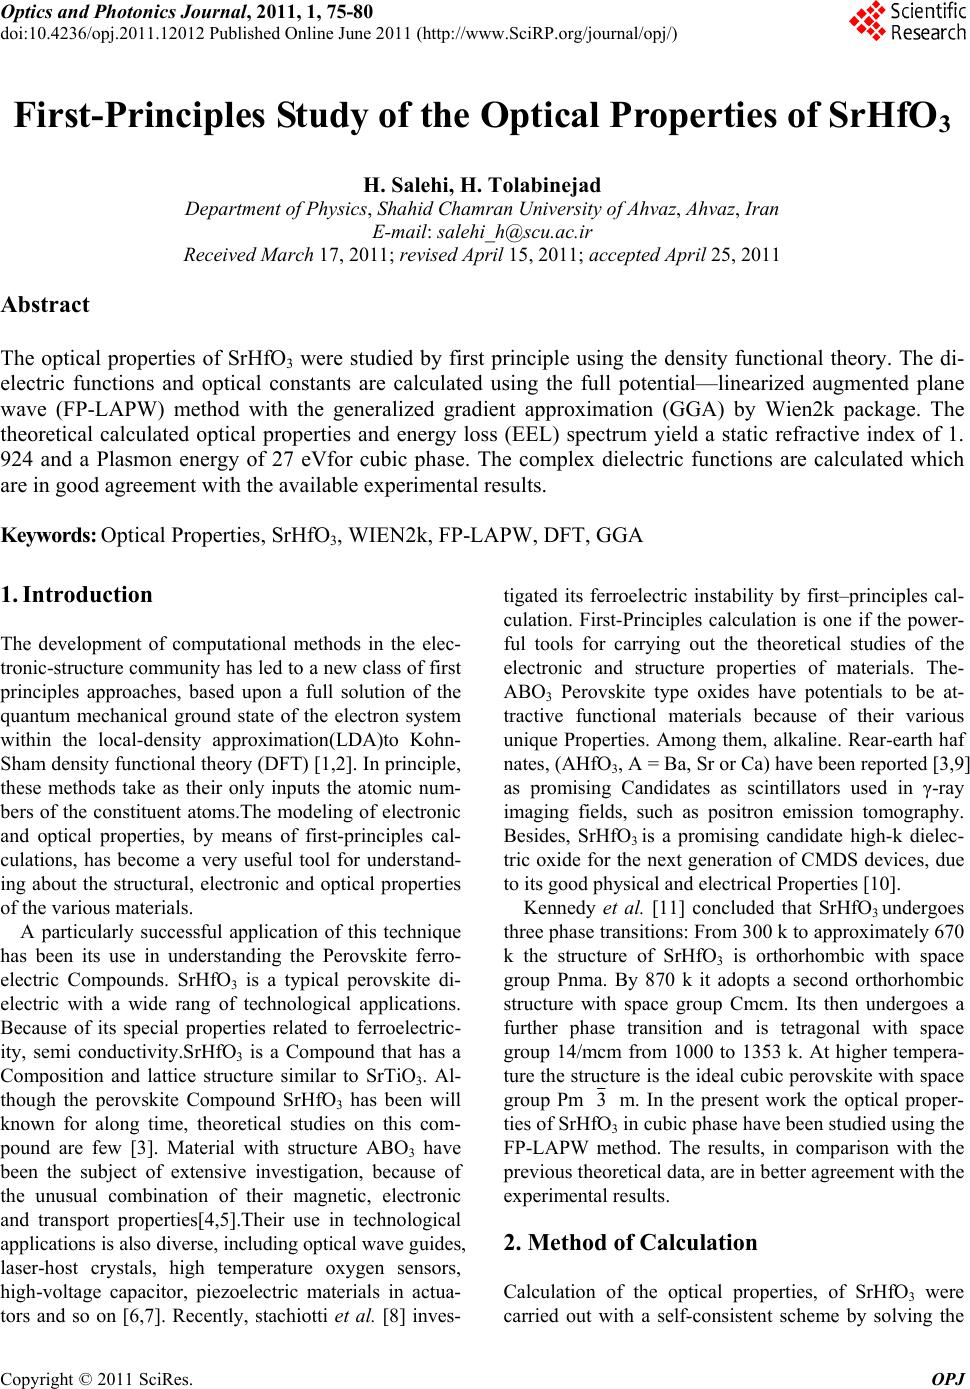 Optics and Photonics Journal, 2011, 1, 75-80 doi:10.4236/opj.2011.12012 Published Online June 2011 (http://www.SciRP.org/journal/opj/) Copyright © 2011 SciRes. OPJ First-Principles Study of the Optical Properties of SrHfO3 H. Salehi, H. Tolabinejad Department of Physics, Shahid Chamran University of Ahvaz, Ahvaz, Iran E-mail: salehi_h@scu.ac.ir Received March 17, 2011; revised April 15, 2011; accepted April 25, 2011 Abstract The optical properties of SrHfO3 were studied by first principle using the density functional theory. The di- electric functions and optical constants are calculated using the full potential—linearized augmented plane wave (FP-LAPW) method with the generalized gradient approximation (GGA) by Wien2k package. The theoretical calculated optical properties and energy loss (EEL) spectrum yield a static refractive index of 1. 924 and a Plasmon energy of 27 eVfor cubic phase. The complex dielectric functions are calculated which are in good agreement with the available experimental results. Keywords: Optical Properties, SrHfO3, WIEN2k, FP-LAPW, DFT, GGA 1. Introduction The development of computational methods in the elec- tronic-structure community has led to a new class of first principles approaches, based upon a full solution of the quantum mechanical ground state of the electron system within the local-density approximation(LDA)to Kohn- Sham density functional theory (DFT) [1,2]. In principle, these methods take as their only inputs the atomic num- bers of the constituent atoms.The modeling of electronic and optical properties, by means of first-principles cal- culations, has become a very useful tool for understand- ing about the structural, electronic and optical properties of the various materials. A particularly successful application of this technique has been its use in understanding the Perovskite ferro- electric Compounds. SrHfO3 is a typical perovskite di- electric with a wide rang of technological applications. Because of its special properties related to ferroelectric- ity, semi conductivity.SrHfO3 is a Compound that has a Composition and lattice structure similar to SrTiO3. Al- though the perovskite Compound SrHfO3 has been will known for along time, theoretical studies on this com- pound are few [3]. Material with structure ABO3 have been the subject of extensive investigation, because of the unusual combination of their magnetic, electronic and transport properties[4,5].Their use in technological applications is also diverse, including optical wave guides, laser-host crystals, high temperature oxygen sensors, high-voltage capacitor, piezoelectric materials in actua- tors and so on [6,7]. Recently, stachiotti et al. [8] inves- tigated its ferroelectric instability by first–principles cal- culation. First-Principles calculation is one if the power- ful tools for carrying out the theoretical studies of the electronic and structure properties of materials. The- ABO3 Perovskite type oxides have potentials to be at- tractive functional materials because of their various unique Properties. Among them, alkaline. Rear-earth haf nates, (AHfO3, A = Ba, Sr or Ca) have been reported [3,9] as promising Candidates as scintillators used in γ-ray imaging fields, such as positron emission tomography. Besides, SrHfO3 is a promising candidate high-k dielec- tric oxide for the next generation of CMDS devices, due to its good physical and electrical Properties [10]. Kennedy et al. [11] concluded that SrHfO3 undergoes three phase transitions: From 300 k to approximately 670 k the structure of SrHfO3 is orthorhombic with space group Pnma. By 870 k it adopts a second orthorhombic structure with space group Cmcm. Its then undergoes a further phase transition and is tetragonal with space group 14/mcm from 1000 to 1353 k. At higher tempera- ture the structure is the ideal cubic perovskite with space group Pm 3 m. In the present work the optical proper- ties of SrHfO3 in cubic phase have been studied using the FP-LAPW method. The results, in comparison with the previous theoretical data, are in better agreement with the experimental results. 2. Method of Calculation Calculation of the optical properties, of SrHfO3 were carried out with a self-consistent scheme by solving the 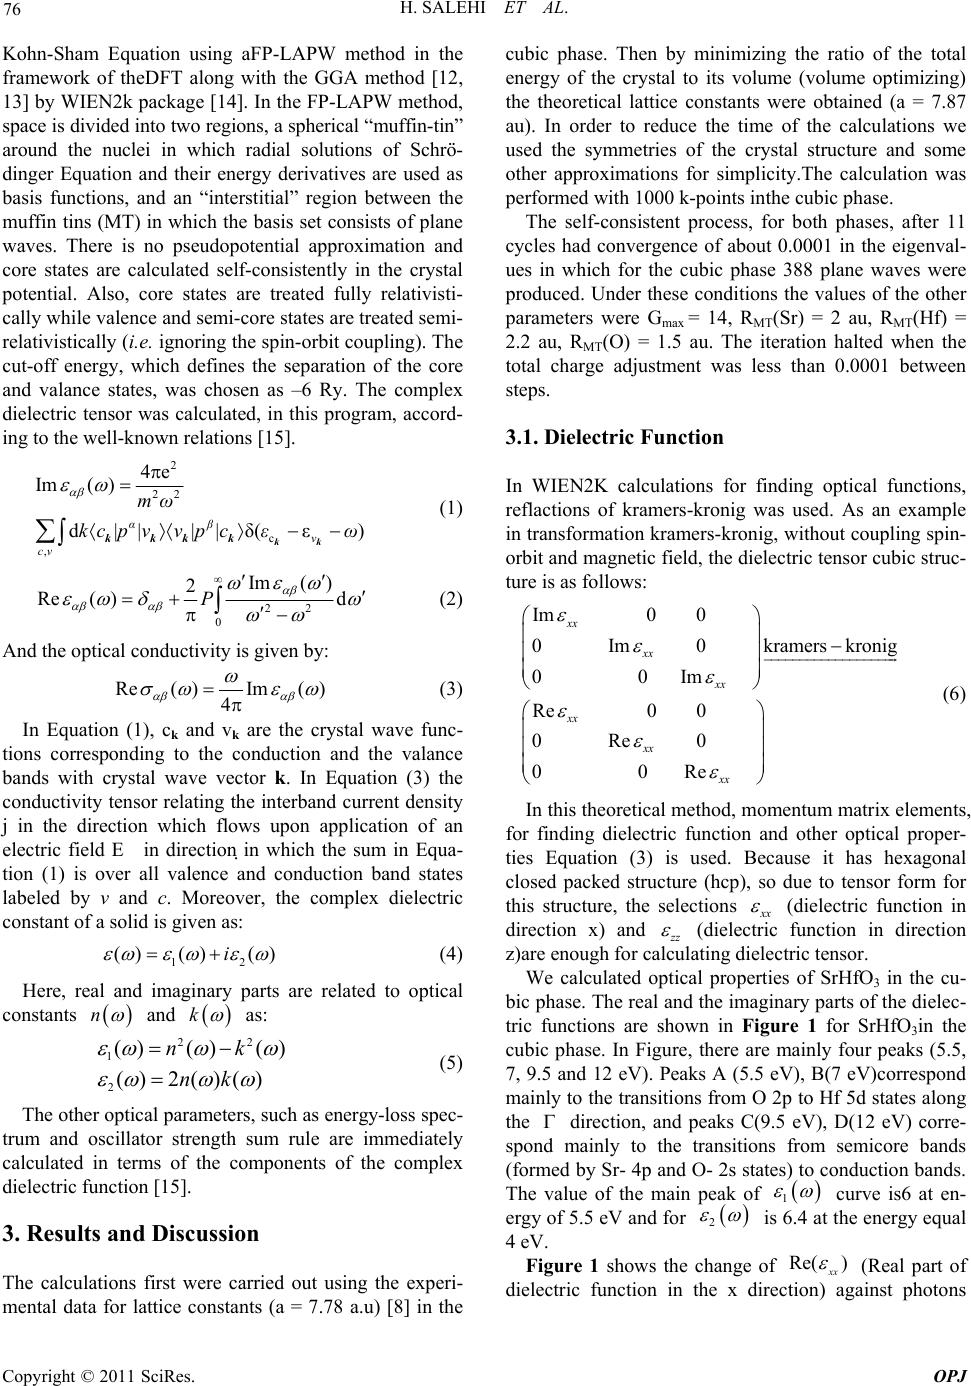 H. SALEHI ET AL. Copyright © 2011 SciRes. OPJ 76 Kohn-Sham Equation using aFP-LAPW method in the framework of theDFT along with the GGA method [12, 13] by WIEN2k package [14]. In the FP-LAPW method, space is divided into two regions, a spherical “muffin-tin” around the nuclei in which radial solutions of Schrö- dinger Equation and their energy derivatives are used as basis functions, and an “interstitial” region between the muffin tins (MT) in which the basis set consists of plane waves. There is no pseudopotential approximation and core states are calculated self-consistently in the crystal potential. Also, core states are treated fully relativisti- cally while valence and semi-core states are treated semi- relativistically (i.e. ignoring the spin-orbit coupling). The cut-off energy, which defines the separation of the core and valance states, was chosen as –6 Ry. The complex dielectric tensor was calculated, in this program, accord- ing to the well-known relations [15]. 2 22 c , 4e Im( ) d|| ||δ(ε) αβ v cv mω kc pvv pcεω kk kkkk (1) 22 0 Im( ) 2 Re()dP (2) And the optical conductivity is given by: Re( )Im() 4 (3) In Equation (1), ck and vk are the crystal wave func- tions corresponding to the conduction and the valance bands with crystal wave vector k. In Equation (3) the conductivity tensor relating the interband current density j in the direction which flows upon application of an electric field E in direction in which the sum in Equa- tion (1) is over all valence and conduction band states labeled by v and c. Moreover, the complex dielectric constant of a solid is given as: 12 () ()()i (4) Here, real and imaginary parts are related to optical constants n and k as: 22 1 2 ()()() () 2()() nk nk (5) The other optical parameters, such as energy-loss spec- trum and oscillator strength sum rule are immediately calculated in terms of the components of the complex dielectric function [15]. 3. Results and Discussion The calculations first were carried out using the experi- mental data for lattice constants (a = 7.78 a.u) [8] in the cubic phase. Then by minimizing the ratio of the total energy of the crystal to its volume (volume optimizing) the theoretical lattice constants were obtained (a = 7.87 au). In order to reduce the time of the calculations we used the symmetries of the crystal structure and some other approximations for simplicity.The calculation was performed with 1000 k-points inthe cubic phase. The self-consistent process, for both phases, after 11 cycles had convergence of about 0.0001 in the eigenval- ues in which for the cubic phase 388 plane waves were produced. Under these conditions the values of the other parameters were Gmax = 14, RMT(Sr) = 2 au, RMT(Hf) = 2.2 au, RMT(O) = 1.5 au. The iteration halted when the total charge adjustment was less than 0.0001 between steps. 3.1. Dielectric Function In WIEN2K calculations for finding optical functions, reflactions of kramers-kronig was used. As an example in transformation kramers-kronig, without coupling spin- orbit and magnetic field, the dielectric tensor cubic struc- ture is as follows: Im0 0 0Im0kramers kronig 00Im Re00 0Re0 00Re xx xx xx xx xx xx (6) In this theoretical method, momentum matrix elements, for finding dielectric function and other optical proper- ties Equation (3) is used. Because it has hexagonal closed packed structure (hcp), so due to tensor form for this structure, the selections x x (dielectric function in direction x) and z z (dielectric function in direction z)are enough for calculating dielectric tensor. We calculated optical properties of SrHfO3 in the cu- bic phase. The real and the imaginary parts of the dielec- tric functions are shown in Figure 1 for SrHfO3in the cubic phase. In Figure, there are mainly four peaks (5.5, 7, 9.5 and 12 eV). Peaks A (5.5 eV), B(7 eV)correspond mainly to the transitions from O 2p to Hf 5d states along the direction, and peaks C(9.5 eV), D(12 eV) corre- spond mainly to the transitions from semicore bands (formed by Sr- 4p and O- 2s states) to conduction bands. The value of the main peak of 1 curve is6 at en- ergy of 5.5 eV and for 2 is 6.4 at the energy equal 4 eV. Figure 1 shows the change of Re( ) xx (Real part of dielectric function in the x direction) against photons  H. SALEHI ET AL. Copyright © 2011 SciRes. OPJ 77 (a) (b) Figure 1. (a) Real and (b) imaginary part of the dielectric function for SrHfO3 in cubic phase. (a) (b) Figure 2. (a) Real and (b) imaginary part of the optical conductivity for SrHfO3 in cubic phase. Table 1. SrHfO3 static refractive index in cubic phase cal- culated by various methods. Present work Other work FP-LAPWG GA96 FP-LAPWG GA91 FP-LAP- WLDA Experimental [16] Refractive index (n) 1.924 1.9050 1.867 2 Difference with exp. (%) 3.8 4.75 6.65 - 3.7 3.63 3.5 4 energy. In the zero energy level, the magnitude of di- electric function, (0) is equal to 3.7. By the relation nik N , the root of dielectric function will give the refraction coefficient of 3 SrHfO which is equal to 03.7 1.924nn . The magnitude of experimental refraction coefficient for 3 SrHfO is 2 [16] which has a good agreement. The first peak of Im is contributed to transition from the upper valence bands to the lower conduction band. Our calculated in direct R band gap of 3 SrHfO is about 3.7 eV. The real part of the dielectric function (Re ) follow from the Kramer-kronig relationship. All Optical con- stant may by derived from this. Referring to Table 1 , it can be seen that the calculated refractive index in this work is in agreement with ex- perimental results. 3.2. Optical Conduction The real and the imaginary parts of optical conductivity are shown in Figure 2 for SrHfO3 in cubic phase. In this theoretical method, momentum matrix elements is used for finding dielectric function and other optical properties. Also we have used transformation Kram- ers-Kronig for calculating real part dielectric tensor.  H. SALEHI ET AL. Copyright © 2011 SciRes. OPJ 78 Notice that, occupied electron states are excited to unoc- cupied electron states in upper Fermi level by absorbing photons.This interband transition is called optical con- duction (also called Drude transition) and photon absorp- tion by electron is called interband absorption. Figure 4 shows the change of real part of optical con- duction (in1015 s-1) in the X direction with respect to in- ternal photon energy. As in the Figure 2, the optical conduction starts with energy of about 2eV and by in- creasing photon energy, the optical conduction will rises and in the range of 6.5 till 7 eV, will reach to the upper level. The reason of starting optical conduction, () , from 2eV energy, is the gap of energy. So the ex- cited electrons have no enough energy to pass the energy gap, and transfer to the conduction band. For the absorption coefficient, () , the absorption edge start from about 3.4 eV, corresponding to the direct transition. The maximum reflectivity about13eV, ie the minimum value 1 will occur. In the regime in- cident beam energy, has not been reached to create a new exaction mode yet or can prepar interband transition and thus waves will be completely reflectivity. The peak function () also in energy 11.5 eV can be seen, and with this mean the most value absorption in the band gap, which the matter cannot exhibit any trans- parency. In Figure 3 the optical parameters is shown for SrHfO3 in cubic phase. The static refractive index value for SrHfO3 in the cubic phase calculated in this work, and the values obtained by other methods are summarized in Table 1. If we assume assume orientation of the crystal surface parallel to the optical axis, the reflectivity ()R fol- lows directly from Fresnels formula. 2 () 1 () () 1 R (7) Expression for the absorption coefficient ()I now follow: 1/2 22 121 () 2()()()()I (8) 3.3. Electron Energy Loss Spectroscopy EELS is a valuable tool for investigating various aspects of materials. It has the advantage of covering the complete energy range including non-scattered and elastically Tabel 2. The value transition interband. Transition First Two Three Four Five E(eV) 5.5 6.7 9.5 10.5 11.2 scattered electrons (Zero Loss). At intermediate energies (typically1 to50 eV) the energy losses are due primarily to a complicated mixture of single electron excitations and collective excitations (plasmons). The positions of the sin- gle electron excitation peaks are related to the joint density of states between the conduction and valence bands, whereas the energy required for the excitation of bulk plasmons depends mainly on the electron density in the solid. Here electrons, which excite the atoms electrons of the outer shell is called Valence Loss or valence intera- band transitions. At higher energies, typically a few hun- dred eV, edges can be seen in the spectrum, indicating the onset of excitations from the various inner atomic shells to the conduction band.In this case the fast electrons excite the inner shell electrons (Core Loss)or induce core level excitation of Near Edge Structure (ELNES) and XANES. The edges are characteristic of particular elements and their energy and height can be used for elemental analysis. In the case of interband transitions, which consist mostly of plasmon excitations, the scattering probability for volume losses is directly connected to the energy loss function. One can then calculate the EEL spectrum from the following relations. 12 2 22 12 ()i and EELSpectrumIm[1/()] (9) These peaks can, however, have different origins such as charge carrier plasmons and interband or intraband excitations. The energy of the maximum peak of Im 1 at 27 eV is assigned to the energy of the volume plasmon p . The first peak at 9 eV and second peak at 13eV originates from O-2p to Hf-3d and Sr-p or- bitals, respectively Figure 4. The value of p obtained in this work and for free electron is given in Table 3. For free electrons the plasmon energy is calculated according to the following model: 2 0 e p ne m (10) If we use this model, then what should be the number of valance electrons per SrHfO3 molecule, N, used to calculate the density of valance electrons, n, and thus the plasmon energy in Equation (7). If we take only the con- tribution of 4s2, 4p6 and 5s2 electrons of Sr, 5s2, 5p6, 5d10 and 6s2of Hf and2s2, 2p4 of O(ignoring the contribution of 5s2 and 2s2 electron of Sr and O atom respectively) and the free and electron plasmon energy will be 31eV. Otherwise, with all valance electrons of Sr, Hf and O atoms, the free electron plasmon would be 38.6eV. We will also see from sum rule is a reasonable value for the valance electrons per SrHfO3 molecule. 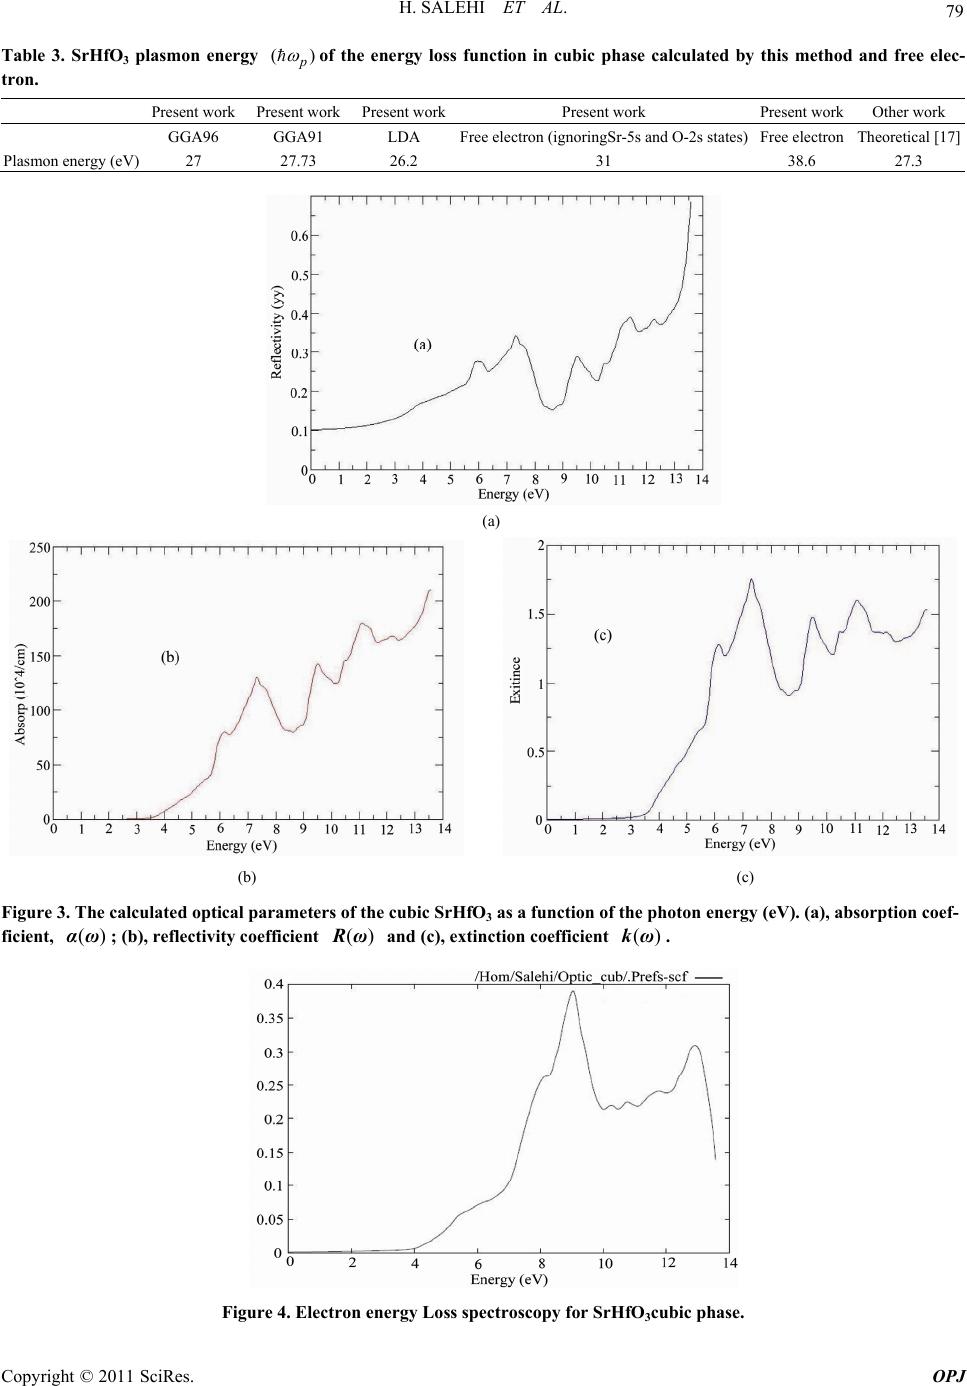 H. SALEHI ET AL. Copyright © 2011 SciRes. OPJ 79 Table 3. SrHfO3 plasmon energy () p of the energy loss function in cubic phase calculated by this method and free elec- tron. Present work Present work Present workPresent work Present work Other work GGA96 GGA91 LDA Free electron (ignoringSr-5s and O-2s states) Free electron Theoretical [17] Plasmon energy (eV) 27 27.73 26.2 31 38.6 27.3 (a) (b) (c) Figure 3. The calculated optical parameters of the cubic SrHfO3 as a function of the photon energy (eV). (a), absorption coef- ficient, ()αω ; (b), reflectivity coefficient ()Rω and (c), extinction coefficient ()kω. Figure 4. Electron energy Loss spectroscopy for SrHfO3cubic phase. 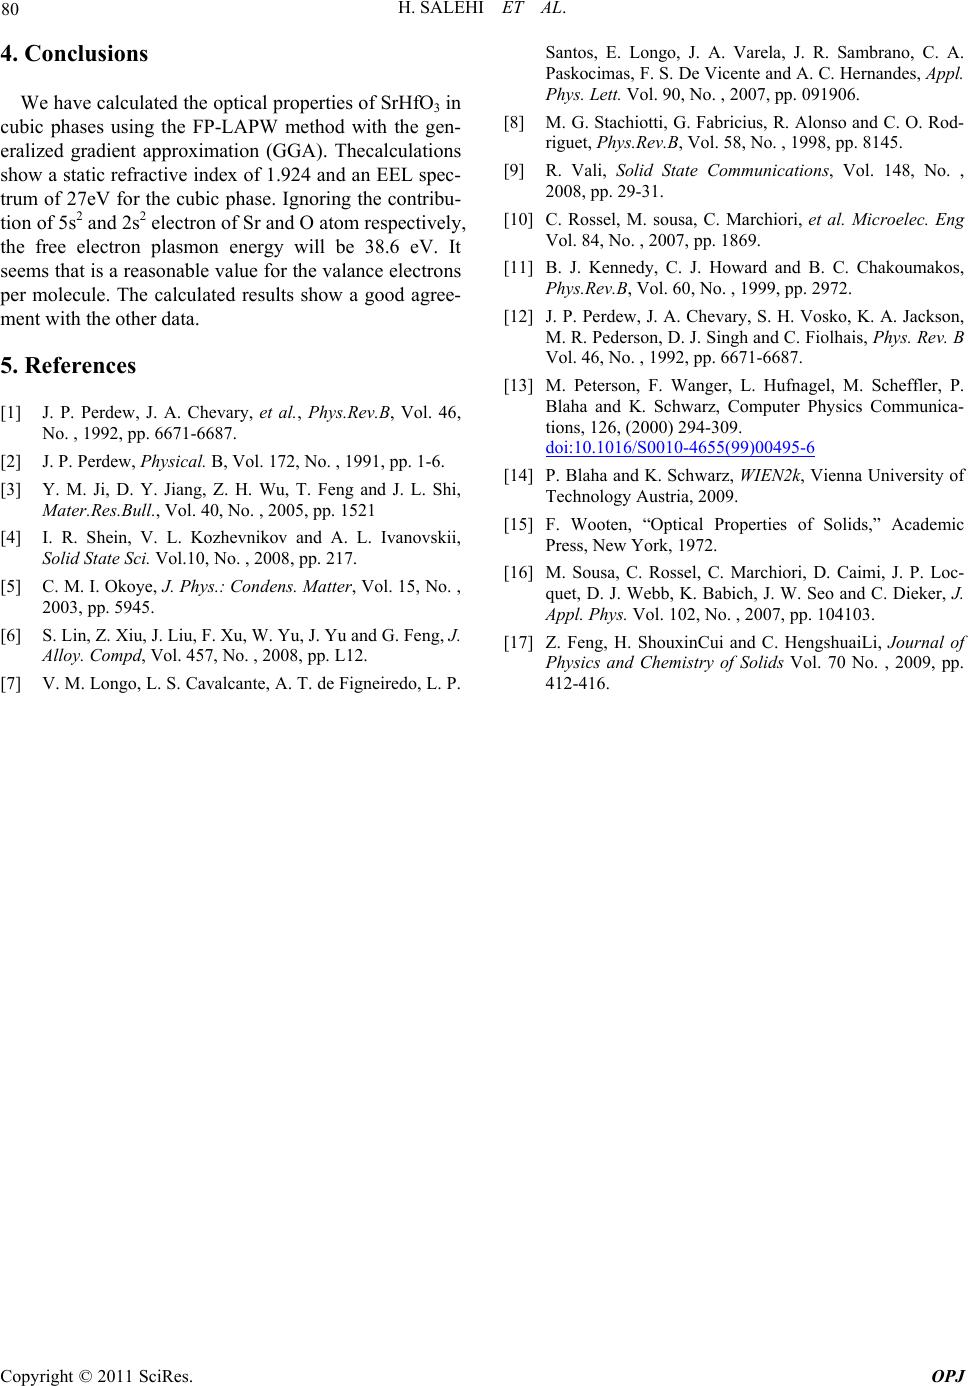 H. SALEHI ET AL. Copyright © 2011 SciRes. OPJ 80 4. Conclusions We have calculated the optical properties of SrHfO3 in cubic phases using the FP-LAPW method with the gen- eralized gradient approximation (GGA). Thecalculations show a static refractive index of 1.924 and an EEL spec- trum of 27eV for the cubic phase. Ignoring the contribu- tion of 5s2 and 2s2 electron of Sr and O atom respectively, the free electron plasmon energy will be 38.6 eV. It seems that is a reasonable value for the valance electrons per molecule. The calculated results show a good agree- ment with the other data. 5. References [1] J. P. Perdew, J. A. Chevary, et al., Phys.Rev.B, Vol. 46, No. , 1992, pp. 6671-6687. [2] J. P. Perdew, Physical. B, Vol. 172, No. , 1991, pp. 1-6. [3] Y. M. Ji, D. Y. Jiang, Z. H. Wu, T. Feng and J. L. Shi, Mater.Res.Bull., Vol. 40, No. , 2005, pp. 1521 [4] I. R. Shein, V. L. Kozhevnikov and A. L. Ivanovskii, Solid State Sci. Vol.10, No. , 2008, pp. 217. [5] C. M. I. Okoye, J. Phys.: Condens. Matter, Vol. 15, No. , 2003, pp. 5945. [6] S. Lin, Z. Xiu, J. Liu, F. Xu, W. Yu, J. Yu and G. Feng, J. Alloy. Compd, Vol. 457, No. , 2008, pp. L12. [7] V. M. Longo, L. S. Cavalcante, A. T. de Figneiredo, L. P. Santos, E. Longo, J. A. Varela, J. R. Sambrano, C. A. Paskocimas, F. S. De Vicente and A. C. Hernandes, Appl. Phys. Lett. Vol. 90, No. , 2007, pp. 091906. [8] M. G. Stachiotti, G. Fabricius, R. Alonso and C. O. Rod- riguet, Phys.Rev.B, Vol. 58, No. , 1998, pp. 8145. [9] R. Vali, Solid State Communications, Vol. 148, No. , 2008, pp. 29-31. [10] C. Rossel, M. sousa, C. Marchiori, et al. Microelec. Eng Vol. 84, No. , 2007, pp. 1869. [11] B. J. Kennedy, C. J. Howard and B. C. Chakoumakos, Phys.Rev.B, Vol. 60, No. , 1999, pp. 2972. [12] J. P. Perdew, J. A. Chevary, S. H. Vosko, K. A. Jackson, M. R. Pederson, D. J. Singh and C. Fiolhais, Phys. Rev. B Vol. 46, No. , 1992, pp. 6671-6687. [13] M. Peterson, F. Wanger, L. Hufnagel, M. Scheffler, P. Blaha and K. Schwarz, Computer Physics Communica- tions, 126, (2000) 294-309. doi:10.1016/S0010-4655(99)00495-6 [14] P. Blaha and K. Schwarz, WIEN2k, Vienna University of Technology Austria, 2009. [15] F. Wooten, “Optical Properties of Solids,” Academic Press, New York, 1972. [16] M. Sousa, C. Rossel, C. Marchiori, D. Caimi, J. P. Loc- quet, D. J. Webb, K. Babich, J. W. Seo and C. Dieker, J. Appl. Phys. Vol. 102, No. , 2007, pp. 104103. [17] Z. Feng, H. ShouxinCui and C. HengshuaiLi, Journal of Physics and Chemistry of Solids Vol. 70 No. , 2009, pp. 412-416. |