Open Journal of Social Sciences
Vol.03 No.03(2015), Article ID:54758,5 pages
10.4236/jss.2015.33007
Risk Assessment of Business Process Re-Engineering Projects
Boyd A. Nicholds, John P. T. Mo
School of Aerospace, Mechanical and Manufacturing Engineering, RMIT University, Bundoora, Victoria, Australia
Email: boyd.nicholds@rmit.edu.au, john.mo@rmit.edu.au


Received December 2014

ABSTRACT
Business Process Re-engineering (BPR) inevitably involves change. However, modern business organizations are extremely complex. Setting improvement targets in BPR too high without considering the company’s capability and its external and internal interactions will have little chance of achieving the set targets, which means project failure. Unfortunately, forecasting of the BPR outcomes is currently a wild guess to management. This paper describes a risk model that estimates a process improvement capability score and integrates with a performance effectiveness function to assess the likelihood of meeting performance gain targets from process improvement projects undertaken by companies. The risk assessment can assist management to set more realistic performance gain targets for process improvement projects with a better chance of success.
Keywords:
Business Process Re-Engineering, Risk Assessment, Process Improvement, Capability Score, Performance Effectiveness, Decision Support Tool

1. Introduction
Business process re-engineering (BPR) for new business processes or change of existing processes is not an ad-hoc activity. It requires a good project management approach to coordinate and decide on a range of factors in a structured manner [1]. However not all BPR projects are successful. Whittaker [2] conducted a large survey of companies and concluded that 45% of improvement projects did not deliver the expected benefits.
A successful BPR project depends on the capability of the company implementing it. A proper analysis of known success and failure capability factors can reduce the risk of failure and increase the likelihood of success. The structured process improvement framework proposed by Rohleder et al. [3] had the potential to simplify the change implementation process and avoid failures but their focus was on innovation which they acknowledged to have a high failure rate.
This paper outlines a risk assessment method to assist organisations re-engineering their business processes in order to achieve the expected performance gains. The innovation of this method is the ability to estimate the probability of meeting a desired target performance level at various points in time. This knowledge is most critical to decision makers to a) compare different BPR projects and execute the project with the highest probability of success over time, and b) form the basis for adjusting the scope and performance targets of BPR projects to achieve a realistic chance of success.
2. Literature Review
Performance measures are characterized through metrics. Consolidated sets of performance indicators are used by company management to ensure attainment of their objectives and goals linked to strategy and value creation for the company. Prandini et al. [4] specified the complexity metrics that were relevant in the operations of future air traffic management system. Marin-Garcia and Poveda [5] reviewed the success of a medium sized company implementing change suggestions from the employees. The subjective approach evaluating employee suggestions had a competition effect among multi-disciplinary teams in the company. Bourne [6] described three phases of performance measurement system implementation and pointed out that senior management commitment was crucial to the success of the project. Bourne et al. [7] investigated the performance measurement system design of ten companies. The study revealed two main drivers for success which were closely related to the perceived benefits of top management.
The problem of setting performance measures has been studied extensively in the manufacturing sector. Ahmed et al. [8] observed that additional tangible and intangible measures were required to generate sufficient information representing different aspects of performance evaluation. Lillis [9] studied the effectiveness of profit centre strategy where performance dimensions relating to manufacturing efficiency and customer responsiveness was found problematic. Gomes et al. [10] determined predictive value as a primary factor in the choice and level of usage of performance measures by managers with ease of data acquisition being subordinate in importance.
In a comparison of eight performance measurement systems (PMS), Garengo et al. [11] found a trend over time that small and medium enterprises changed from focus on strategy alignment alone to a focus on stakeholder satisfaction together with strategy alignment. Performance indicators used to measure process improvement should be linked to the performance measures otherwise the importance and relevance of the measured outcome of the project could be questioned at the outset [12]. There is a lack of research to link performance metrics to capability level of the organization working on BPR projects.
3. Setting Realistic Performance Gain Targets
A thorough risk assessment provides benefit to decision makers coordinating changes in BPR to minimise potential failure and reduce effect of undesirable events. In Figure 1, the expected performance gain Pexp is aimed to be achieved at time tj from the start point t0 and performance P0. Without prior knowledge of the risk level, the decision maker anticipates that curve 1 applies; that is a gain from P0 to Pexp is obtained and maintained in the longer-term. However, there may be circumstances pushing the project to scenarios 2 to 6, each having
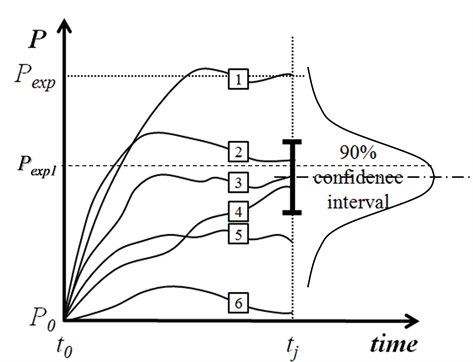
Figure 1.Possible development trajectory of a project.
different probabilities. It is clear the probability of achieving the initially expected gain Pexp is somewhat over optimistic with a probability of success less than five percent. Instead, if the expected performance is adjusted to Pexp1, the chance of achieving the expected performance is close to half.
Lowering expectation levels is a decision that can be made conservatively and provides the short-term benefit of improving the momentum of improvement. Alternatively on being made aware the probability of success is lower than expected a decision can be made to expand existing capability to cover the gap.
4. The Capability Score
4.1. Conceptual Framework
In order to ensure success of operations improvement implementation, the capability of an organisation should be at a level that can handle the complexity of the improvements being attempted and the performance targets being aimed for. In this research, the capability level of an organisation working on a BPR project is evaluated as the capability score SC. This measure is calculated as a function of a set of capability indicators X =
 (1)
(1)
These performance indicators are selected such that they have a causal link to operations performance and continuous improvement. A nine level rating system is used to normalise the extent of capability for each capability factor to a comparable basis.
4.2. Capability Levels
To effectively obtain the capability score of an organisation, it is necessary to break down and categorise the individual capability factors so that more accurate assessment of each of the capability factors can be made. This requires an enterprise architecture to form the modelling framework. Mo [13] developed an architecture known as 3PE has been postulated based on the key elements 1) people, 2) process, and 3) product and their interfaces, viz, 4) people vs process, 5) product vs people and 6) process vs product. This internal architecture is changed by external influences, i.e. environment. Using the 3PE enterprise architecture, SC can be computed as a function of six capability indicators as shown in Figure 2.
5. Performance
Performance gains are anticipated from a BPR project. These performance gains are measured by a range of individual performance indicators P =
 (2)
(2)
The performance of a BPR project can vary between two extremes:
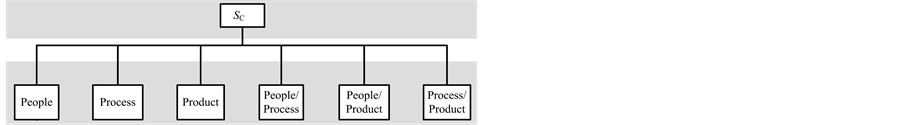
Figure 2. The 3PE high level architecture.
§ A theoretical performance level Pth that can be attained if all capability elements are applied in a perfect manner.
§ The capability elements are not effective and no improvement of productivity has been recorded. This performance level is represented as P0. If the project is not implemented, Pcur = P0.
However, the problem of finding the intermediate relationships between kP and P is mixed with human judgement. One method is to solicit the opinion of the stakeholders involved in the operations improvement project. The Analytic Hierarchy Process (AHP) is applied to consolidate the vector of priority (VP) over the range of P0 to Pth. To assist in making consistent decisions, Equations (3), (4) and (5) are applied in the judgment matrix. For any j = 1 to th (i.e. th = 5 in this illustration and * is the wild card for the row or column elements),
 (3)
(3)
 (4)
(4)
 (5)
(5)
A pairwise comparison judgement process on θkj with a scale of 1 to 9 generates intermediate values of VPj. The performance effectiveness factor kP is obtained over the range 0 to 1 by Equation (6).
 (6)
(6)
Intuitively it is reasonable to expect that having a higher level of capability, the organisation can achieve greater levels of BPR performance gain closer to the theoretical maximum. These curves are obtained by estimating the difficulty levels kP in past improvement projects against the increase in performance P on a particular SC. The derivation of this function is based on published data [14] [15].
Putting It Altogether
The goal of this research is to predict future performance gain of an operations improvement project based on an estimate of capability for that project. Assuming an estimated SC of 70 for the project (Figure 3), and by combining the kP/SC and kP/P curves a prediction is made. From Figure 3, with 90% confidence, the performance level at a future time will be in the range [2.5, 3.7], with an average performance level of 3.2. If the target performance is set at 3.7, it is then up to the decision maker to decide whether a risk of 10% failure is acceptable for the PBR project.
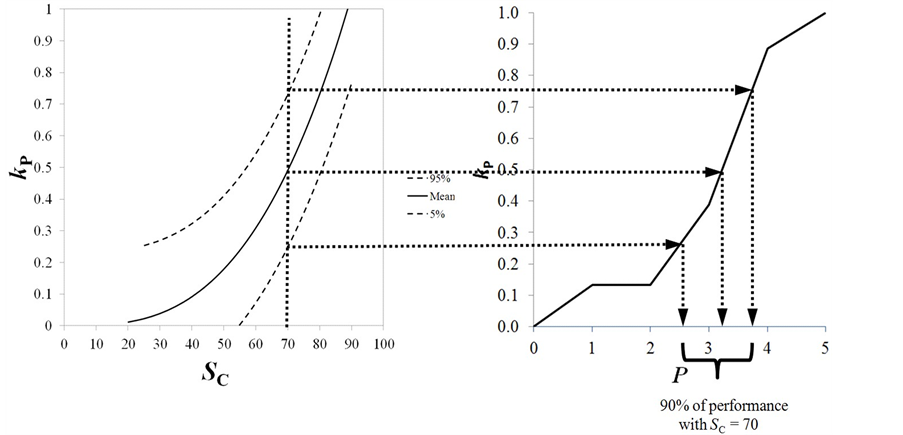
Figure 3. Determining the range of performance achievement by the capability score.
6. Conclusions
A risk assessment model has been proposed to assess the likelihood of meeting performance gain targets from BPR projects undertaken by companies. The method indicates to companies when and where their capabilities need to be adjusted to maximize their possible outcomes. This alleviates the problem that organizations have when they embark on BPR initiatives with an organizational setup that limits their chance of success.
An advantage for companies using the SC model is their improvement ambition level can be set more realistically based on knowledge of their estimated capability. The adjusted performance targets are better matched to organizational capability which in turn means a higher hit-rate of successful BPR projects. More success tends to provide positive feedback setting the seeds for sustained continuous improvement. Setting the bar too high too early can demotivate a BPR programme and kill it before it even gets going.
Cite this paper
Boyd A. Nicholds,John P. T. Mo, (2015) Risk Assessment of Business Process Re-Engineering Projects. Open Journal of Social Sciences,03,30-34. doi: 10.4236/jss.2015.33007
References
- 1. Pestana, G., Rebelo, I., Duarte, N. and Couronné, S. (2012) Addressing Stakeholders Coordination for Airport Efficiency and Decision-Support Requirements. Journal of Aerospace Operations, 1, 267-280.
- 2. Whittaker, B. (1999) What Went Wrong? Unsuccessful Information Technology Projects. Information Management & Computer Security, 7, 23-29. http://dx.doi.org/10.1108/09685229910255160
- 3. Rohleder, T.R. and Silver, E.A. (1997) A Tutorial on Business Process Improvement. Journal of Operations Management, 15, 139-154. http://dx.doi.org/10.1016/S0272-6963(96)00100-3
- 4. Prandini, M., Putta, V. and Hu, J. (2012) Air Traffic Complexity in Future Air Traffic Management Systems. Journal of Aerospace Operations, 1, 281-299.
- 5. Marin-Garcia, J.A. and Poveda, Y.B. (2010) The Implementation of a Continuous Improvement Project at a Spanish Marketing Company: A Case Study. International Journal of Management, 27, 593-606, 777.
- 6. Bourne, M. (2005) Researching Performance Measurement System Implementation: The Dynamics of Success and Failure. Production Planning & Control, 16, 101-113. http://dx.doi.org/10.1080/09537280512331333011
- 7. Bourne, M., Neely, A., Platts, K., et al. (2002) The Success and Failure of Performance Measurement Initiatives: Perceptions of Participating Managers. International Journal of Operations and Production Management, 22, 1288-1310. http://dx.doi.org/10.1108/01443570210450329
- 8. Ahmed, S., Hassan, M.H. and Fen, Y.H. (2005) Performance Measurement and Evaluation in an Innovative Modern Manufacturing System. Journal of Applied Sciences, 5, 385-401. http://dx.doi.org/10.3923/jas.2005.385.401
- 9. Lillis, A.M. (2002) Managing Multiple Dimensions of Manufacturing Performance—An Exploratory Study. Accounting, Organizations and Society, 27, 497-529. http://dx.doi.org/10.1016/S0361-3682(01)00032-0
- 10. Gomes, C.F., Yasin, M.M. and Lisboa, J.V. (2011) Perfor-mance Measurement Practices in Manufacturing Firms Revisited. International Journal of Operations & Production Management, 31, 5-30. http://dx.doi.org/10.1108/01443571111098726
- 11. Garengo, P., Biazzo, S. and Bititci, U.S. (2005) Performance Measurement Systems in SMEs: A Review for a Research Agenda. International Journal of Management Reviews, 7, 25-47. http://dx.doi.org/10.1111/j.1468-2370.2005.00105.x
- 12. Ghalayini, A.M., Noble, J.S. and Crowe, T.J. (1997) An Integrated Dynamic Performance Measurement System for Improving Manufacturing Competitiveness. International Journal of Production Economics, 48, 207-225. http://dx.doi.org/10.1016/S0925-5273(96)00093-X
- 13. Mo, J.P.T. (2012) Performance Assessment of Product Service System from System Architecture Perspectives. Advances in Decision Sciences, 2012, 19.
- 14. Done, A., Voss, C. and Rytter, N.G. (2011) Best Practice Interventions: Short-Term Impact and Long-Term Outcomes. Journal of Operations Management, 29, 500-513. http://dx.doi.org/10.1016/j.jom.2010.11.007
- 15. Bateman, N. and David, A. (2002) Process Improvement Programmes: A Model for Assessing Sustainability. International Journal of Operations & Production Management, 22, 515-526. http://dx.doi.org/10.1108/01443570210425156