 iBusiness, 2011, 3, 147-158 doi:10.4236/ib.2011.32021 Published Online June 2011 (http://www.scirp.org/journal/ib) Copyright © 2011 SciRes. iB The Comparison of Three Major Occupations for User Acceptance of Information Technology: Applying the UTAUT Model Yu-Shan Cheng*, Tsai-Fang Yu, Chin-Feng Huang, Chien Yu, Chin-Cheh Yu Department of Applied Technology and Human Resource Development, National Taiwan Normal University, Taipei, China. Email: high2468@gmail.com Receive January 22nd, 2011; revised April 3rd, 2011; accepted April 13th, 2011 ABSTRACT This study investigated whether the differences of gender, age, and occupation for m-learning showed significance on the utilization of the mobile devices and to figure out if the variation may influence the performance expectancy, effort expectancy and the social influence to the behavioral intention or even to the behavior of usage. When the employees’ behavioral intention was low, the director of managers or HR department can suggest the employees’ colleagues, supe- rior manager or friends to communicate with them to enhance their behavioral intention and to use it. And it suggested that male employees and elder employees should be put more emphasis on the communication to enhance their behav- ioral intention. UTAUT model with different kinds of businesses for m-learning but the conclusion did not investigate the differences of the adoption of the mobile devices in each industry. Basing on this, this study attempted to investigate whether the difference occupations showed significance on the utilization of the mobile devices. Keywords: Unified Theory of Acceptance and Use of Technology (UTAUT), Manufacturing, Service, Bank 1. Introduction Because m-learning (mobile learning) industry played the role as the index of the development of knowledge economy and digital economy and that it was also a high value added industry which was the important base of improving total competitive strength of the occupations in a country, countries around the world have investi- gated a lot of resources to promote the m-learning indus- try. Therefore, m-learning industry has not been an in- dustry issue in any country, but also the key to whether the companies of the same business can have the advan- tage across nations under the frame of knowledge econ- omy. The adoption of information and communication tech- nology (ICT) can improve the learning when giving a learner-centered lecture [1]. Therefore, triggered by the marketing competition, service improvement and work- ing performance, an organization would investigate a lot of the information technology and apply it to the educa- tion of the employees to deduce the training cost and increase the learning will of the employees to improve their performance, widen the training domain and short- en the learning curve. etc. [2,3]. In 2007, the ratios among the occupations of manu- facture, banking and service in buying or making e-learn- ing platform was 12.4%, 37.1%, 14.3% respectively, while the ratios went up to 16.7%, 54.3% and 25.7% in 2008 which showed a fair development [4]. In order to figure out current situation of the three major occupa- tions in Taiwan with m-learning when giving employees training, the study adopted the UTAUT model which was proposed by as in [5] to investigate the issue. They used eight models to study the problems and found out that the expected validity would have significant improved after adding adjustment variables to six of the eight models. Reference [5] adopted four different kinds of corporations to test the model, namely the product de- velopment department of the entertainment business, the marketing department of the information service busi- ness, the business account management of the banking business and the account department of the pub- lic-operated business. Understanding that as in [5] estab- lished UTAUT model with different kinds of businesses but the conclusion did not investigate the differences of the adoption of the mobile devices in each industry. De- spite that as in [6] investigated the demonstration and 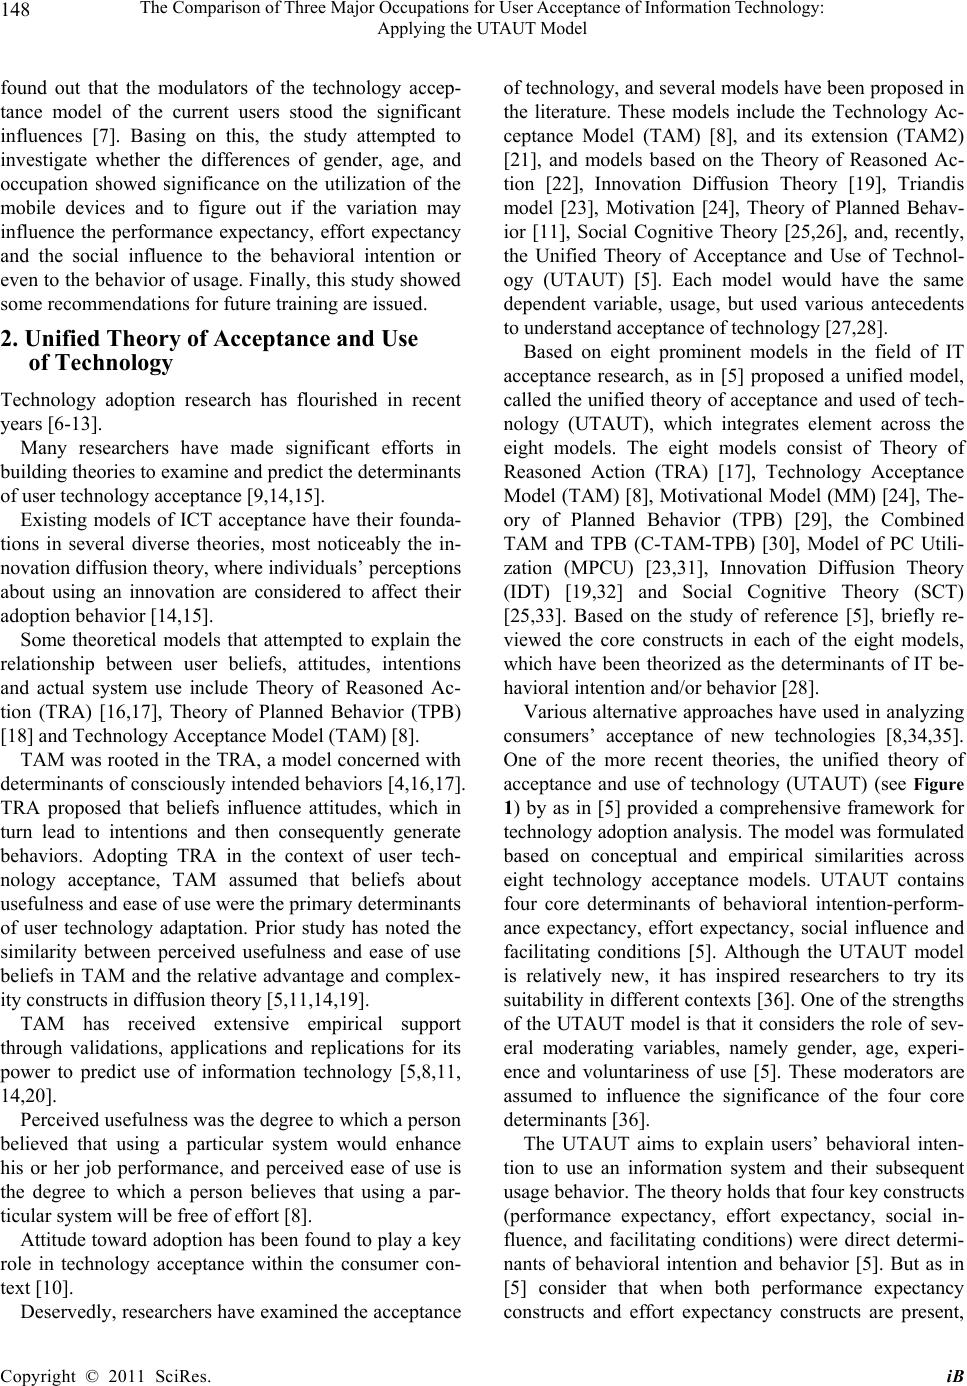 The Comparison of Three Major Occupations for User Acceptance of Information Technology: Applying the UTAUT Model 148 found out that the modulators of the technology accep- tance model of the current users stood the significant influences [7]. Basing on this, the study attempted to investigate whether the differences of gender, age, and occupation showed significance on the utilization of the mobile devices and to figure out if the variation may influence the performance expectancy, effort expectancy and the social influence to the behavioral intention or even to the behavior of usage. Finally, this study showed some recommendations for future training are issued. 2. Unified Theory of Acceptance and Use of Technology Technology adoption research has flourished in recent years [6-13]. Many researchers have made significant efforts in building theories to examine and predict the determinants of user technology acceptance [9,14,15]. Existing models of ICT acceptance have their founda- tions in several diverse theories, most noticeably the in- novation diffusion theory, where individuals’ perceptions about using an innovation are considered to affect their adoption behavior [14,15]. Some theoretical models that attempted to explain the relationship between user beliefs, attitudes, intentions and actual system use include Theory of Reasoned Ac- tion (TRA) [16,17], Theory of Planned Behavior (TPB) [18] and Technology Acceptance Model (TAM) [8]. TAM was rooted in the TRA, a model concerned with determinants of consciously intended behaviors [4,16,17]. TRA proposed that beliefs influence attitudes, which in turn lead to intentions and then consequently generate behaviors. Adopting TRA in the context of user tech- nology acceptance, TAM assumed that beliefs about usefulness and ease of use were the primary determinants of user technology adaptation. Prior study has noted the similarity between perceived usefulness and ease of use beliefs in TAM and the relative advantage and complex- ity constructs in diffusion theory [5,11,14,19]. TAM has received extensive empirical support through validations, applications and replications for its power to predict use of information technology [5,8,11, 14,20]. Perceived usefulness was the degree to which a person believed that using a particular system would enhance his or her job performance, and perceived ease of use is the degree to which a person believes that using a par- ticular system will be free of effort [8]. Attitude toward adoption has been found to play a key role in technology acceptance within the consumer con- text [10]. Deservedly, researchers have examined the acceptance of technology, and several models have been proposed in the literature. These models include the Technology Ac- ceptance Model (TAM) [8], and its extension (TAM2) [21], and models based on the Theory of Reasoned Ac- tion [22], Innovation Diffusion Theory [19], Triandis model [23], Motivation [24], Theory of Planned Behav- ior [11], Social Cognitive Theory [25,26], and, recently, the Unified Theory of Acceptance and Use of Technol- ogy (UTAUT) [5]. Each model would have the same dependent variable, usage, but used various antecedents to understand acceptance of technology [27,28]. Based on eight prominent models in the field of IT acceptance research, as in [5] proposed a unified model, called the unified theory of acceptance and used of tech- nology (UTAUT), which integrates element across the eight models. The eight models consist of Theory of Reasoned Action (TRA) [17], Technology Acceptance Model (TAM) [8], Motivational Model (MM) [24], The- ory of Planned Behavior (TPB) [29], the Combined TAM and TPB (C-TAM-TPB) [30], Model of PC Utili- zation (MPCU) [23,31], Innovation Diffusion Theory (IDT) [19,32] and Social Cognitive Theory (SCT) [25,33]. Based on the study of reference [5], briefly re- viewed the core constructs in each of the eight models, which have been theorized as the determinants of IT be- havioral intention and/or behavior [28]. Various alternative approaches have used in analyzing consumers’ acceptance of new technologies [8,34,35]. One of the more recent theories, the unified theory of acceptance and use of technology (UTAUT) (see Figure 1) by as in [5] provided a comprehensive framework for technology adoption analysis. The model was formulated based on conceptual and empirical similarities across eight technology acceptance models. UTAUT contains four core determinants of behavioral intention-perform- ance expectancy, effort expectancy, social influence and facilitating conditions [5]. Although the UTAUT model is relatively new, it has inspired researchers to try its suitability in different contexts [36]. One of the strengths of the UTAUT model is that it considers the role of sev- eral moderating variables, namely gender, age, experi- ence and voluntariness of use [5]. These moderators are assumed to influence the significance of the four core determinants [36]. The UTAUT aims to explain users’ behavioral inten- tion to use an information system and their subsequent usage behavior. The theory holds that four key constructs (performance expectancy, effort expectancy, social in- fluence, and facilitating conditions) were direct determi- nants of behavioral intention and behavior [5]. But as in [5] consider that when both performance expectancy constructs and effort expectancy constructs are present, C opyright © 2011 SciRes. iB 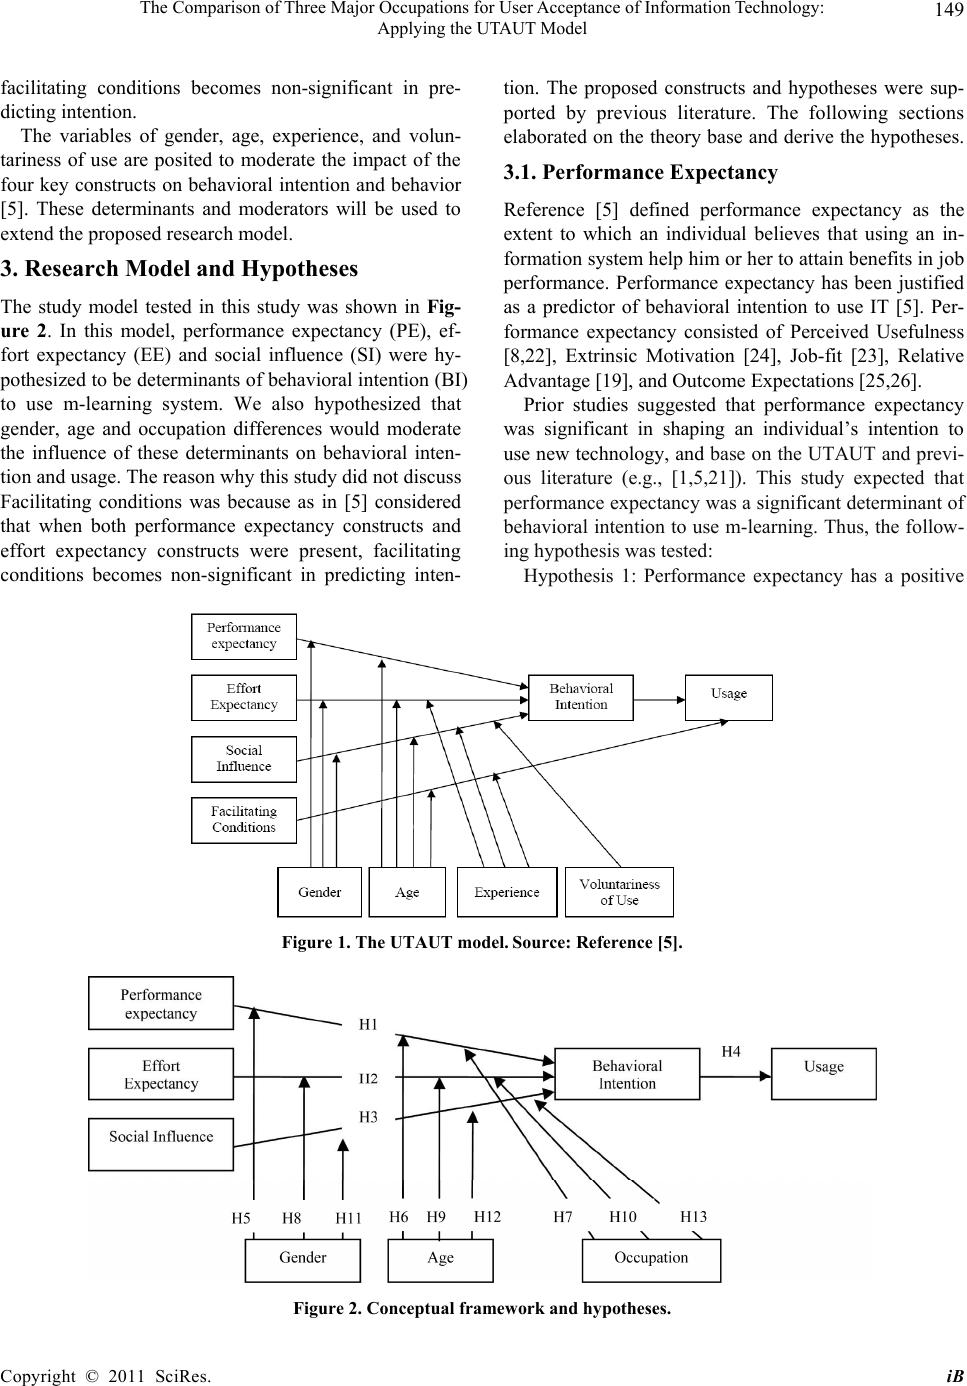 The Comparison of Three Major Occupations for User Acceptance of Information Technology: Applying the UTAUT Model Copyright © 2011 SciRes. iB 149 facilitating conditions becomes non-significant in pre- dicting intention. The variables of gender, age, experience, and volun- tariness of use are posited to moderate the impact of the four key constructs on behavioral intention and behavior [5]. These determinants and moderators will be used to extend the proposed research model. 3. Research Model and Hypotheses The study model tested in this study was shown in Fig- ure 2. In this model, performance expectancy (PE), ef- fort expectancy (EE) and social influence (SI) were hy- pothesized to be determinants of behavioral intention (BI) to use m-learning system. We also hypothesized that gender, age and occupation differences would moderate the influence of these determinants on behavioral inten- tion and usage. The reason why this study did not discuss Facilitating conditions was because as in [5] considered that when both performance expectancy constructs and effort expectancy constructs were present, facilitating conditions becomes non-significant in predicting inten- tion. The proposed constructs and hypotheses were sup- ported by previous literature. The following sections elaborated on the theory base and derive the hypotheses. 3.1. Performance Expectancy Reference [5] defined performance expectancy as the extent to which an individual believes that using an in- formation system help him or her to attain benefits in job performance. Performance expectancy has been justified as a predictor of behavioral intention to use IT [5]. Per- formance expectancy consisted of Perceived Usefulness [8,22], Extrinsic Motivation [24], Job-fit [23], Relative Advantage [19], and Outcome Expectations [25,26]. Prior studies suggested that performance expectancy was significant in shaping an individual’s intention to use new technology, and base on the UTAUT and previ- ous literature (e.g., [1,5,21]). This study expected that performance expectancy was a significant determinant of behavioral intention to use m-learning. Thus, the follow- ing hypothesis was tested: Hypothesis 1: Performance expectancy has a positive Figure 1. The UTAUT model. Source: Reference [5]. Figure 2. Conceptual framework and hypotheses. 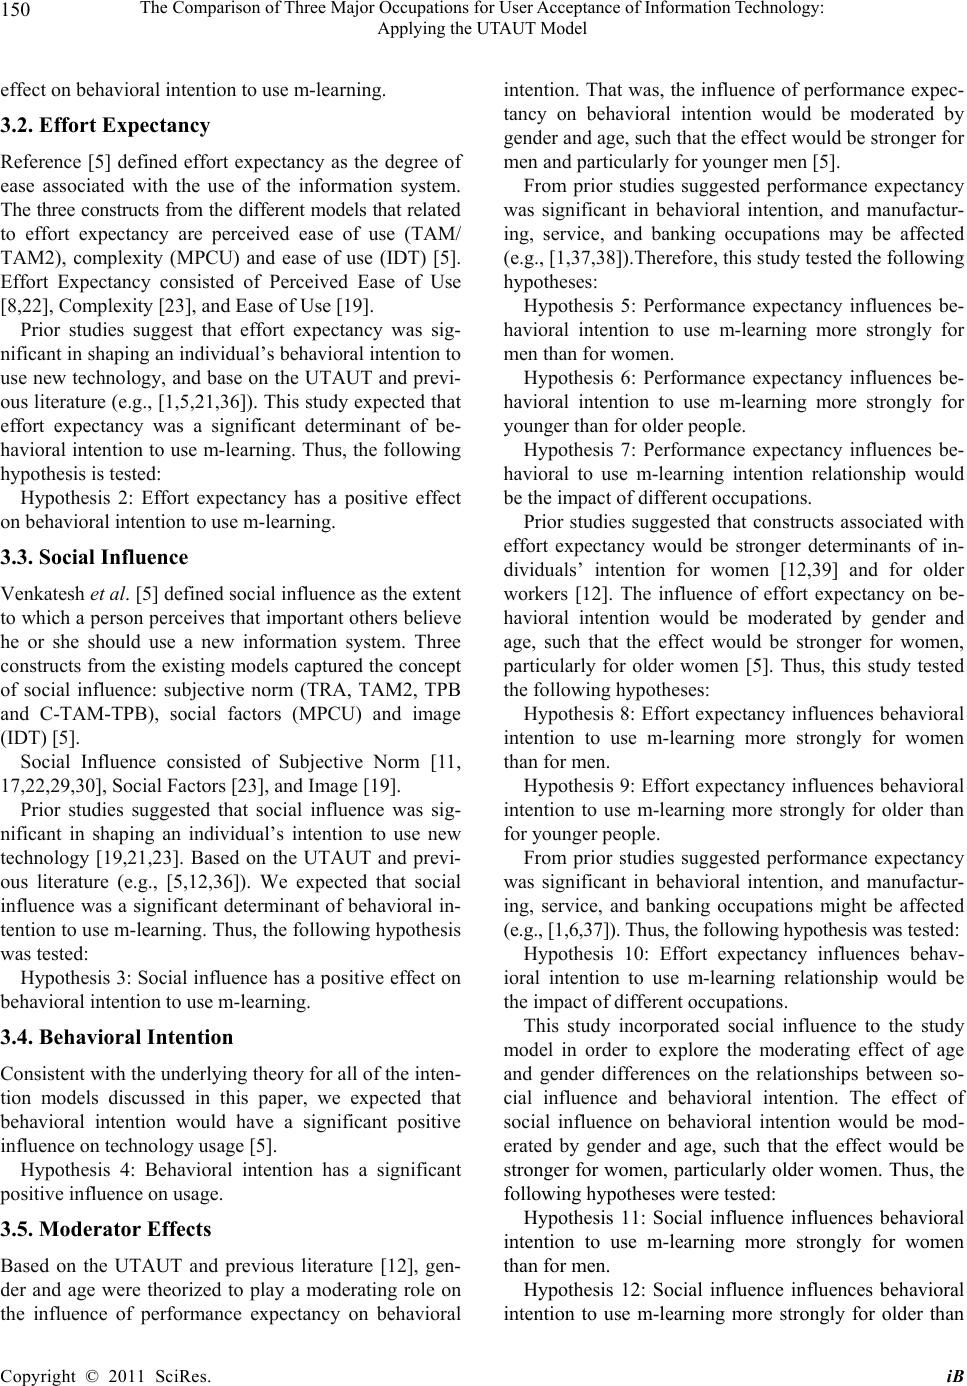 The Comparison of Three Major Occupations for User Acceptance of Information Technology: Applying the UTAUT Model 150 effect on behavioral intention to use m-learning. 3.2. Effort Expectancy Reference [5] defined effort expectancy as the degree of ease associated with the use of the information system. The three constructs from the different models that related to effort expectancy are perceived ease of use (TAM/ TAM2), complexity (MPCU) and ease of use (IDT) [5]. Effort Expectancy consisted of Perceived Ease of Use [8,22], Complexity [23], and Ease of Use [19]. Prior studies suggest that effort expectancy was sig- nificant in shaping an individual’s behavioral intention to use new technology, and base on the UTAUT and previ- ous literature (e.g., [1,5,21,36]). This study expected that effort expectancy was a significant determinant of be- havioral intention to use m-learning. Thus, the following hypothesis is tested: Hypothesis 2: Effort expectancy has a positive effect on behavioral intention to use m-learning. 3.3. Social Influence Venkatesh et al. [5] defined social influence as the extent to which a person perceives that important others believe he or she should use a new information system. Three constructs from the existing models captured the concept of social influence: subjective norm (TRA, TAM2, TPB and C-TAM-TPB), social factors (MPCU) and image (IDT) [5]. Social Influence consisted of Subjective Norm [11, 17,22,29,30], Social Factors [23], and Image [19]. Prior studies suggested that social influence was sig- nificant in shaping an individual’s intention to use new technology [19,21,23]. Based on the UTAUT and previ- ous literature (e.g., [5,12,36]). We expected that social influence was a significant determinant of behavioral in- tention to use m-learning. Thus, the following hypothesis was tested: Hypothesis 3: Social influence has a positive effect on behavioral intention to use m-learning. 3.4. Behavioral Intention Consistent with the underlying theory for all of the inten- tion models discussed in this paper, we expected that behavioral intention would have a significant positive influence on technology usage [5]. Hypothesis 4: Behavioral intention has a significant positive influence on usage. 3.5. Moderator Effects Based on the UTAUT and previous literature [12], gen- der and age were theorized to play a moderating role on the influence of performance expectancy on behavioral intention. That was, the influence of performance expec- tancy on behavioral intention would be moderated by gender and age, such that the effect would be stronger for men and particularly for younger men [5]. From prior studies suggested performance expectancy was significant in behavioral intention, and manufactur- ing, service, and banking occupations may be affected (e.g., [1,37,38]).Therefore, this study tested the following hypotheses: Hypothesis 5: Performance expectancy influences be- havioral intention to use m-learning more strongly for men than for women. Hypothesis 6: Performance expectancy influences be- havioral intention to use m-learning more strongly for younger than for older people. Hypothesis 7: Performance expectancy influences be- havioral to use m-learning intention relationship would be the impact of different occupations. Prior studies suggested that constructs associated with effort expectancy would be stronger determinants of in- dividuals’ intention for women [12,39] and for older workers [12]. The influence of effort expectancy on be- havioral intention would be moderated by gender and age, such that the effect would be stronger for women, particularly for older women [5]. Thus, this study tested the following hypotheses: Hypothesis 8: Effort expectancy influences behavioral intention to use m-learning more strongly for women than for men. Hypothesis 9: Effort expectancy influences behavioral intention to use m-learning more strongly for older than for younger people. From prior studies suggested performance expectancy was significant in behavioral intention, and manufactur- ing, service, and banking occupations might be affected (e.g., [1,6,37]). Thus, the following hypothesis was tested: Hypothesis 10: Effort expectancy influences behav- ioral intention to use m-learning relationship would be the impact of different occupations. This study incorporated social influence to the study model in order to explore the moderating effect of age and gender differences on the relationships between so- cial influence and behavioral intention. The effect of social influence on behavioral intention would be mod- erated by gender and age, such that the effect would be stronger for women, particularly older women. Thus, the following hypotheses were tested: Hypothesis 11: Social influence influences behavioral intention to use m-learning more strongly for women than for men. Hypothesis 12: Social influence influences behavioral intention to use m-learning more strongly for older than C opyright © 2011 SciRes. iB  The Comparison of Three Major Occupations for User Acceptance of Information Technology: Applying the UTAUT Model 151 for younger people. From prior studies suggested performance expectancy was significant in behavioral intention, and manufactur- ing, service, and banking occupations might be affected (e.g., [1,37,38]). Thus, the following hypothesis was tested: Hypothesis 13: Social influence influences behavioral intention to use m-learning relationship would be the impact of different occupations. 3.6. Measures This study adopted SPSS18.0 and LISREL 8.53 statistics software to study the hypothesis test and data analysis. The statistic method adopted in this study includes de- scriptive statistical analysis, common method variance, reliability analysis, confirmatory factors analysis, and correlation analysis. Then, this study adopted a structural equation model to analyze the relation among the vari- ables in the model and interpret the study model and hy- pothesizes. 4. Methodology 4.1 Data Collection and Sample Characteristics Taiwan Common Wealth Magazine would make lists for manufacture business, service business and banking business with the standards of revenue, total assets, af- ter-tax net profit, stock holders’ equity, capital, profit- ability, return on assets, return on equity, debt ratio, the number of employees, and employee output. Basing on the standards, the magazine listed the top 1000 compa- nies of manufacture business, top 500 companies of the service business and top 100 companies in banking busi- ness. The research objects in the study were the top 1600 enterprises in Taiwan. The questionnaires were delivered with the method of general survey. The collected data from 2009, October 1st to November 31st were used for cross-sectional study. There were 350 questionnaires collected with the recovery rate of 21.875%. After re- moving the invalid questionnaires with obvious contra- diction, there were 264 valid questionnaires collected with the recovery rate of 16.5%. Among the valid ques- tionnaires, 143 belong to manufacture business, 89 be- long to service business and 32 belong to banking busi- ness. The repliers of the research were the managers of the department of internal training which includes manage- ment department, human resources department and in- formation sections. In the 264 valid questionnaires, fe- male repliers took the majority (N = 165; 62.5%). Most of the informants fall between 31 to 35 years old (N = 74; 28.1%), then 26 to 30 years old (N = 63; 23.9%). 4.2 Common Method Variance When giving test at the same time point with the self report inventory and a single source informant, the prob- lem of common method variance (CMV) was easily ob- served when the questions were similar with each other and the semantics was positive [40]. This study took the Harman’s one-factor test which was the most used test for common method variance to testy the severity of the common method variance problem: 1) Each question is evaluated with exploratory factor analysis to test the re- sults of all non-shift factor analysis. If there are more than two factors in the analysis or less than 50% of the explained variance, then the effected level of the com- mon method variance is not critical; 2) Then, all ques- tions are put together to go through the single-factor con- firmatory factor analysis. If the result shows that not all the questions have more than 0.50 of the burden level or poor verify model, then the effected level of the common method variance is not critical. This study extracted three factors with the questions analyzed with exploratory factor analysis. The result showed that the sample data of the research did not have the problem of severe common method variance. The single-factor confirmatory factor analysis also indicated that it was not the case that all questions were beyond the burden level of 50. In the model test result, the value of χ2 was 1196.53, with the freedom level set as 77 and the significance test ratio probability value p-value as .000 which is significant. Besides, other fit index value showed: GFI = 0.61, AGFI = 0.46, NFI = 0.81, NNFI = 0.78, CFI = 0.82, that was more than .90 below the fit standard while the RMSEA is 0.235 which is more than 0.05. All of these values showed that the single-factor confirmatory factor analysis has indicated poor fit on the model. 4.3 Validity and Reliability Before performing structural model analysis, must deal with the issues of validity and reliability. This study also adopted Cronbach’s α and confirmatory factor analysis to test the reliability and validity of the questionnaire. When studying basic issues, it would be better for the reliability to be more than 0.70 [41]. The result of the analysis showed that Cronbach’s α value of performance expectancy was 0.870, Cronbach’s α value of effort ex- pectancy was 0.937, and Cronbach’s α value of social influence was 0.899, which indicated that the question- naire would have quite fine reliability. Since behavioral intention and the actual usage were both single observed variable, the reliability was not included. C opyright © 2011 SciRes. iB  The Comparison of Three Major Occupations for User Acceptance of Information Technology: Applying the UTAUT Model 152 In the confirmatory factor analysis, most potential di- mensions took composite reliability value (CR) as the standard. The composite reliability was used to test the internal agreement (similar with Cronbach’s α) of the questions in a questionnaire. High reliability value means high agreement. Then, on the aspect of composite reli- ability test, Fornell and Larcker [42] suggested the CR value to be higher than 0.60. The CR value of the per- formance expectancy was 0.8834, effort expectancy was 0.9375 and social influence was 0.8913. From the above mentioned, it showed that the composite reliability were all higher than 0.60 and so the three measuring methods should have a fine reliability [42]. Convergent validity was used to test multiple ques- tions derived from a single variable to see if the result will converge to a single factor. In the confirmatory fac- tor analysis, converge validity of the dimension took the average variance extracted (AVE) as a base. AVE was mainly used to calculate the explanatory power of all observed variable (measuring questions) of the dimen- sion to the average variations. The higher AVE was the higher reliability and converge validity of the dimension was. What comes next was to test the average amount of variance extracted. Reference [43] suggested that AVE should be higher than 0.50. When a measure method would have good reliability and validity, it would have better internal structure fit. AVE value of performance expectancy was 0.6605, effort expectancy was 0.7904, and social influence was 0.6806 (Table 1). On the aspect of discriminate validity, if a measuring model should have discriminate validity, the correlation level across the potential dimensions should be less than Table 1. Validity and reliability. Observation Variable Standarized factor loadings Squared Multiple Correlations Composite Reliability AVE PE1 0.84 0.71 PE2 0.92 0.84 PE3 0.87 0.75 Performance expectancy (PE) PE4 0.58 0.34 0.8834 0.6605 EE1 0.80 0.63 EE2 0.85 0.73 EE3 0.95 0.89 Effort expectancy (EE) EE4 0.95 0.91 0.9375 0.7904 SI1 0.97 0.94 SI2 0.97 0.94 SI3 0.66 0.43 Social influence (SI) SI4 0.64 0.41 0.8913 0.6806 the correlation level inside the potential dimensions. Therefore, it used the correlation matrix across the di- mensions to do the test. The square root of AVE of the potential variables should be greater than the correlation coefficients of other dimensions [44]. The square root of AVE of each dimension was calculated below: AVE value of performance expectancy was 0.6000; The square root of AVE was 0.813. AVE value of effort ex- pectancy was 0.7904; The square root of AVE was 0.889. AVE value of social influence was 0.6806; The square root of AVE was 0.825 (Ta ble 2). The square root values of AVE were all higher than the relevant value in the rows and the columns. This in- dicated that the performance expectancy, effort expec- tancy and social influence have discriminate validity. 4.4 Descriptive Statistics and Inter-Correlations among Research Variable The dimension mean scores of the performance expec- tancy, effort expectancy and the social influence were 3.39, 3.48 and 3.08 respectively which showed their be- havioral intention to the e-learning have higher identity with the influential factors of the usage. With standard deviation were 0.62, 0.65 and 0.68, the informants did not show difference with the perception level, instead the agreement degree was quite high (Table 3). When the behavioral intention mean score fell on 2.86 which was below than the mean score 3, the informants were not passionate to the adoption of the e-learning. On the as- pect of the usage, it included those with an e-learning system and those without. The mean score was 1.45 which showed that most of the informants use e-learning system when performing relevant business. The stan- Table 2. Average variance extracted (AVE). Variable PE EE SI PE 0.813 EE 0.728 0.889 SI 0.595 0.590 0.825 Table 3. Descriptive statistics and inter-correlations among research variable. VariablesM SD 1 2 3 4 5 1. PE 3.39 0.62 1 2. EE 3.48 0.65 0.73** 1 3. SI 3.08 0.68 0.60** 0.59** 1 4. BI 2.86 0.97 0.38** 0.39** 0.58** 1 5. Usage1.45 0.50 0.11 0.16* 0.14* 0.18**1 N = 264, *p < 0.05, **p < 0.01, ***p < 0.001. C opyright © 2011 SciRes. iB  The Comparison of Three Major Occupations for User Acceptance of Information Technology: Applying the UTAUT Model Copyright © 2011 SciRes. iB 153 dardized deviation was 0.50. fluence. This showed that by lifting the employees’ be- havioral intention could trigger him/her to perform usage. Accordingly, hypothesis 4 was not rejected. Finally, R2 value of the behavioral intention was 34% and that of the usage was 1.1%. Except for the performance expectancy, the correlation coefficient of the usage was 0.111. When any two of them showed no correlative significance, other correla- tion coefficients showed a relationship between every two dimensions which fell between 0.139 to 0.728 for the with significance (p < 0.05). It indicated that the two variables were positively correlated. 4.6. Results of Moderator Effects Basing on prior studies on the variables of the moderator effects, the study was designed to investigate the issue from gender, age and occupation. This approach used a pre-established level of a moderator, which emerges naturally from the study and cannot be modified by re- searchers. For example, a person’s gender, recorded as male or female, naturally forms two moderator levels. To identify a moderation level for age, the dataset was di- vided to form two sets, each representing individuals who belong to a particular generation. An analysis of age distribution demonstrates that two major age groups emerged: Senior and Journal groups. Representatives of these generations may be fundamentally different in terms of various characteristics, perceptions, and behav- iors [45]. Reference [46] used 40 years of age at the day of the survey as a cut-off point. In addition, the classifi- cation of the industry is based on Taiwan Common Wealth Magazine which investigated the manufacture business, the service business and the banking business annually. To sum up, when informants would have higher awareness level to the coordination facility condition of the performance expectancy, effort expectancy and social influence, they would have higher intention to perform the behavior. Besides, when the awareness level of the performance expectancy, social influence and behavioral intention were higher, the correlation with the usage would be higher as well. 4.5. Structural Paths and Hypotheses Tests On the measuring model of the performance expectancy, effort expectancy, social influence, behavioral intention and usage in this study, the χ2 value of the test result was 2.59, and when the freedom level was 3, the significance test probability p-value was 45961. To see it from other fitness index: GFI = 1.00, AGFI = 0.98, NFI = 0.99, CFI = 1.00, SRMR = 0.026, RMSEA = 0.00. Regarding the exogenous variable and the endogenous variable, only the social influence and behavioral inten- tion showed significance influence (Figure 3). The stan- dardized coefficient value was 0.54 (p < 0.001) which was more than significant and showed that when the people by the employees reveal their expectation for the employee to access e-learning system, then the em- ployee’s behavioral intention would be positively af- fected. In addition to this, the performance expectancy, effort expectancy and behavioral intention did not show any significance. Accordingly, hypothesis 3 was not re- jected. The moderator effects of user variables were tested by comparing, and the path coefficients produced for each moderator. Path coefficients were calculated using t-values suggested by Chow [45,46]. From Ta b l e 4 and Figure 4, it could find that gender would cause adjustment to the social influence influ- enced behavioral intention. Regarding the path coeffi- cient, females have higher social influence influenced behavioral intention( = 0.64; p < 0.001) than males ( = 0.33; p < 0.01). Gender did not cause any adjustment effect with other paths. Accordingly, Hypothesis 11 was not rejected. When two endogenous variables (behavioral intention and usage) would have the direct effect as 0.20 which was higher than significance which showed that the em- ployees’ behavioral intention usage caused directive in- Secondly, on the aspect of age, informants under 40 0.01 (0.09) 0.07 (0.88) 0.54*** (8.21) 0.20** (2.99) Usage Denotes not significant Effort Expectancy Performance expectancy Social Influence Behavioral Intention Figure 3. Result of the research model. *p < 0.05; **p < 0.01; ***p < 0.001.  The Comparison of Three Major Occupations for User Acceptance of Information Technology: Applying the UTAUT Model 154 Table 4. The results of moderate effects—gender, age and occupation. Gender Age Occupation Path Male Female Senior Junior Manufacturing Service Bank PE→BI 0.26 –0.12 –0.07 0.23 0.11 0.02 –0.27 EE→BI 0.06 0.06 0.05 0.23 0.07 –0.07 0.29 SI→BI 0.33** 0.64*** 0.63*** 0.18 0.50*** 0.58*** 0.46* N = 264, *p < 0.05, **p < 0.01, ***p < 0.001. Figure 4. Results of moderator effects. *p < 0.05; **p < 0.01; ***p < 0.001 years old show that their social influence would affect the behavioral intention significantly ( = 0.63; p < 0.001). Accordingly, hypothesis 9 was rejected. Besides, from the perspective of occupation, manu- facture business, service business and banking business all showed significant adjustment effect regarding social influence influenced behavioral intention. Among all, the service business ( = 0.58; p < 0.001) would have the highest strength, then the manufacture business ( = 0.50; p < 0.001) and the banking business ( = 0.46; p < 0.05). Accordingly, hypothesis13 was not rejected. Hypothesized results are as Table 5. 5. Discussion and Conclusions 5.1 Discussion Several hypotheses can be drawn from this study. 1) In the model assumed, only social influence influ- enced behavioral intention and usage would cause posi- tive significance. The influence of the performance ex- pectancy and effort expectancy influence behavioral in- tention would not cause positive significance. Therefore, the adoption of UTAUT model in this study was only partial applicable. 2) UTAUT model was proposed by Venkatesh et al. [5] explain 70% of the behavioral intention. But it was only explained 34% of the behavioral intention in this study which adopted UTAUT model. The difference between the two explanatory results might be due to the reasons listed below: a) The employees or managers of the three major oc- cupations in Taiwan did not think mobile learning would help their working performance and thus it was not a factor to affect their behavioral intention. b) The employees or managers of the three major oc- cupations in Taiwan are not because the devices are easy-to-use and to use them. c) The employees of the three major occupations would use mobile instrument to access the e-learning for the users think that their significant other may think that he/she should use the new system. The motivation was not hard to understand. In Taiwan, if an employee wanted to advance his/her job training; he/she would only need to pay partial of the fee. Council of Labor af- fairs of Republic of Taiwan would support 80% of the credit fees. Employees older than 45 years old can even get full support from the government. The up-limit of the support was around 950 USD within three years. There- fore, behavioral intention to use the technologies was mostly external factors, instead of self-triggered motiva- tion. From Lee and Huang [46] indicated because of the “external expectation”, the “social relationship” and the “working behaviors” that push the employees to use the mobile learning system. d) Since UTAUT model established by Venlatesh et al. [5] was a model established for the acceptance of the new information technology by the businessmen and there were some cognitive of latent construct difference between Eastern and Western cultures, it might also re- sult in the explanatory power of the behavioral intention and usage is lower. C opyright © 2011 SciRes. iB 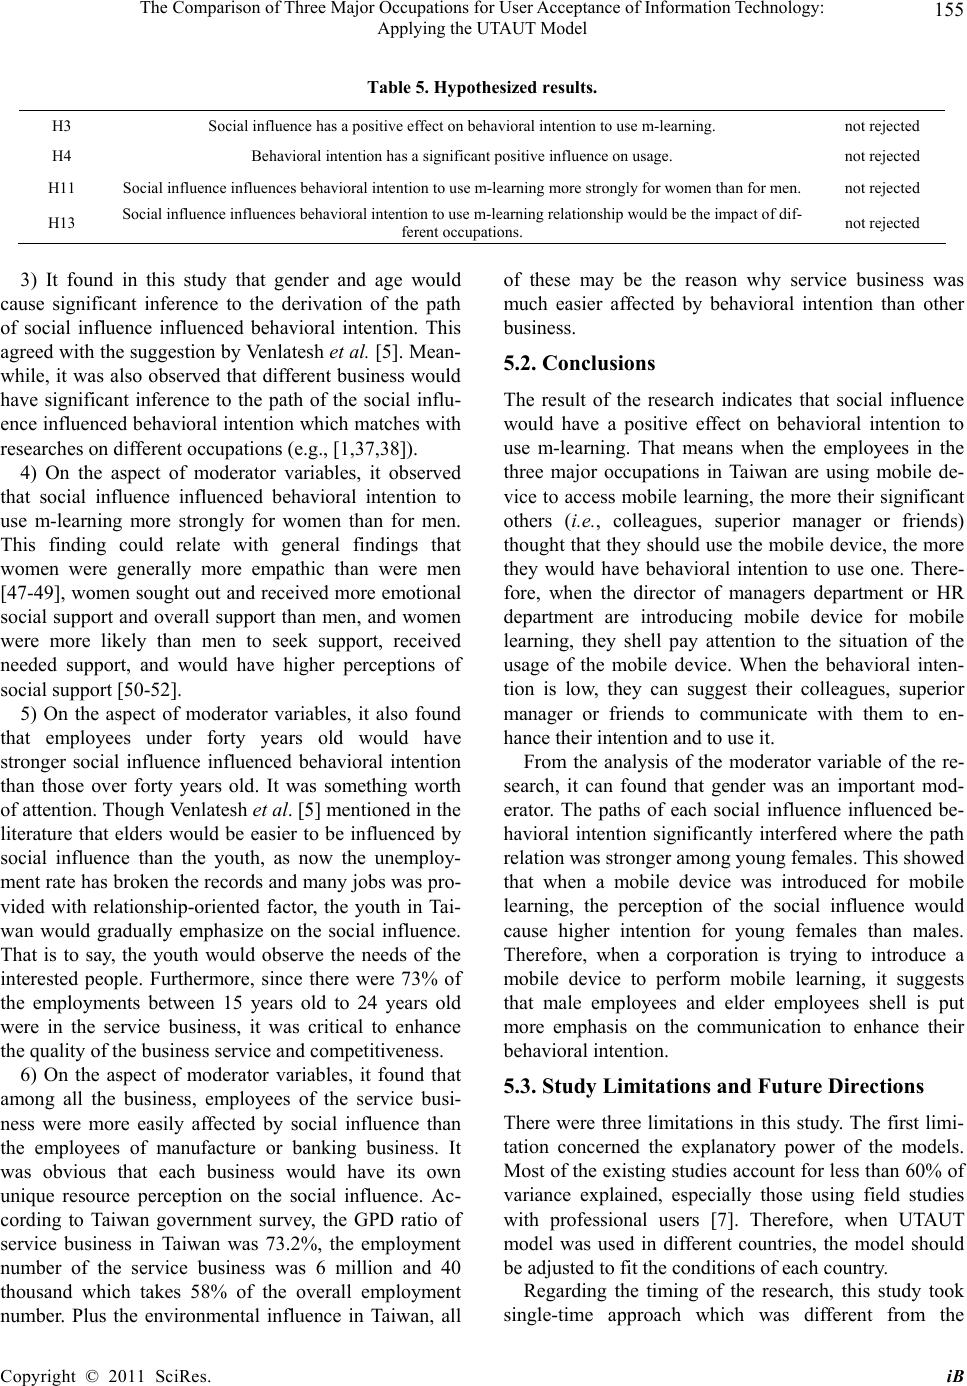 The Comparison of Three Major Occupations for User Acceptance of Information Technology: Applying the UTAUT Model 155 Table 5. Hypothesized results. H3 Social influence has a positive effect on behavioral intention to use m-learning. not rejected H4 Behavioral intention has a significant positive influence on usage. not rejected H11 Social influence influences behavioral intention to use m-learning more strongly for women than for men. not rejected H13 Social influence influences behavioral intention to use m-learning relationship would be the impact of dif- ferent occupations. not rejected 3) It found in this study that gender and age would cause significant inference to the derivation of the path of social influence influenced behavioral intention. This agreed with the suggestion by Venlatesh et al. [5]. Mean- while, it was also observed that different business would have significant inference to the path of the social influ- ence influenced behavioral intention which matches with researches on different occupations (e.g., [1,37,38]). 4) On the aspect of moderator variables, it observed that social influence influenced behavioral intention to use m-learning more strongly for women than for men. This finding could relate with general findings that women were generally more empathic than were men [47-49], women sought out and received more emotional social support and overall support than men, and women were more likely than men to seek support, received needed support, and would have higher perceptions of social support [50-52]. 5) On the aspect of moderator variables, it also found that employees under forty years old would have stronger social influence influenced behavioral intention than those over forty years old. It was something worth of attention. Though Venlatesh et al. [5] mentioned in the literature that elders would be easier to be influenced by social influence than the youth, as now the unemploy- ment rate has broken the records and many jobs was pro- vided with relationship-oriented factor, the youth in Tai- wan would gradually emphasize on the social influence. That is to say, the youth would observe the needs of the interested people. Furthermore, since there were 73% of the employments between 15 years old to 24 years old were in the service business, it was critical to enhance the quality of the business service and competitiveness. 6) On the aspect of moderator variables, it found that among all the business, employees of the service busi- ness were more easily affected by social influence than the employees of manufacture or banking business. It was obvious that each business would have its own unique resource perception on the social influence. Ac- cording to Taiwan government survey, the GPD ratio of service business in Taiwan was 73.2%, the employment number of the service business was 6 million and 40 thousand which takes 58% of the overall employment number. Plus the environmental influence in Taiwan, all of these may be the reason why service business was much easier affected by behavioral intention than other business. 5.2. Conclusions The result of the research indicates that social influence would have a positive effect on behavioral intention to use m-learning. That means when the employees in the three major occupations in Taiwan are using mobile de- vice to access mobile learning, the more their significant others (i.e., colleagues, superior manager or friends) thought that they should use the mobile device, the more they would have behavioral intention to use one. There- fore, when the director of managers department or HR department are introducing mobile device for mobile learning, they shell pay attention to the situation of the usage of the mobile device. When the behavioral inten- tion is low, they can suggest their colleagues, superior manager or friends to communicate with them to en- hance their intention and to use it. From the analysis of the moderator variable of the re- search, it can found that gender was an important mod- erator. The paths of each social influence influenced be- havioral intention significantly interfered where the path relation was stronger among young females. This showed that when a mobile device was introduced for mobile learning, the perception of the social influence would cause higher intention for young females than males. Therefore, when a corporation is trying to introduce a mobile device to perform mobile learning, it suggests that male employees and elder employees shell is put more emphasis on the communication to enhance their behavioral intention. 5.3. Study Limitations and Future Directions There were three limitations in this study. The first limi- tation concerned the explanatory power of the models. Most of the existing studies account for less than 60% of variance explained, especially those using field studies with professional users [7]. Therefore, when UTAUT model was used in different countries, the model should be adjusted to fit the conditions of each country. Regarding the timing of the research, this study took single-time approach which was different from the C opyright © 2011 SciRes. iB  The Comparison of Three Major Occupations for User Acceptance of Information Technology: Applying the UTAUT Model 156 UTAUT model which was proposed by Venkatesh et al. [5] where three measuring time of the same groups of samples should be applied. This may also be the reason that causes the result is different. Since the result of the research indicated that the users of the three major occupations in Taiwan was mostly motivated by social influence, it suggests that future study can focus on the application relation between the social influence and the users’ behavioral intention for new technologies. 6. Acknowledgements The authors would like to thank Taiwan Institute for In- formation Industry provides the information. REFERENCES [1] T. Zhou, Y. B. Lu and B. Wang, “Integrating TTF and UTAUT to Explain Mobile Banking User Adoption,” Computers in Human Behavior, Vol. 26, No. 4, 2010, pp. 760-767. doi:10.1016/j.chb.2010.01.013 [2] P. Y. K. Chau and P. J. H. Hu, “Investigating Healthcare Professionals’ Decisions to Accept Telemedicine Tech- nology: An Empirical Test of Competing Theories,” In- formation & Management, Vol. 39, No. 4, 2002, pp. 297- 311. doi:10.1016/S0378-7206(01)00098-2 [3] Taiwan Institute for Information Industry, “The Investiga- tion of Corporate E-Learning into the Status-Results Re- port (100 Largest Financial),” National E-Learning Network Science Park Plans to Shape Science and Technology, 2005. [4] Industrial Development Bureau, Ministry of Economic Affairs in Taiwan, “The Ratios among the Occupations of Manufacture, Banking and Service in Buying or Making E-Learning Platform,” 2010. http://www.moeaidb. gov.tw/ [5] V. Venkatesh, M. Morris, G. B. Davis and F. D. Davis, “User Acceptance of Information Technology: Toward a Unified View,” MIS Quarterly, Vol. 27, No. 3, 2003, pp. 425-478. [6] W. W. Chin, B. L. Marcolin and P. R. Newsted, “A Par- tial Least Squares Latent Variable Modeling Approach for Measuring Interaction Effects: Results from a Monte Carlo Simulation Study and an Electronic-Mail Emo- tion/Adoption Study,” Information Systems Research, Vol. 14, No. 2, 2003, pp. 189-217. doi:10.1287/isre.14.2.189.16018 [7] H. Sun and P. Zhang, “The Role of Model Rating Factors in User Technology Acceptance,” International Journal Human-Computer Studies, Vol. 64, No. 2, 2006, pp. 53- 78. doi:10.1016/j.ijhcs.2005.04.013 [8] F. D. Davis, “Perceived Usefulness, Perceived Ease of Use, and User Acceptance of Information Technology,” MIS Quarterly, Vol. 13, No. 3, 1989, pp. 319-334. doi:10.2307/249008 [9] R. Agarwal and J. Prasad, “Are Individual Differences Germane to the Acceptance of New Information Tech- nologies?” Decision Sciences, Vol. 30, No. 2, 1999, pp. 361-391. doi:10.1111/j.1540-5915.1999.tb01614.x [10] S. Kulviwat, G. C. Bruner II, A. Kumar, S. A. Nasco and T. Clark, “Toward a Unified Theory of Consumer Ac- ceptance Technology,” Psychology and Marketing, Vol. 24, No. 12, 2007, pp. 1059-1084. doi:10.1002/mar.20196 [11] S. Taylor and P. A. Todd, “Understanding Information Technology Usage: A Test of Competing Models,” In- formation Systems Research, Vol. 6, No. 2, 1995, pp. 144-174. doi:10.1287/isre.6.2.144 [12] V. Venkatesh and M. Morris, “Why Don’t Men Ever Stop to Ask for Directions? Gender, Social Influence, and Their Role in Technology Acceptance and Usage Behav- ior,” MIS Quarterly, Vol. 24, No. 1, 2000, pp. 115-139. doi:10.2307/3250981 [13] V. Venkatesh, “Veterminants of Perceived Ease of Use: Integrating Control, Intrinsic Motivation, and Emotion into the Technology Acceptance Model,” Information Systems Research, Vol. 4, No. 4, 2000, pp. 342-365. doi:10.1287/isre.11.4.342.11872 [14] D. Y. Kim, J. Park and A. M. Morrison, “A Model of Traveller Acceptance of Mobile Technology,” Interna- tional Journal of Tourism Research, Vol. 10, No. 5, 2008, pp. 393-407. doi:10.1002/jtr.669 [15] R. Agarwal and J. Prasad, “A Conceptual and Operational Definition of Personal Innovativeness in the Domain of Information Technology,” Information Systems Research, Vol. 9, No. 2, 1998, pp. 204-215. doi:10.1287/isre.9.2.204 [16] I. Ajzen and M. Fishbein, “Understanding Attitudes and Predicting Social Behavior,” Englewood Cliffs, Pren- tice-Hall, Upper Saddle River, 1980. [17] M. Fishbein and I. Ajzen, “Belief, Attitude, Intention, and Behavior: An Introduction to Theory and Research,” Ad- dison-Wesley, Reading, 1975. [18] I. Ajzen, “From Intentions to Actions: A Theory of Planned Behavior,” In: J. Kuhl and E. Beckmann, Eds., In Action Control: From cognition to Behavior, Springer- Verlag, Berlin, 1985, pp. 11-39. [19] G. C. Moore and I. Benbasat, “Development of an In- strument to Measure the Perceptions of Adopting an In- formation Technology Innovation,” Information Systems Research, Vol. 2, No. 3, 1991, pp. 192-222. doi:10.1287/isre.2.3.192 [20] F. D. Davis and V. Venkatesh, “A Critical Assessment of Potential Measurement Biases in the Technology Accep- tance Model: Three Experiments,” Internet Journal of Human-Computer Studies, Vol. 45, No. 1, 1996, pp. 19- 45. [21] V. Venkatesh and F. D. Davis, “A Theoretical Extension of the Technology Acceptance Model: Four Longitudinal Field Studies,” Management Science, Vol. 46, No. 2, 2000, pp. 186-204. doi:10.1287/mnsc.46.2.186.11926 [22] F. D. Davis, R. P. Bagozzi and P. R. Warshaw, “User Acceptance of Computer Technology: A Comparison of C opyright © 2011 SciRes. iB  The Comparison of Three Major Occupations for User Acceptance of Information Technology: Applying the UTAUT Model 157 Two Theoretical Models,” Management Science, Vol. 35, No. 8, 1989, pp. 982-1003. doi:10.1287/mnsc.35.8.982 [23] R. L. Thompson, C. A. Higgins and J. M. Howell, “Per- sonal Computing: Toward a Conceptual Model of Utili- zation,” MIS Quarterly, Vol. 15, No. 1, 1991, pp. 125- 143. doi:10.2307/249443 [24] F. D. Davis, R. P. Bagozzi and P. R. Warshaw, “Extrinsic and Intrinsic Motivation to Use Computers in the Work- place,” Journal of Applied Social Psychology, Vol. 22, No. 14, 1992, pp. 1111-1132. doi:10.1111/j.1559-1816.1992.tb00945.x [25] D. R. Compeau and C. A. Higgins, “Computer Self-Effi- cacy: Development of a Measure and Initial Test,” MIS Quarterly, Vol. 19, No. 2, 1995, pp. 189-211. doi:10.2307/249688 [26] D. R. Compeau, C. A. Higgins and S. Huff, “Social Cog- nitive Theory and Individual Reactions to Computing Technology: A Longitudinal Study,” MIS Quarterly, Vol. 23, No. 2, 1999, pp. 145-158. doi:10.2307/249749 [27] M. Ahearne, N. Srinivasan and L. Weinstein, “Effect of Technology on Sales Performance: Progressing from Technology Acceptance to Technology Usage and Con- sequence,” Journal of Personal Selling & Sales Man- agement, Vol. 24, No. 5, 2004, pp. 297-310. [28] I. Ajzen, “The Theory of Planned Behavior,” Organiza- tional Behavior and Human Decision, Vol. 50, No. 2, 1991, pp. 179-211. doi:10.1016/0749-5978(91)90020-T [29] Y. S. Wang, M. C. Wu and H. Y. Wang, “Investigating the Determinants and Age and Gender Differences in the Ac- ceptance of Mobile Learning,” British Journal of Educa- tional Technology, Vol. 40, No. 1, 2009, pp. 92-118. d oi:10.1111/j.1467-8535.2007.00809.x [30] S. Taylor and P. A. Todd, “Assessing IT Usage: The Role of Prior Experience,” MIS Quarterly, Vol. 19, No. 2, 1995, pp. 561-570. doi:10.2307/249633 [31] H. C. Triandis, “Interpersonal Behavior,” Brooke/Cole, Monterey, 1977. [32] E. M. Rogers, “Diffusion of Innovations,” 5th Edition, Free Press, New York, 2003. [33] A. Bandura, “Social Foundations of Thought and Action: A Social Cognitive Theory,” Prentice Hall, Englewood Cliffs, Upper Saddle River, 1986. [34] E. M. Rogers, “Diffusion of Innovations,” Free Press, New York, 1995. [35] I. Ajzen and M. Fishbein, “Attitude-Behavior Relations: A Theoretical Analysis and Review of Empirical Re- search,” Psychological Bulletin, 1977, pp. 84-85. [36] T. Koivumäki, A. Ristola and M. Kesti, “The Perceptions Towards Mobile Services: An Empirical Analysis of the Role of Use Facilitators,” Personal and Ubiquitous Computing, Vol. 12, No. 1, 2008, pp. 67-75. [37] F. C. Tung, M. S. Lee, C. C. Chen and Y. S. Hsu, “An Extension of Financial Cost and TAM Model with IDT for Exploring Users’ Behavioral Intentions to Use the CRM Information System,” Social Behavior and Per- sonality, Vol. 37, No. 5, 2009, pp. 621-626. doi:10.2224/sbp.2009.37.5.621 [38] Y. C. Lee, M. L. Li, T. M. Yen and T. H. Hua, “Analysis of Adopting an Integrated Decision Making Trial and Evaluation Laboratory on a Technology Acceptance Model,” Expert System with Application, Vol. 37, No. 2, 2010, pp. 1745-1754. doi:10.1016/j.eswa.2009.07.034 [39] V. Venkatesh, M. G. Morris and P. L. Ackerman, “A Lon- gitudinal Field Investigation of Gender Differences in In- dividual Technology Adoption Decision Making Proc- esses,” Organizational Behavior and Human Decision Processes, Vol. 83, No. 1, 2000, pp. 33-60. doi:10.1006/obhd.2000.2896 [40] T. K. Peng, Y. T. Kao and C. C. Lin, “Common Method Variance in Management Research: Its Nature, Effects, Detection, and Remedies,” Journal of Management, Vol. 23, No. 1, 2006, pp. 77-98. [41] J. C. Nunnally, “Psychometric Theory,” 2nd Edition, McGraw-Hill, New York, 1978. [42] C. Fornell and D. F. Larcker, “Evaluating Structural Equation Models with Unobservable Variables and Mea- surement Error,” Journal of Marketing Research, Vol. 18, No. 1, 1981, pp. 39-50. doi:10.2307/3151312 [43] R. P. Baggozzi and Y. Yi, “On the Evaluation of Struc- tural Equation Models,” Academic of Marketing Science, Vol. 16, No. 1, 1988, pp. 76-94. [44] J. F. Jr. Hair, R. E. Anderson, R. L. Tatham and W. C. Black, “Multivariate Data Analysis,” 5th Edition, Prentice Hall, Upper Saddle River, 1998. [45] D. H. Shin, “Towards an Understanding of the Consumer Acceptance of Mobile Wallet,” Computers in Human Behavior, Vol. 25, No. 6, 2009, pp. 1343-1354. doi:10.1016/j.chb.2009.06.001 [46] G. C. Chow, “Tests of Equality Between Sets of Coeffi- cients in Two Linear Regressions,” Econometrica, Vol. 28, No. 3, 1960, pp. 591-605. doi:10.2307/1910133 [47] K. Serenko, O. Turel and S. Yol, “Modelrating Roles of User Demographics in the American Customer Satisfac- tion Model within the Context of Mobile Services,” Journal of Information Technology Management, Vol. 17, No. 4, 2006, pp. 20-32. [48] T. Z. Lee and L. Y. Huang, “Related Research in Learning Motivation, Learning Satisfaction and Learning Per- formance of Continuing Education for In-service Per- sonage: Taking in-Service Master Program of NCKU as Example,” Journal of Human Resource Management, Vol. 7, No. 4, 2007, pp. 1-24. [49] A. Macaskill, J. Maltby and L. Day, “Forgiveness of Self and Others and Emotional Empathy,” The Journal of So- cial Psychology, Vol. 142, No. 5, 2002, pp. 663-665. doi:10.1080/00224540209603925 [50] B. A. Gault and J. Sabini, “The Roles of Empathy, Anger, and Gender in Predicting Attitudes Toward Punitive, Re- parative, and Preventative Public Policies,” Cognition and Emotion, Vol. 14, No. 4, 2000, pp. 495-520. doi:10.1080/026999300402772 C opyright © 2011 SciRes. iB  The Comparison of Three Major Occupations for User Acceptance of Information Technology: Applying the UTAUT Model Copyright © 2011 SciRes. iB 158 [51] K. C. McLeland and G. W. Sutton, “Sexual Orientation, Mental Health, Gender, and Spirituality: Prejudicial Atti- tudes and Social Influence in Faith Communities,” Jour- nal of Psychology and Theology, Vol. 36, No. 2, 2008, pp. 104-113. [52] L. E. McClelland and J. A. McCubbin, “Social Influence and Pain Response in Women and Men,” Journal of Be- havioral Medicine, Vol. 35, No. 1, 2008, pp. 413-420. doi:10.1007/s10865-008-9163-6
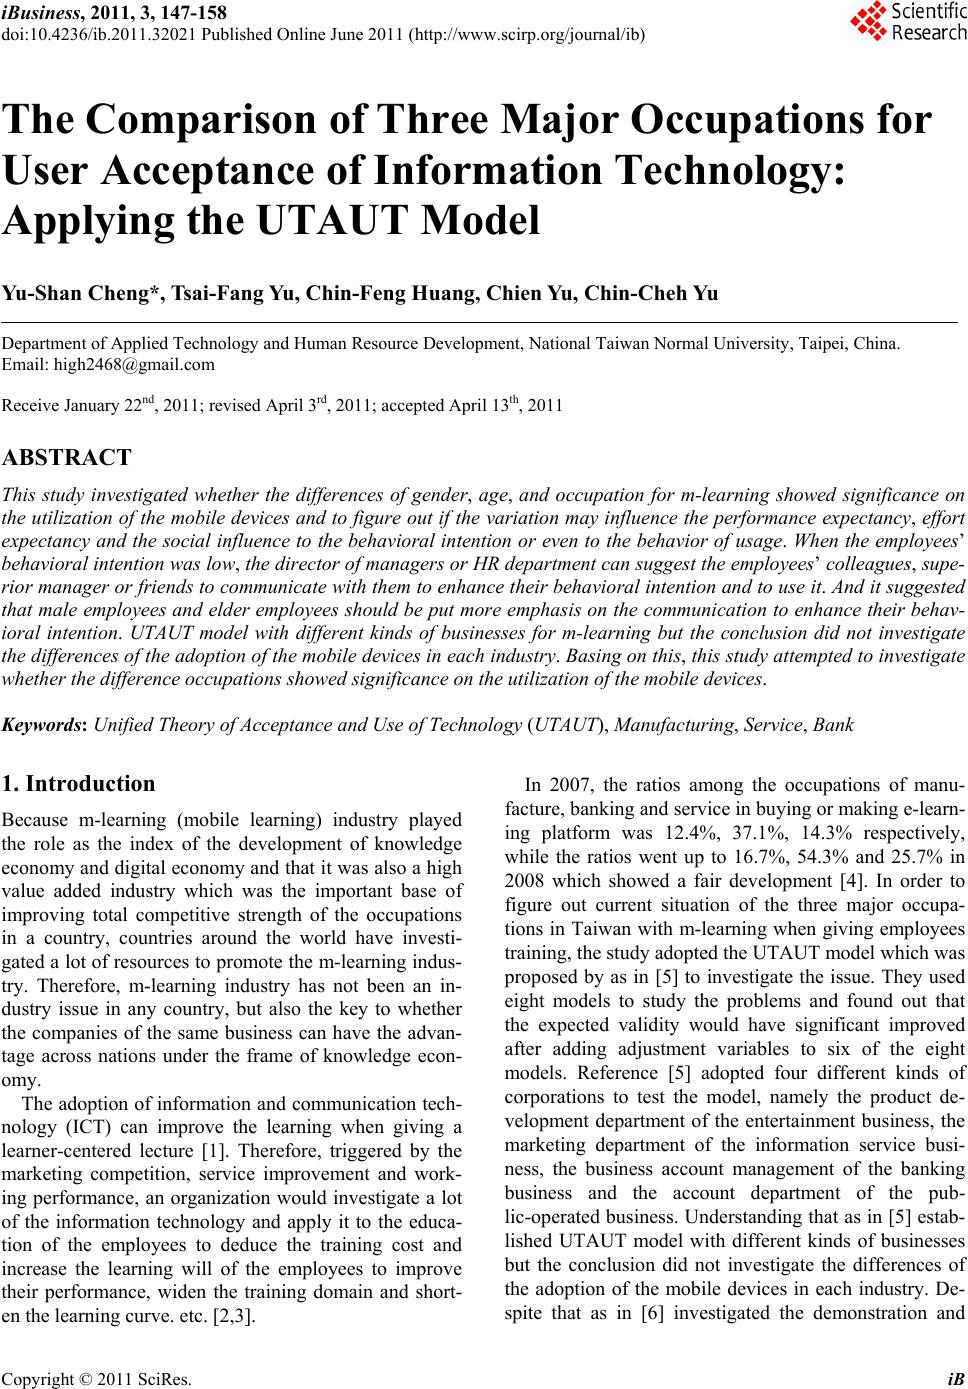
|