 American Journal of Plant Sciences, 2011, 2, 223-236 doi:10.4236/ajps.2011.22024 Published Online June 2011 (http://www.SciRP.org/journal/ajps) Copyright © 2011 SciRes. AJPS Leaf Colour Chart vis-a-vis Nitrogen Management in Different Rice Genotypes Avijit Sen, Vinod Kumar Srivastava, Manoj Kumar Singh, Ram Kumar Singh, Suneel Kumar Department of Agronomy, Institute of Agricultural Sciences, Banaras Hindu University, Varanasi, India. Email: avijitbhu@hotmail.com Received February 16th, 2011; revised April 25th, accepted May 1st, 2011. ABSTRACT A field trial comprising 3 rice varieties (NDR-359, Sarju 52, HUBR 2-1) and 4 LCC scores (≤2, ≤3, ≤4, ≤5) a long with the recommended dose of N was condu cted in a split plot design to calibrate the LCC for nitrog en requirement of rice. Maximum grain yields of NDR-359, Sarju 52 at LCC ≤ 5 and HUBR 2-1 at LCC ≤ 4 were found to be 47.10, 40.66 and 36.04 q/ha respectively. The critical LCC score for real time nitrogen requirement for NDR 359 and Sarju 52 was found to be ≤ 5, while for HUBR 2-1 it was ≤ 4. Agronomic and recovery efficiency of nitrog en also followed the same trend. In the functional relationship between SPAD value and LCC score, while it was linear in NDR-359 and Sarju 52, for HUBR 2-1 it was quadratic. Further a positive correlation between SPAD values and LCC score was observed in all the 3 varieties. Keywords: Leaf Colour Chart (LCC), Nitrogen, Rice 1. Introduction Rice is the most important source of staple food in India occupying 44.6 Mha of land and producing 91.04 Mt of grain with a productivity of 2.04 t/ha [1]. Every third person on the earth eats rice everyday in one form or the other and 90% of the total rice produced is consumed in Asian countries. However, India’s productivity is very low in comparison to other major rice growing countries in the world. Among various reasons for this low produc- tivity, inefficient utilization of nitrogen in considered to be the most critical one [2]. On the recent world-wide evaluation of fertilizer, its recovery efficiency has been found to be around 30% in rice [3]. It has been observed that more than 60% of applied nitrogen is lost due to lack of synchronization between the nitrogen demand and nitrogen supply [4]. Farmers generally apply nitrogen fertilizer in fixed time recommended N split schedule [5] in 1:2:1 or 2:1:1 ratio at basal, maximum tillering and panicle initiation stages respectively, without taking into account whether the plant really requires N at that time which may lead to loss or may not be found adequate enough to synchronize nitrogen supply with actual crop nitrogen demand [6]. The optimum use of N can be achieved by matching N supply with crop demand [7]. A simple and quick method for estimating plant N demand is LCC i.e. leaf colour chart [8] and SPAD (chlorophyll meter) readings which can estimate leaf chlorophyll content in a nonde- structive manner [9], thereby providing an indirect as- sessment of leaf N status [10]. LCC is easy to use and is an inexpensive diagnostic tool for monitoring the relative greenness of a rice leaf as an indicator for the plant N status and can be used as an alternative to chlorophyll meter [11]. It offers substantial opportunities to farmers for detection of time and amount of N to be applied (on demand) for efficient N use and high rice yield. Thus LCC becomes useful in avoiding under or above fertili- zation besides maintaining the appropriate time [12]. Use of LCC for N management has consistently increased grain yield and profit in comparison to the farmers’ fer- tilizer practice in Bangladesh [13-15]. However, critical LCC values vary considerably among different rice genotypes having different genetic background, plant type and leaf colour [16] and this critical colour shade on the LCC needs to be determined to guide N application [7]. Keeping this in view the following field trial was conducted to determine the critical threshold LCC values for different rice genotypes on the basis of growth, yield, agronomic and recovery efficiency of N. 2. Materials and Methods A field trial was conducted during the two consecutive  Leaf Colour Chart vis-a-vis Nitrogen Management in Different Rice Genotypes 224 kharif (rainy) seasons of 2005 and 2006 in the Agricul- tural Research Farm of the Institute at Varanasi (25°18′N latitude, 88°3′E longitude and at an altitude of 128.90 m above mean sea level) situated in the Indo-Gangetic plain regions of the eastern part of Uttar Pradesh. The climate of Varanasi is semiarid subtropical with dry hot summer and cold winter. The average annual rainfall is 1150 mm, major part of which is received during the later part of June to mid September. The soil of the experimental site was sandy clay loam in texture, deep flat, slightly alka- line in reaction (pH 7.3), well drained and moderately fertile being low in available nitrogen (208.00 kg/ha) and phosphate (15.20 kg/ha) and medium in available potas- sium (231.40 kg/ha). The organic carbon content was 0.43% (Table 1). The experiment was laid out in a split plot design with four replications. Three rice genotypes, NDR 359 (a me- dium duration high yielding variety released from NDUAT, Faizabad with a yield potential of 4 - 5 t/ha), Sarju 52 (a 130 - 135 days duration variety having a yield potential of 5.0 - 5.5 t/ha with long, bold grain) and HUBR 2-1 (an aromatic rice genotype of 135 - 140 days duration with relatively thinner leaf developed and re- leased by Banaras Hindu University with an average yield of 4.0 - 4.5 t/ha) were grown in the main plots while the five fertilizer N (as urea) management treat- ments were allotted to sub-plots. In all the varieties the LCC scores of <2, ≤3, ≤4 and ≤5 were compared with fixed time recommended N rate of 120 kg/ha. In the recommended N rate treatment, nitrogen was applied in 1:2:1 ratio at the time of sowing, maximum tillering and panicle initiation stages respectively. A uniform dose of phosphorous and potassium @ 60 kg/ha each and Zn @ 5 kg/ha were applied to all the plots as basal. 2.1. Crop Raising The experimental field was prepared by puddling twice with disc harrow and one with cultivator and each ploughing was followed by planking. After preparing the field 30 days old seedlings were transplanted on 5th July, 2005 and 10th July 2006 at a spacing of 20 × 15 cm @ 3/4 seedlings/hill. After the establishment of seedlings a constant water level of 5 ± 2 cm was maintained during the entire crop growth period till early dough stage. For the management of weeds two hand weeding were done at 25 and 45 days after transplanting (DAT) respectively. The crop was harvested manually at maturity at ground level on 12th October, 2005 and 14th October, 2006 re- spectively. Grain (at 13% moisture content) and straw yield on sun dry weight basis were reported in q/ha. 2.2. Leaf Colour Chart The LCC developed by the Directorate of Rice Research, Hyderabad, India with seven green shades ranging from yellowish green to dark green was used in the trial. LCC readings were taken at 4 days interval starting from 10 DAT till 50% flowering. 10 disease free hills were se- lected at random from the sampling area in each plot. From each hill topmost fully expanded leaf was selected and LCC readings were taken by placing the middle part of the leaf on the chart and the leaf colour was observed by keeping the sun blocked by body as sun light affects leaf colour reading. Whenever the green colour of more than 5 out of 10 leaves were observed equal to or below a set critical limit of LCC score, nitrogen was applied @ 20 kg/ha to all the three varieties. For all the varieties the final split application of N was completed by 61/62 days after transplanting coinciding with the heading stage. A basal application of 30 kg/N ha was made in all the cases as per prevalent package of practices of this area (Table 2). The SPAD reading of the same leaf used for LCC meas- urement was also taken at three stages on 30, 60 and 90 DAT. The chlorophyll meter (SPAD—502, Minolta, Ramsey, NJ) or SPAD (Soil Plant Analysis Development) Table 1. Physical and chemical properties of soil of the experimental site. Soil Particular Value Parameters 2005 2006 Physical Bulk density (g·cc–1) True density (g·cc–1) Pore space (%) WHC (cm) 1.46 2.63 45.50 35.71 1.48 2.65 44.50 34.84 Sand (%) Silt (%) Clay (%) Texture 48.84 29.01 22.41 Sandy Clay Loam 49.10 28.75 22.29 Sandy Clay Loam Chemical pH (1:2.5 soil water suspension) EC (1:2.5 soil water suspension) Organic carbon (%) Available N (kg·ha–1) Available P k ·ha–1 7.32 0.14 0.42 209.10 15.70 7.30 0.15 0.43 208.00 15.23 Copyright © 2011 SciRes. AJPS  Leaf Colour Chart vis-a-vis Nitrogen Management in Different Rice Genotypes 225 Table 2. Treatment used in rice (a basal dose of 30 kg·N·ha–1 was applied to all the treatments). Treatment details Number of splits Total N applied (kg·ha–1 ) Time of N application (DAT) Variety × N management 2005 2006 2005 2006 2005 2006 NDR-359 Recommended dose of N 20 kg·N·ha–1 of LCC < 2 20 kg·N·ha–1 of LCC < 3 20 kg·N·ha–1 of LCC < 4 20 kg·N·ha–1 of LCC < 5 Sarju 52 Recommended dose of N 20 kg·N·ha–1 of LCC < 2 20 kg·N·ha–1 of LCC < 3 20 kg·N·ha–1 of LCC < 4 20 kg·N·ha–1 of LCC < 5 HUBR 2-1 Recommended dose of N 20 kg·N·ha–1 of LCC < 2 20 kg·N·ha–1 of LCC < 3 20 kg·N·ha–1 of LCC < 4 20 kg·N·ha–1 of LCC < 5 3 4 4 5 4 3 4 4 5 5 3 4 4 5 6 3 3 3 4 4 3 3 3 4 4 3 3 3 4 5 30 + 60 + 30 = 120 30 + 20 + 20 + 20 = 90 30 + 20 + 20 + 20 = 90 30 + 20 + 20 + 20 + 20 = 110 30 + 20 + 20 + 20 + 20 = 110 30 + 60 + 30 = 120 30 + 20 + 20 + 20 = 90 30 + 20 + 20 + 20 = 90 30 + 20 + 20 + 20 + 20 = 110 30 + 20 + 20 + 20 + 20 = 110 30 + 60 + 30 = 120 30 + 20 + 20 + 20 = 90 30 + 20 + 20 + 20 = 90 30 + 20 + 20 + 20 + 20 = 110 30 + 20 + 20 + 20 + 20 + 20 = 130 30 + 60 + 30 = 120 30 + 20 + 20 = 70 30 + 20 + 20 = 70 30 + 20 + 20 + 20 = 90 30 + 20 + 20 + 20 = 90 30 + 60 + 30 = 120 30 + 20 + 20 = 70 30 + 20 + 20 = 70 30 + 20 + 20 + 20 = 90 30 + 20 + 20 + 20 = 90 30 + 60 + 30 = 120 30 + 20 + 20 = 70 30 + 20 + 20 = 70 30 + 20 + 20 + 20 = 90 30 + 20 + 20 + 20 + 20 = 110 0, 31, 62 0, 31 0, 25, 47, 62 0, 18, 38, 48, 61 0, 16, 30, 45, 61 0, 30, 60 0, 30, 45, 58 0, 25, 44, 55 0, 18, 35, 47, 61 0, 17, 35, 43, 60 0, 30, 60 0, 30, 43, 58 0, 27, 40, 56 0, 18, 35, 47, 62 0, 14, 27, 40, 50, 61 0, 31, 62 0, 31, 53 0, 28, 51 0, 20, 41, 63 0, 17, 38, 60 0, 30, 60 0, 30, 52 0, 29, 50 0, 20, 42, 62 0, 18, 39, 60 0, 30, 60 0, 31, 52 0, 29, 51 0, 20, 40, 60 0, 19, 36,49, 61 meter is a convenient and reliable tool for in situ chloro- phyll measurement of plant [17,18] and has been used for different crops including rice [8]. Leaf area was calcu- lated in situ by measuring the leaf blade length (l) and width (w) at three stages by the following formula [19]. Leaf area = k × l × w with k being the “adjustment factor”, the value of which was 0.75. Dry weight of the crop was determined after oven drying it at 65˚C ± to constant weight. Further grain and straw samples collected from each plot were dried at 70˚C in an oven and grounded in the iron grinder. These sam- ples were digested in sulfuric acid (H2SO4) and analyzed for their total N content by the Kjeldahl method [20]. Efficiency studies of nitrogen were made as per the following formula given by [21]. In the recovery effi- ciency studies since the nutrient contained in the har- vested portion of the crop (only the above ground portion) was considered it was termed as nutrient removed instead of nutrient uptake [22]. Agronomic efficiency (increase in grain yield in kg/kg N applied through LCC) n Grain yield in LCC N fertilized plitgrain yield in recommended N fertilized plot AE Quantily of N fertilizer applied in LCC N fertilized plot Recovery efficiency REn (%) n RE Total N removed (kgha) in LCC N fertilized plotTotal N removed (kgha) in recommended N fertilized plot100 Quantily of N fertilizer applied in LCC N fertilized plot Analyses of the data were done as per the methodol- ogy of Gomez and Gomez [23]. Functional relationships between LCC score and chlorophyll content (SPAD) were worked out using MS Excel (2003) and the ac- cepted significance level was 0.05. 3. Results and Discussion For all the three varieties total nitrogen applied with LCC ≤ 2 and ≤ 3 were 90 and 70 kg/ha , while it was 110 and 90 kg/ha with LCC ≤ 4 and ≤ 5 in first and second year respectively (Table 2). However, under recommended dose of nitrogen it was 120 kg/ha applied in 3 splits. For all the varieties the final split application was completed by 61/62 days after transplanting coinciding with the heading stage. A basal application of 30 kg·N/ha was applied under all the treatments as per prevalent package Copyright © 2011 SciRes. AJPS  Leaf Colour Chart vis-a-vis Nitrogen Management in Different Rice Genotypes 226 of practices of this area. Among the varieties NDR 359 produced leaves with maximum area/ hill followed by Sarju 52 and HUBR 2-1 respectively and leaf area of NDR 359 was found to be significantly superior to HUBR 2-1 (Table 3). In the leaf colour chart score LCC ≤ 5 for NDR 359 and Sarju 52 showed significantly higher leaf area than other scores and recommended dose at all the stages of growth. However, in case of HUBR 2-1 LCC ≤ 4 and ≤ 5 re- mained statistically at par with each other with maximum leaf area. Leaf area index (LAI) was found to increase up to 60 DAT after which it decreased with the passage of time (Table 4). Leaf area index for the varieties and LCC scores were found in the order of NDR 359 > Sarju 52 > HUBR 2-1 and LCC 5 > 4 > 3 > 2 > recommended dose of N. Further, variety was found to interact significantly with LCC score in influencing the LAI. At all the stages of growth the highest LAI was recorded in NDR 359 at LCC ≤ 5. No significant effect in chlorophyll content of leaves due to varieties was observed at any stage of the growth (Table 5). However, significant differences were ob- served due to LCC scores at all the stages of growth. There was a gradual increase in the chlorophyll content with the increase in LCC score up to ≤ 5 for NDR 359 and Sarju 52 while for HUBR 2-1 the increase was up to ≤ 4 only beyond which it declined. Significant differ- ences in dry weight of hill were observed due to both the variables at all the stages of growth during both the years (Table 6). Among the varieties NDR 359 registered maximum dry weight followed by Sarju 52 and HUBR 2-1 while in case of LCC scores the highest dry weight was found with score ≤ 5 for NDR 359 and Sarju 52 and ≤ 4 for HUBR 2-1. In all the cases the lowest dry weight was found with recommended dose of N application. Similar trend was observed in al the reproductive char- acters of rice also (Tables 7 and 8). Number of pani- cles/m, panicle length, panicle weight, filled spikelets/ panicle, grain filling percentage, test weight, grain and straw yields were found to be higher with NDR 359 among the varieties and with LCC ≤ 5 among the LCC scores except in HUBR 2-1 where LCC ≤ 4 out yielded LCC ≤ 5. In the nitrogen removal studies it was observed that maximum amount of N was removed by NDR 359 which was significantly superior to other two varieties during both the years (Table 9). Among the LCC scores while N removal from soil was highest at ≤ 5 for both NDR 359 and Sarju 52, it was highest at LCC ≤ 4 for HUBR 2-1. Further for agronomic and recovery efficiency of N it was found to be highest at LCC ≤ 5 for NDR 359 and Sarju 52 but at LCC ≤ 4 for HUBR 2-1 (Table 10). Table 3. Effect of treatments on the leaf area (cm2·hill−1) of rice. 30 DAT 60 DAT 90 DAT N-management 2005 2006 2005 2006 2005 2006 NDR-359 Recommended dose LCC < 2 LCC < 3 LCC < 4 LCC < 5 Mean 17.07 18.71 18.89 22.11 25.43 20.44 16.71 18.25 18.43 21.79 25.08 20.05 48.89 50.43 50.81 53.92 57.23 52.30 49.71 51.25 51.43 54.79 58.08 53.05 44.43 45.11 46.09 47.34 49.67 46.53 43.71 44.25 45.43 46.79 48.80 45.08 Sarju-52 Recommended dose LCC < 2 LCC < 3 LCC < 4 LCC < 5 Mean 15.52 18.22 18.38 19.11 22.86 18.82 15.01 17.75 17.98 18.70 22.53 18.40 47.32 58.02 51.77 51.07 54.43 50.92 48.01 50.75 52.23 51.70 55.73 51.64 41.05 43.72 44.02 45.42 48.13 44.47 40.19 42.92 43.15 44.75 47.58 43.71 HUBR 2-1 Recommended dose LCC < 2 LCC < 3 LCC < 4 LCC < 5 Mean 14.04 16.63 18.29 19.21 19.73 17.58 13.46 16.10 17.81 18.86 19.10 17.06 45.83 46.04 48.43 50.74 51.63 48.53 46.46 46.60 49.06 51.86 52.10 49.22 39.34 41.79 43.51 44.33 44.91 42.78 38.46 41.10 42.81 43.86 44.10 42.06 SEdm ± for variety CD (P = 0.05) SEdm ± for LCC CD (P = 0.05) 0.79 1.94 0.65 1.32 0.90 2.21 0.78 1.59 1.12 2.74 0.97 1.97 1.03 2.53 0.81 1.65 1.21 2.96 1.03 2.09 1.01 2.48 0.83 1.69 Copyright © 2011 SciRes. AJPS 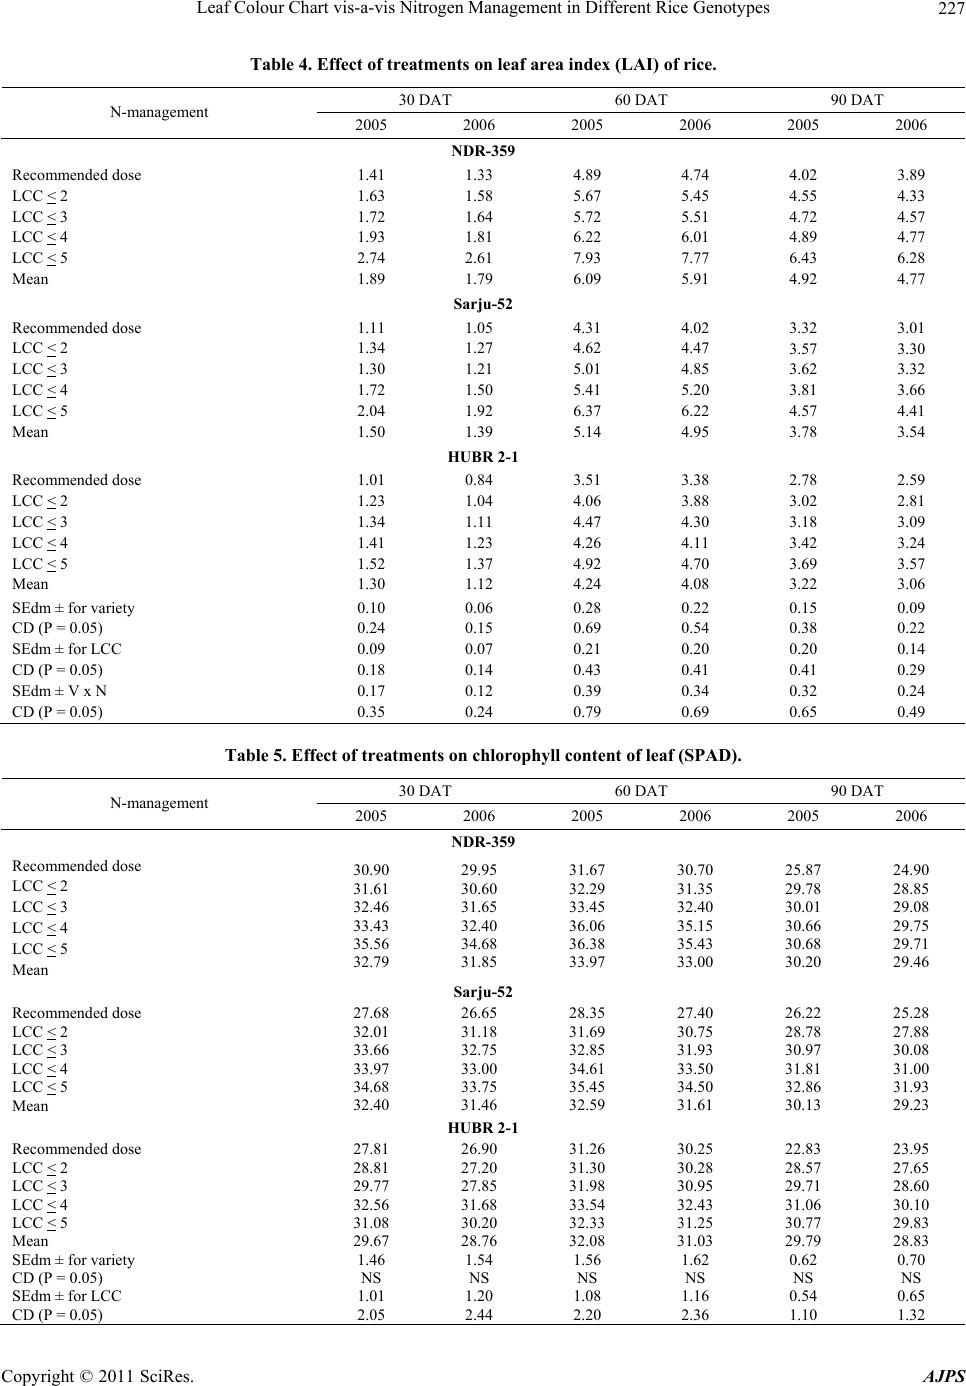 Leaf Colour Chart vis-a-vis Nitrogen Management in Different Rice Genotypes 227 Table 4. Effect of treatments on leaf area index (LAI) of rice. 30 DAT 60 DAT 90 DAT N-management 2005 2006 2005 2006 2005 2006 NDR-359 Recommended dose LCC < 2 LCC < 3 LCC < 4 LCC < 5 Mean 1.41 1.63 1.72 1.93 2.74 1.89 1.33 1.58 1.64 1.81 2.61 1.79 4.89 5.67 5.72 6.22 7.93 6.09 4.74 5.45 5.51 6.01 7.77 5.91 4.02 4.55 4.72 4.89 6.43 4.92 3.89 4.33 4.57 4.77 6.28 4.77 Sarju-52 Recommended dose LCC < 2 LCC < 3 LCC < 4 LCC < 5 Mean 1.11 1.34 1.30 1.72 2.04 1.50 1.05 1.27 1.21 1.50 1.92 1.39 4.31 4.62 5.01 5.41 6.37 5.14 4.02 4.47 4.85 5.20 6.22 4.95 3.32 3.57 3.62 3.81 4.57 3.78 3.01 3.30 3.32 3.66 4.41 3.54 HUBR 2-1 Recommended dose LCC < 2 LCC < 3 LCC < 4 LCC < 5 Mean 1.01 1.23 1.34 1.41 1.52 1.30 0.84 1.04 1.11 1.23 1.37 1.12 3.51 4.06 4.47 4.26 4.92 4.24 3.38 3.88 4.30 4.11 4.70 4.08 2.78 3.02 3.18 3.42 3.69 3.22 2.59 2.81 3.09 3.24 3.57 3.06 SEdm ± for variety CD (P = 0.05) SEdm ± for LCC CD (P = 0.05) SEdm ± V x N CD (P = 0.05) 0.10 0.24 0.09 0.18 0.17 0.35 0.06 0.15 0.07 0.14 0.12 0.24 0.28 0.69 0.21 0.43 0.39 0.79 0.22 0.54 0.20 0.41 0.34 0.69 0.15 0.38 0.20 0.41 0.32 0.65 0.09 0.22 0.14 0.29 0.24 0.49 Table 5. Effect of treatments on chlorophyll content of leaf (SPAD). 30 DAT 60 DAT 90 DAT N-management 2005 2006 2005 2006 2005 2006 NDR-359 Recommended dose LCC < 2 LCC < 3 LCC < 4 LCC < 5 Mean 30.90 31.61 32.46 33.43 35.56 32.79 29.95 30.60 31.65 32.40 34.68 31.85 31.67 32.29 33.45 36.06 36.38 33.97 30.70 31.35 32.40 35.15 35.43 33.00 25.87 29.78 30.01 30.66 30.68 30.20 24.90 28.85 29.08 29.75 29.71 29.46 Sarju-52 Recommended dose LCC < 2 LCC < 3 LCC < 4 LCC < 5 Mean 27.68 32.01 33.66 33.97 34.68 32.40 26.65 31.18 32.75 33.00 33.75 31.46 28.35 31.69 32.85 34.61 35.45 32.59 27.40 30.75 31.93 33.50 34.50 31.61 26.22 28.78 30.97 31.81 32.86 30.13 25.28 27.88 30.08 31.00 31.93 29.23 HUBR 2-1 Recommended dose LCC < 2 LCC < 3 LCC < 4 LCC < 5 Mean 27.81 28.81 29.77 32.56 31.08 29.67 26.90 27.20 27.85 31.68 30.20 28.76 31.26 31.30 31.98 33.54 32.33 32.08 30.25 30.28 30.95 32.43 31.25 31.03 22.83 28.57 29.71 31.06 30.77 29.79 23.95 27.65 28.60 30.10 29.83 28.83 SEdm ± for variety CD (P = 0.05) SEdm ± for LCC CD (P = 0.05) 1.46 NS 1.01 2.05 1.54 NS 1.20 2.44 1.56 NS 1.08 2.20 1.62 NS 1.16 2.36 0.62 NS 0.54 1.10 0.70 NS 0.65 1.32 Copyright © 2011 SciRes. AJPS 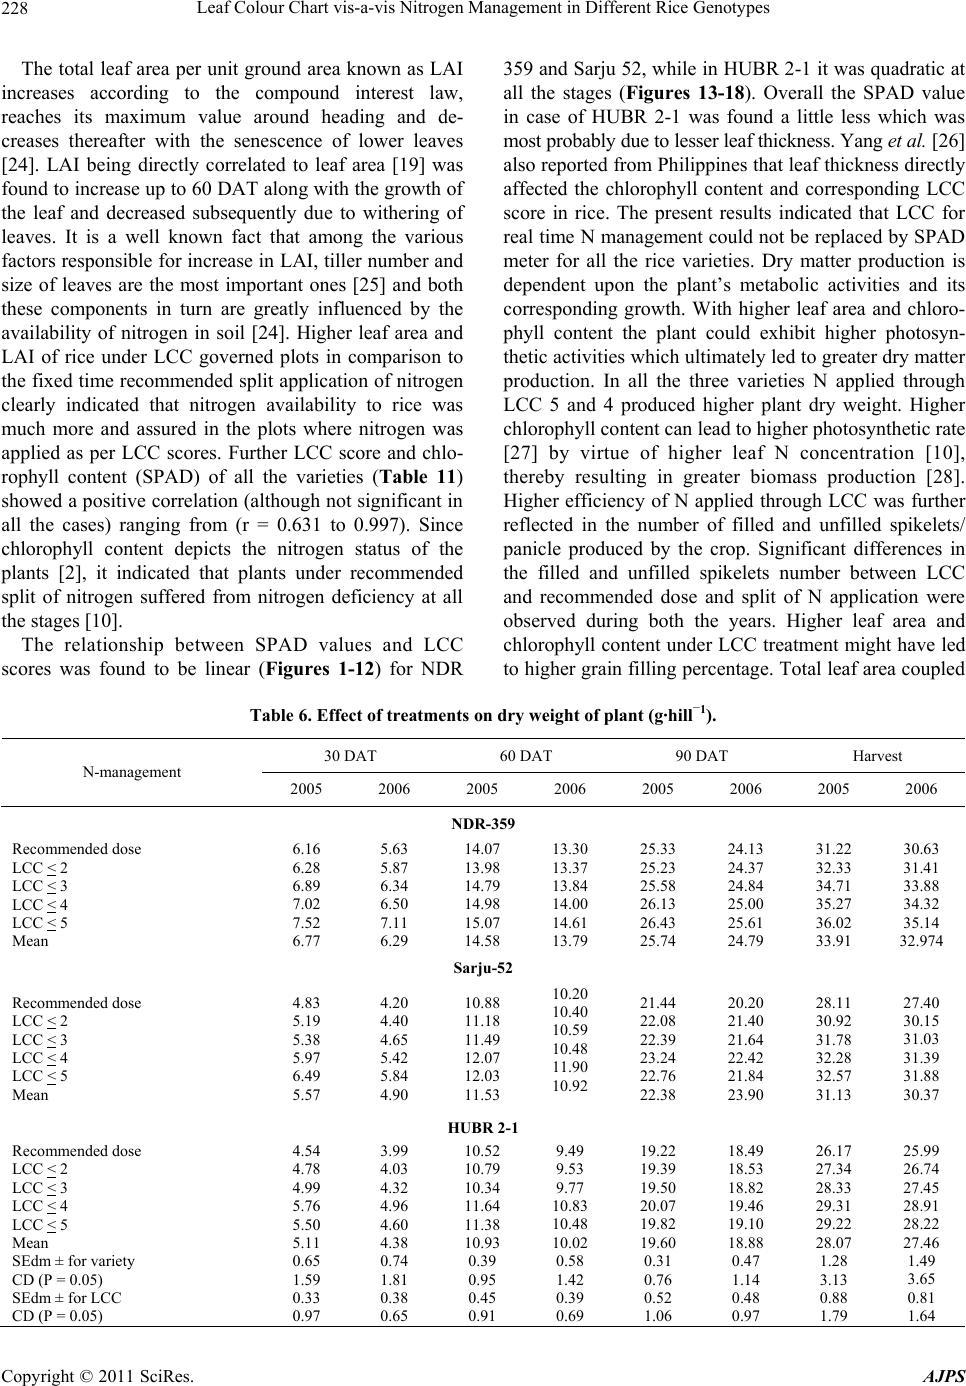 Leaf Colour Chart vis-a-vis Nitrogen Management in Different Rice Genotypes Copyright © 2011 SciRes. AJPS 228 The total leaf area per unit ground area known as LAI increases according to the compound interest law, reaches its maximum value around heading and de- creases thereafter with the senescence of lower leaves [24]. LAI being directly correlated to leaf area [19] was found to increase up to 60 DAT along with the growth of the leaf and decreased subsequently due to withering of leaves. It is a well known fact that among the various factors responsible for increase in LAI, tiller number and size of leaves are the most important ones [25] and both these components in turn are greatly influenced by the availability of nitrogen in soil [24]. Higher leaf area and LAI of rice under LCC governed plots in comparison to the fixed time recommended split application of nitrogen clearly indicated that nitrogen availability to rice was much more and assured in the plots where nitrogen was applied as per LCC scores. Further LCC score and chlo- rophyll content (SPAD) of all the varieties (Table 11) showed a positive correlation (although not significant in all the cases) ranging from (r = 0.631 to 0.997). Since chlorophyll content depicts the nitrogen status of the plants [2], it indicated that plants under recommended split of nitrogen suffered from nitrogen deficiency at all the stages [10]. The relationship between SPAD values and LCC scores was found to be linear (Figures 1-12) for NDR 359 and Sarju 52, while in HUBR 2-1 it was quadratic at all the stages (Figures 13-18). Overall the SPAD value in case of HUBR 2-1 was found a little less which was most probably due to lesser leaf thickness. Yang et al. [26] also reported from Philippines that leaf thickness directly affected the chlorophyll content and corresponding LCC score in rice. The present results indicated that LCC for real time N management could not be replaced by SPAD meter for all the rice varieties. Dry matter production is dependent upon the plant’s metabolic activities and its corresponding growth. With higher leaf area and chloro- phyll content the plant could exhibit higher photosyn- thetic activities which ultimately led to greater dry matter production. In all the three varieties N applied through LCC 5 and 4 produced higher plant dry weight. Higher chlorophyll content can lead to higher photosynthetic rate [27] by virtue of higher leaf N concentration [10], thereby resulting in greater biomass production [28]. Higher efficiency of N applied through LCC was further reflected in the number of filled and unfilled spikelets/ panicle produced by the crop. Significant differences in the filled and unfilled spikelets number between LCC and recommended dose and split of N application were observed during both the years. Higher leaf area and chlorophyll content under LCC treatment might have led to higher grain filling percentage. Total leaf area coupled Table 6. Effect of treatments on dry weight of plant (g·hill−1). 30 DAT 60 DAT 90 DAT Harvest N-management 2005 2006 2005 2006 2005 2006 2005 2006 NDR-359 Recommended dose LCC < 2 LCC < 3 LCC < 4 LCC < 5 Mean 6.16 6.28 6.89 7.02 7.52 6.77 5.63 5.87 6.34 6.50 7.11 6.29 14.07 13.98 14.79 14.98 15.07 14.58 13.30 13.37 13.84 14.00 14.61 13.79 25.33 25.23 25.58 26.13 26.43 25.74 24.13 24.37 24.84 25.00 25.61 24.79 31.22 32.33 34.71 35.27 36.02 33.91 30.63 31.41 33.88 34.32 35.14 32.974 Sarju-52 Recommended dose LCC < 2 LCC < 3 LCC < 4 LCC < 5 Mean 4.83 5.19 5.38 5.97 6.49 5.57 4.20 4.40 4.65 5.42 5.84 4.90 10.88 11.18 11.49 12.07 12.03 11.53 10.20 10.40 10.59 10.48 11.90 10.92 21.44 22.08 22.39 23.24 22.76 22.38 20.20 21.40 21.64 22.42 21.84 23.90 28.11 30.92 31.78 32.28 32.57 31.13 27.40 30.15 31.03 31.39 31.88 30.37 HUBR 2-1 Recommended dose LCC < 2 LCC < 3 LCC < 4 LCC < 5 Mean 4.54 4.78 4.99 5.76 5.50 5.11 3.99 4.03 4.32 4.96 4.60 4.38 10.52 10.79 10.34 11.64 11.38 10.93 9.49 9.53 9.77 10.83 10.48 10.02 19.22 19.39 19.50 20.07 19.82 19.60 18.49 18.53 18.82 19.46 19.10 18.88 26.17 27.34 28.33 29.31 29.22 28.07 25.99 26.74 27.45 28.91 28.22 27.46 SEdm ± for variety CD (P = 0.05) SEdm ± for LCC CD (P = 0.05) 0.65 1.59 0.33 0.97 0.74 1.81 0.38 0.65 0.39 0.95 0.45 0.91 0.58 1.42 0.39 0.69 0.31 0.76 0.52 1.06 0.47 1.14 0.48 0.97 1.28 3.13 0.88 1.79 1.49 3.65 0.81 1.64 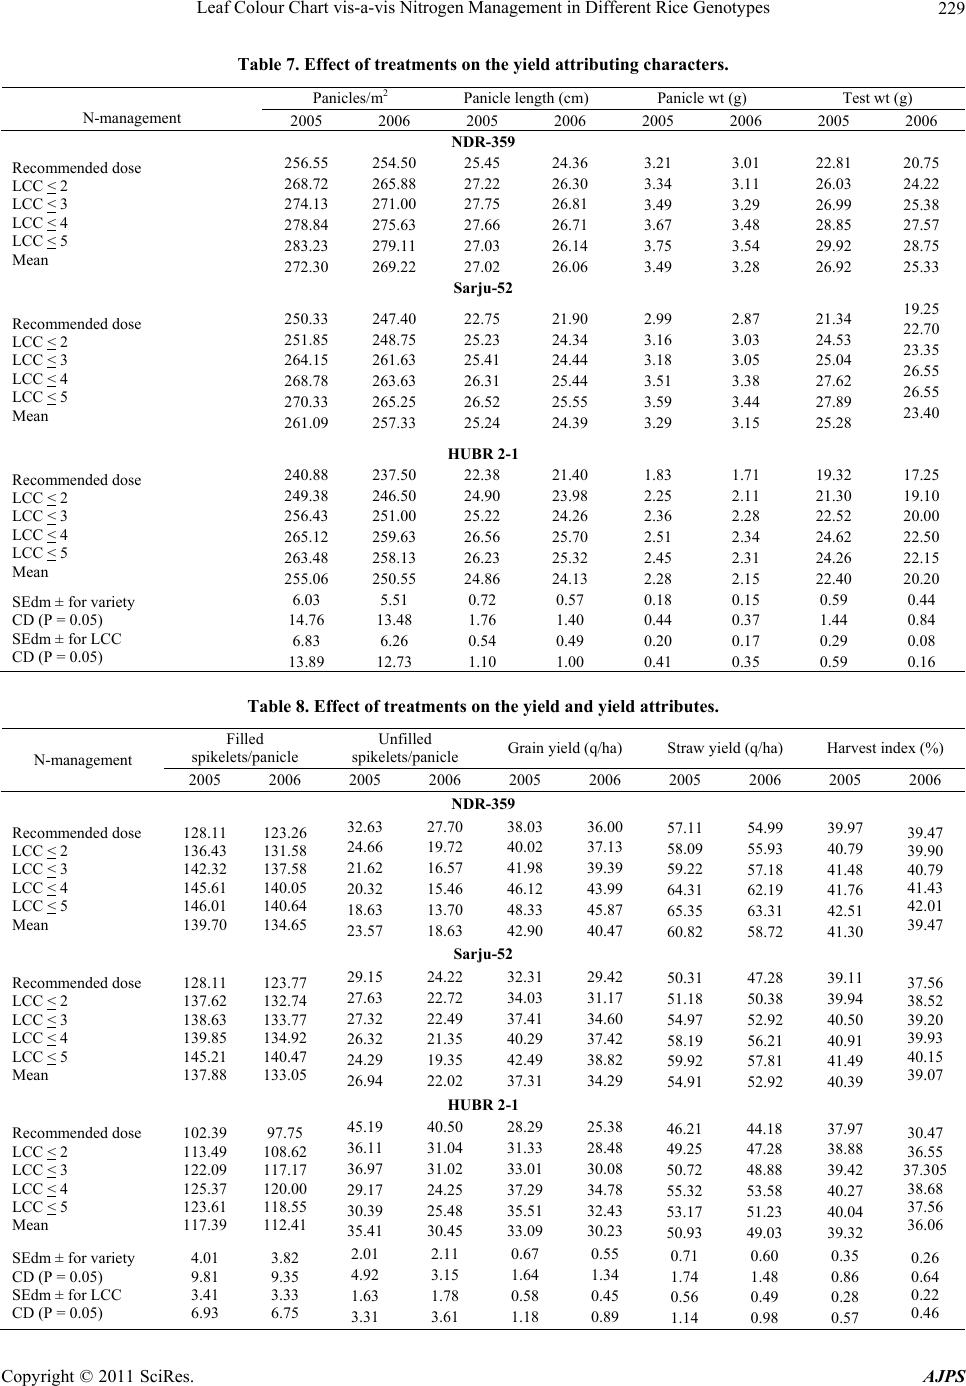 Leaf Colour Chart vis-a-vis Nitrogen Management in Different Rice Genotypes 229 Table 7. Effect of treatments on the yield attributing characters. Panicles/m2 Panicle length (cm) Panicle wt (g) Test wt (g) N-management 2005 2006 2005 2006 2005 2006 2005 2006 NDR-359 Recommended dose LCC < 2 LCC < 3 LCC < 4 LCC < 5 Mean 256.55 268.72 274.13 278.84 283.23 272.30 254.50 265.88 271.00 275.63 279.11 269.22 25.45 27.22 27.75 27.66 27.03 27.02 24.36 26.30 26.81 26.71 26.14 26.06 3.21 3.34 3.49 3.67 3.75 3.49 3.01 3.11 3.29 3.48 3.54 3.28 22.81 26.03 26.99 28.85 29.92 26.92 20.75 24.22 25.38 27.57 28.75 25.33 Sarju-52 Recommended dose LCC < 2 LCC < 3 LCC < 4 LCC < 5 Mean 250.33 251.85 264.15 268.78 270.33 261.09 247.40 248.75 261.63 263.63 265.25 257.33 22.75 25.23 25.41 26.31 26.52 25.24 21.90 24.34 24.44 25.44 25.55 24.39 2.99 3.16 3.18 3.51 3.59 3.29 2.87 3.03 3.05 3.38 3.44 3.15 21.34 24.53 25.04 27.62 27.89 25.28 19.25 22.70 23.35 26.55 26.55 23.40 HUBR 2-1 Recommended dose LCC < 2 LCC < 3 LCC < 4 LCC < 5 Mean 240.88 249.38 256.43 265.12 263.48 255.06 237.50 246.50 251.00 259.63 258.13 250.55 22.38 24.90 25.22 26.56 26.23 24.86 21.40 23.98 24.26 25.70 25.32 24.13 1.83 2.25 2.36 2.51 2.45 2.28 1.71 2.11 2.28 2.34 2.31 2.15 19.32 21.30 22.52 24.62 24.26 22.40 17.25 19.10 20.00 22.50 22.15 20.20 SEdm ± for variety CD (P = 0.05) SEdm ± for LCC CD (P = 0.05) 6.03 14.76 6.83 13.89 5.51 13.48 6.26 12.73 0.72 1.76 0.54 1.10 0.57 1.40 0.49 1.00 0.18 0.44 0.20 0.41 0.15 0.37 0.17 0.35 0.59 1.44 0.29 0.59 0.44 0.84 0.08 0.16 Table 8. Effect of treatments on the yield and yield attributes. Filled spikelets/panicle Unfilled spikelets/panicle Grain yield (q/ha) Straw yield (q/ha) Harvest index (%) N-management 2005 2006 2005 2006 2005 2006 2005 2006 2005 2006 NDR-359 Recommended dose LCC < 2 LCC < 3 LCC < 4 LCC < 5 Mean 128.11 136.43 142.32 145.61 146.01 139.70 123.26 131.58 137.58 140.05 140.64 134.65 32.63 24.66 21.62 20.32 18.63 23.57 27.70 19.72 16.57 15.46 13.70 18.63 38.03 40.02 41.98 46.12 48.33 42.90 36.00 37.13 39.39 43.99 45.87 40.47 57.11 58.09 59.22 64.31 65.35 60.82 54.99 55.93 57.18 62.19 63.31 58.72 39.97 40.79 41.48 41.76 42.51 41.30 39.47 39.90 40.79 41.43 42.01 39.47 Sarju-52 Recommended dose LCC < 2 LCC < 3 LCC < 4 LCC < 5 Mean 128.11 137.62 138.63 139.85 145.21 137.88 123.77 132.74 133.77 134.92 140.47 133.05 29.15 27.63 27.32 26.32 24.29 26.94 24.22 22.72 22.49 21.35 19.35 22.02 32.31 34.03 37.41 40.29 42.49 37.31 29.42 31.17 34.60 37.42 38.82 34.29 50.31 51.18 54.97 58.19 59.92 54.91 47.28 50.38 52.92 56.21 57.81 52.92 39.11 39.94 40.50 40.91 41.49 40.39 37.56 38.52 39.20 39.93 40.15 39.07 HUBR 2-1 Recommended dose LCC < 2 LCC < 3 LCC < 4 LCC < 5 Mean 102.39 113.49 122.09 125.37 123.61 117.39 97.75 108.62 117.17 120.00 118.55 112.41 45.19 36.11 36.97 29.17 30.39 35.41 40.50 31.04 31.02 24.25 25.48 30.45 28.29 31.33 33.01 37.29 35.51 33.09 25.38 28.48 30.08 34.78 32.43 30.23 46.21 49.25 50.72 55.32 53.17 50.93 44.18 47.28 48.88 53.58 51.23 49.03 37.97 38.88 39.42 40.27 40.04 39.32 30.47 36.55 37.305 38.68 37.56 36.06 SEdm ± for variety CD (P = 0.05) SEdm ± for LCC CD (P = 0.05) 4.01 9.81 3.41 6.93 3.82 9.35 3.33 6.75 2.01 4.92 1.63 3.31 2.11 3.15 1.78 3.61 0.67 1.64 0.58 1.18 0.55 1.34 0.45 0.89 0.71 1.74 0.56 1.14 0.60 1.48 0.49 0.98 0.35 0.86 0.28 0.57 0.26 0.64 0.22 0.46 Copyright © 2011 SciRes. AJPS 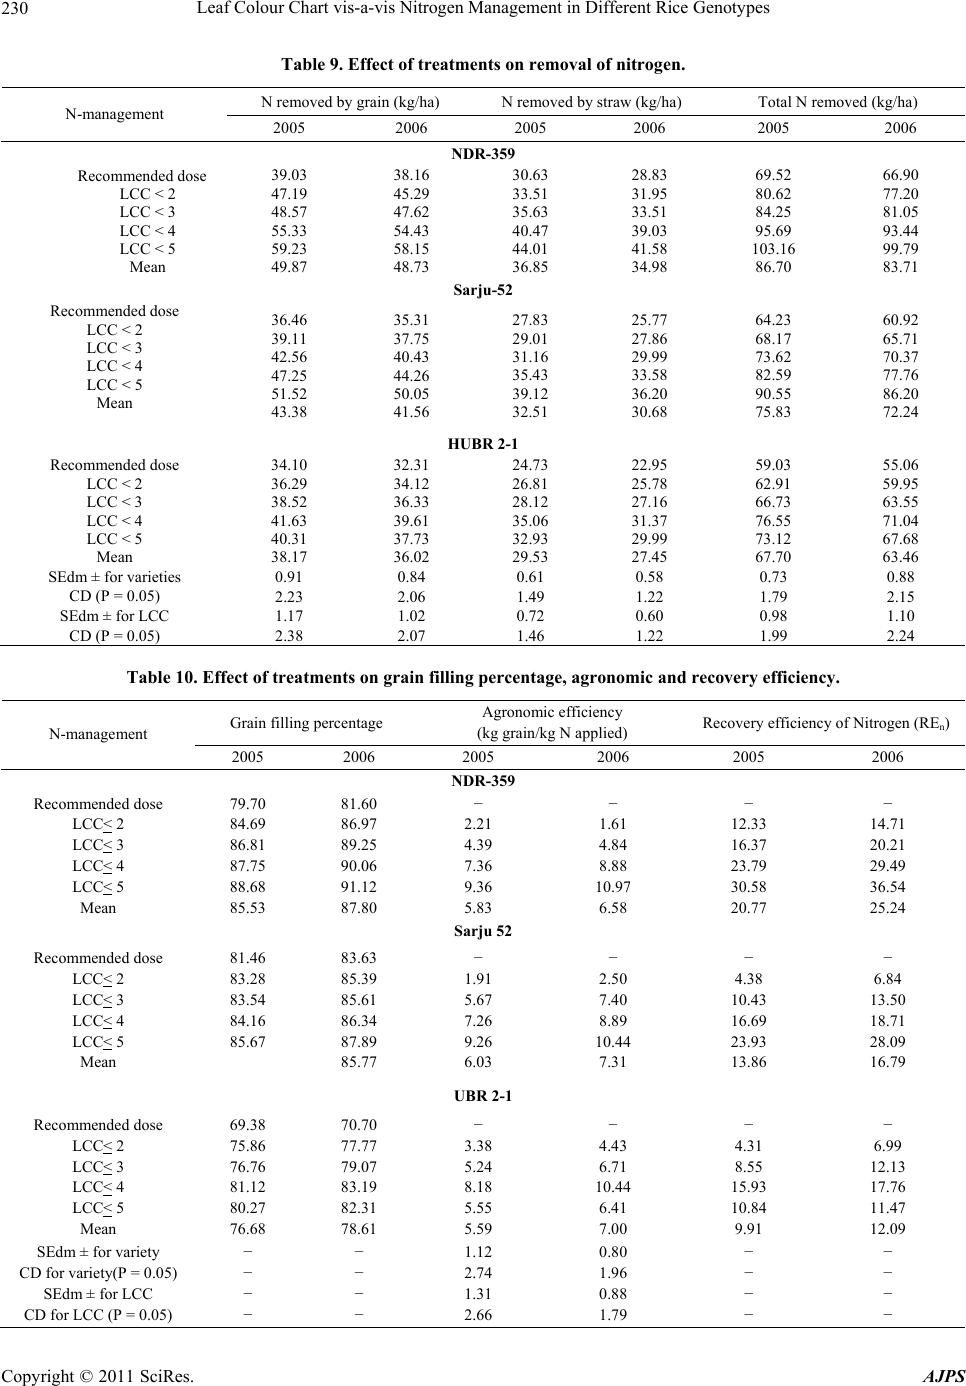 Leaf Colour Chart vis-a-vis Nitrogen Management in Different Rice Genotypes 230 Table 9. Effect of treatments on removal of nitrogen. N removed by grain (kg/ha) N removed by straw (kg/ha) Total N removed (kg/ha) N-management 2005 2006 2005 2006 2005 2006 NDR-359 Recommended dose LCC < 2 LCC < 3 LCC < 4 LCC < 5 Mean 39.03 47.19 48.57 55.33 59.23 49.87 38.16 45.29 47.62 54.43 58.15 48.73 30.63 33.51 35.63 40.47 44.01 36.85 28.83 31.95 33.51 39.03 41.58 34.98 69.52 80.62 84.25 95.69 103.16 86.70 66.90 77.20 81.05 93.44 99.79 83.71 Sarju-52 Recommended dose LCC < 2 LCC < 3 LCC < 4 LCC < 5 Mean 36.46 39.11 42.56 47.25 51.52 43.38 35.31 37.75 40.43 44.26 50.05 41.56 27.83 29.01 31.16 35.43 39.12 32.51 25.77 27.86 29.99 33.58 36.20 30.68 64.23 68.17 73.62 82.59 90.55 75.83 60.92 65.71 70.37 77.76 86.20 72.24 HUBR 2-1 Recommended dose LCC < 2 LCC < 3 LCC < 4 LCC < 5 Mean 34.10 36.29 38.52 41.63 40.31 38.17 32.31 34.12 36.33 39.61 37.73 36.02 24.73 26.81 28.12 35.06 32.93 29.53 22.95 25.78 27.16 31.37 29.99 27.45 59.03 62.91 66.73 76.55 73.12 67.70 55.06 59.95 63.55 71.04 67.68 63.46 SEdm ± for varieties CD (P = 0.05) SEdm ± for LCC CD (P = 0.05) 0.91 2.23 1.17 2.38 0.84 2.06 1.02 2.07 0.61 1.49 0.72 1.46 0.58 1.22 0.60 1.22 0.73 1.79 0.98 1.99 0.88 2.15 1.10 2.24 Table 10. Effect of treatments on grain filling percentage, agronomic and recovery efficiency. Grain filling percentage Agronomic efficiency (kg grain/kg N applied) Recovery efficiency of Nitrogen (REn) N-management 2005 2006 2005 2006 2005 2006 NDR-359 Recommended dose LCC< 2 LCC< 3 LCC< 4 LCC< 5 Mean 79.70 84.69 86.81 87.75 88.68 85.53 81.60 86.97 89.25 90.06 91.12 87.80 − 2.21 4.39 7.36 9.36 5.83 − 1.61 4.84 8.88 10.97 6.58 − 12.33 16.37 23.79 30.58 20.77 − 14.71 20.21 29.49 36.54 25.24 Sarju 52 Recommended dose LCC< 2 LCC< 3 LCC< 4 LCC< 5 Mean 81.46 83.28 83.54 84.16 85.67 83.63 85.39 85.61 86.34 87.89 85.77 − 1.91 5.67 7.26 9.26 6.03 − 2.50 7.40 8.89 10.44 7.31 − 4.38 10.43 16.69 23.93 13.86 − 6.84 13.50 18.71 28.09 16.79 UBR 2-1 Recommended dose LCC< 2 LCC< 3 LCC< 4 LCC< 5 Mean 69.38 75.86 76.76 81.12 80.27 76.68 70.70 77.77 79.07 83.19 82.31 78.61 − 3.38 5.24 8.18 5.55 5.59 − 4.43 6.71 10.44 6.41 7.00 − 4.31 8.55 15.93 10.84 9.91 − 6.99 12.13 17.76 11.47 12.09 SEdm ± for variety CD for variety(P = 0.05) SEdm ± for LCC CD for LCC (P = 0.05) − − − − − − − − 1.12 2.74 1.31 2.66 0.80 1.96 0.88 1.79 − − − − − − − − Copyright © 2011 SciRes. AJPS 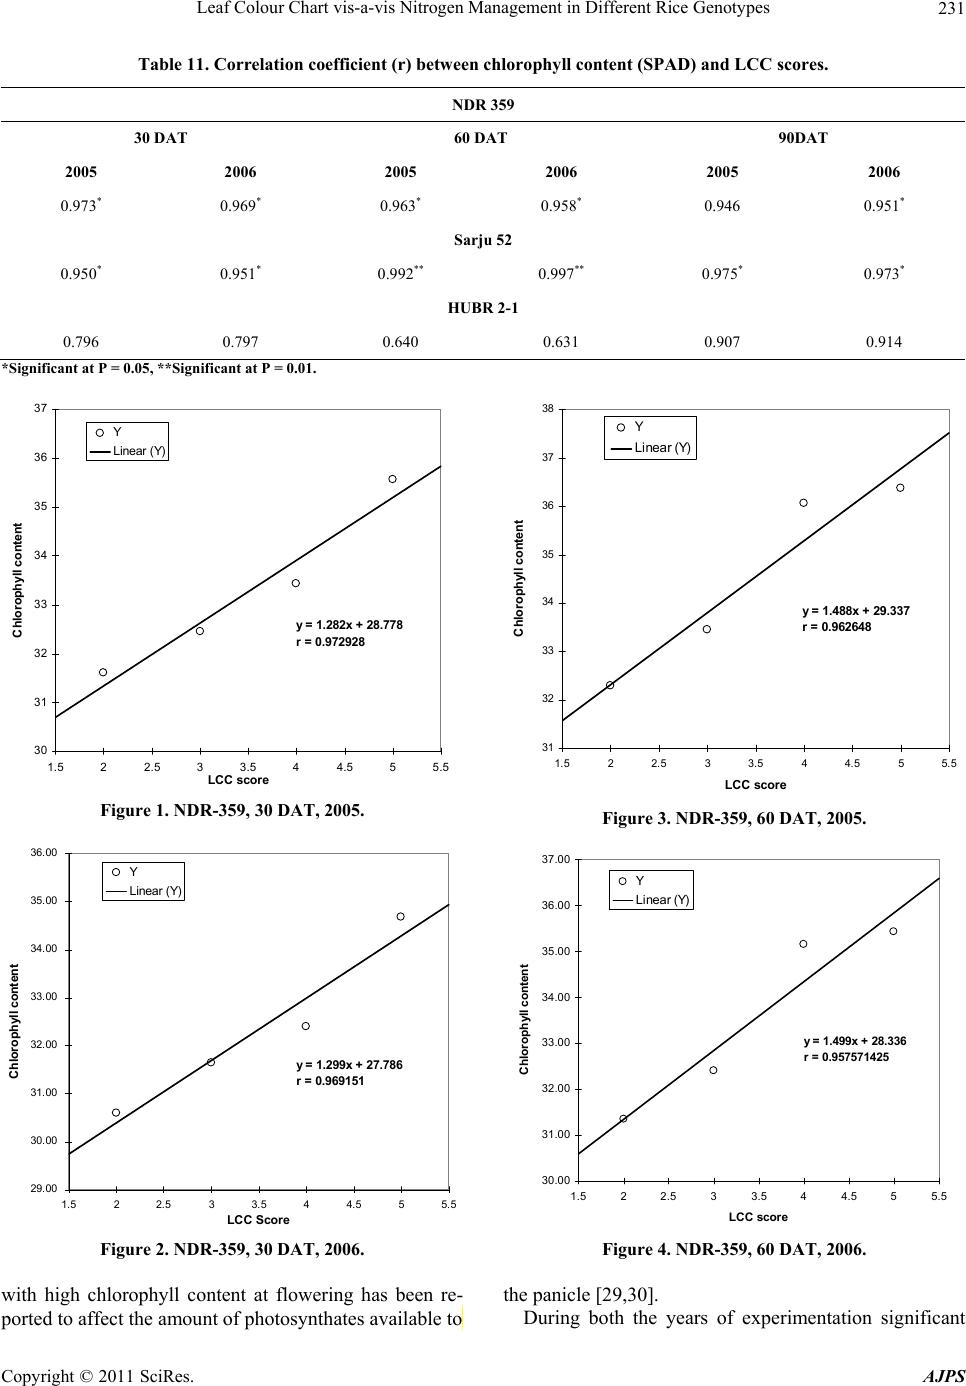 Leaf Colour Chart vis-a-vis Nitrogen Management in Different Rice Genotypes Copyright © 2011 SciRes. AJPS 231 Table 11. Correlation coefficient (r) between chlorophyll content (SPAD) and LCC scores. NDR 359 30 DAT 60 DAT 90DAT 2005 2006 2005 2006 2005 2006 0.973* 0.969* 0.963* 0.958* 0.946 0.951* Sarju 52 0.950* 0.951* 0.992** 0.997** 0.975* 0.973* HUBR 2-1 0.796 0.797 0.640 0.631 0.907 0.914 * Significant at P = 0.05, **Significant at P = 0.01. y = 1.282x + 28.778 r = 0.972928 30 31 32 33 34 35 36 37 1.522.533.544.555. LCC score Chlorophyll content 5 Y Linear (Y) y = 1.488x + 29.337 r = 0.962648 31 32 33 34 35 36 37 38 1.522.533.544.55 5.5 LCC score Chlorophyll content Y Linear ( Y) Figure 1. NDR-359, 30 DAT, 2005. Figure 3. NDR-359, 60 DAT, 2005. y = 1.299x + 27.786 r = 0.969151 29.00 30.00 31.00 32.00 33.00 34.00 35.00 36.00 1.522.5 3 3.5 44.5 5 5.5 LCC Score Chlorophyll content Y Linear (Y ) y = 1.499x + 28.336 r = 0.957571425 30.00 31.00 32.00 33.00 34.00 35.00 36.00 37.00 1.5 22.5 3 3.54 4.55 5.5 LCC score Chlorophyll content Y Linear ( Y) Figure 2. NDR-359, 30 DAT, 2006. Figure 4. NDR-359, 60 DAT, 2006. with high chlorophyll content at flowering has been re- ported to affect the amount of photosynthates available to the panicle [29,30]. During both the years of experimentation significant 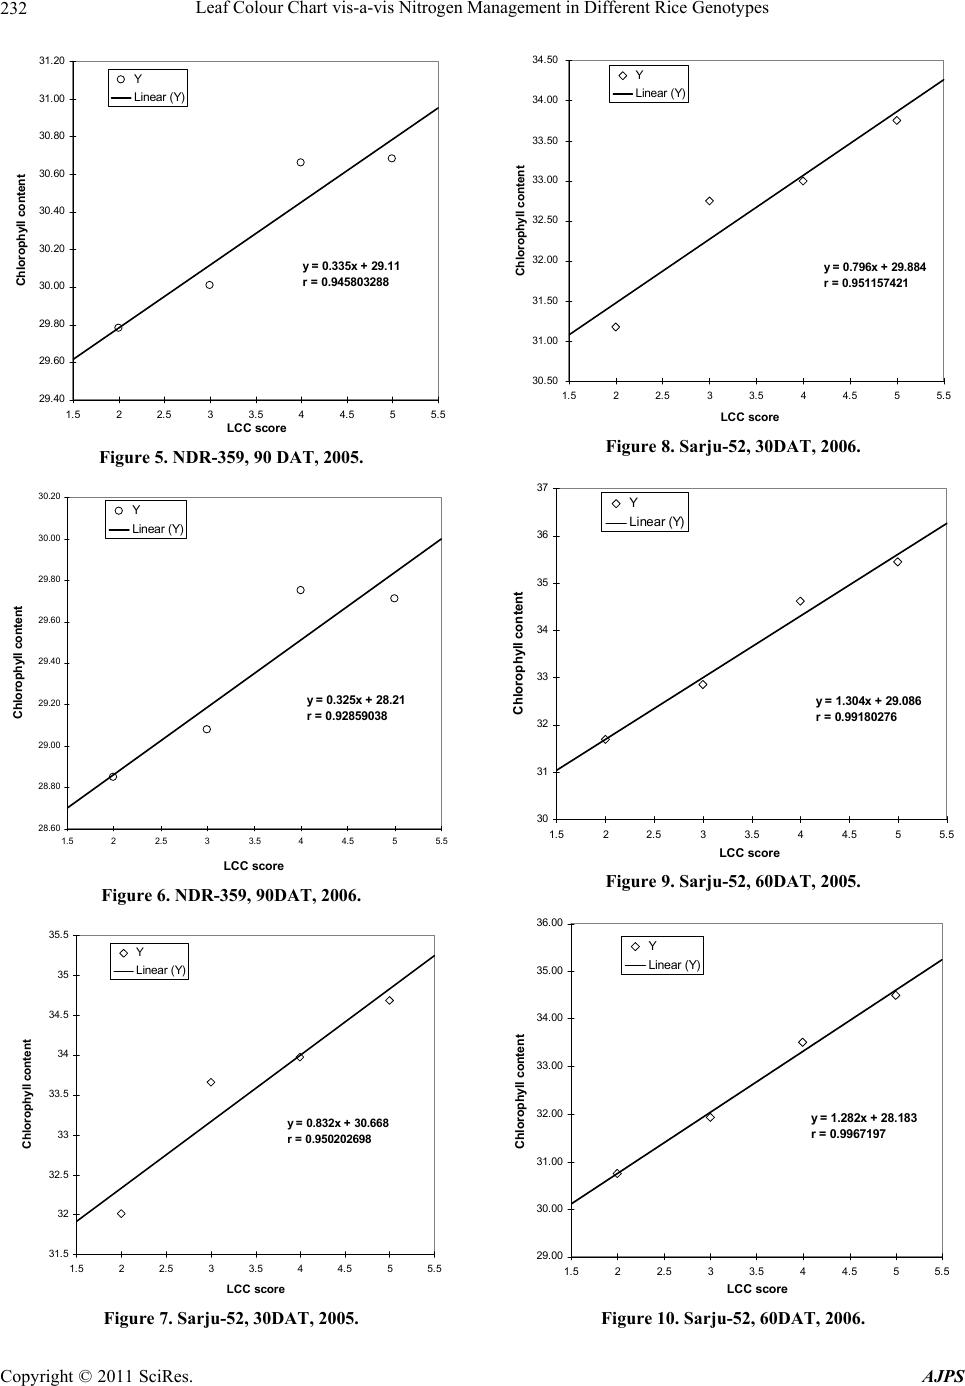 Leaf Colour Chart vis-a-vis Nitrogen Management in Different Rice Genotypes 232 y = 0.335x + 29.11 r = 0.945803288 29. 40 29. 60 29. 80 30. 00 30. 20 30. 40 30. 60 30. 80 31. 00 31. 20 1.522.533.5 4 4.5 5 5.5 LCC score Chlorophyll content Y Linear (Y) Figure 5. NDR-359, 90 DAT, 2005. y = 0.325x + 28.21 r = 0.92859038 28.60 28.80 29.00 29.20 29.40 29.60 29.80 30.00 30.20 1.5 22.5 33.5 44.55 5.5 LCC scor e Chlorophyll content Y Linear (Y ) Figure 6. NDR-359, 90DAT, 2006. y = 0.832x + 30.668 r = 0.950202698 31.5 32 32.5 33 33.5 34 34.5 35 35.5 1.52 2.53 3.5 4 4.55 5.5 LCC score Chlorophyll content Y Linear (Y) Figure 7. Sarju-52, 30DAT, 2005. y = 0.796x + 29.884 r = 0.951157421 30.50 31.00 31.50 32.00 32.50 33.00 33.50 34.00 34.50 1.522.533.544.555 LCC scor e Chlorophyll content .5 Y Linear (Y) Figure 8. Sarju-52, 30DAT, 2006. y = 1.304x + 29.086 r = 0.99180276 30 31 32 33 34 35 36 37 1.522.53 3.5 4 4.5 5 5.5 LCC score Chloroph yll content Y Linear ( Y) Figure 9. Sarju-52, 60DAT, 2005. y = 1.282x + 28.183 r = 0.9967197 29.00 30.00 31.00 32.00 33.00 34.00 35.00 36.00 1.522.5 33.5 4 4.5 55.5 LCC score Chlorophyll content Y Linear (Y ) Figure 10. Sarju-52, 60DAT, 2006. Copyright © 2011 SciRes. AJPS 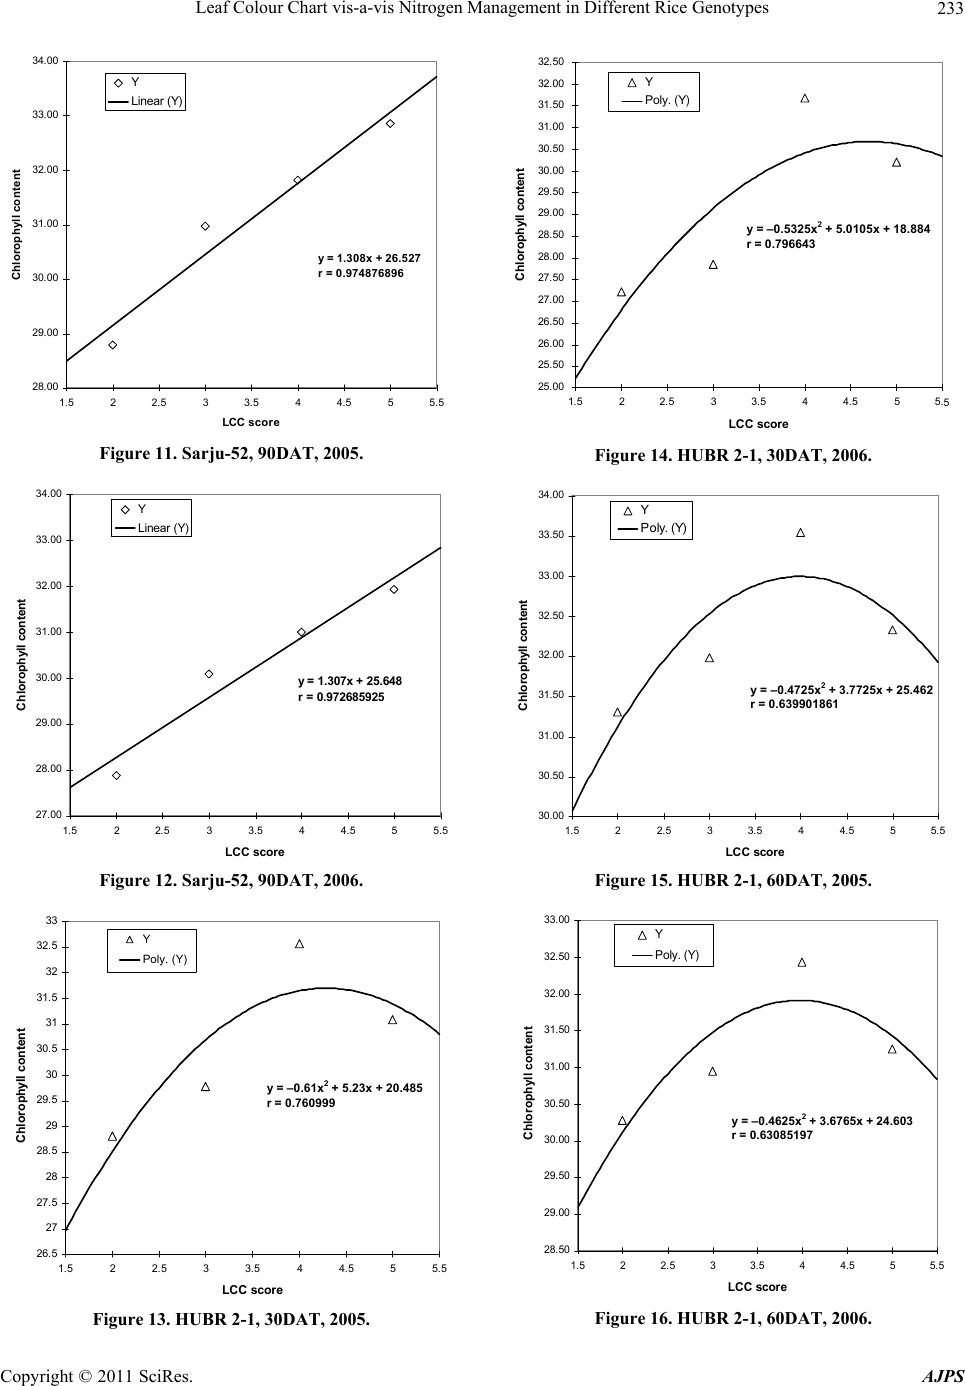 Leaf Colour Chart vis-a-vis Nitrogen Management in Different Rice Genotypes 233 y = 1.308x + 26.527 r = 0.974876896 28.00 29.00 30.00 31.00 32.00 33.00 34.00 1.522.53 3.54 4.55 5.5 LCC scor e Chlorophyll content Y Linear (Y) Figure 11. Sarju-52, 90DAT, 2005. y = 1.307x + 25.648 r = 0.972685925 27. 00 28. 00 29. 00 30. 00 31. 00 32. 00 33. 00 34. 00 1.522.53 3.5 4 4.5 5 5.5 LCC score Chlorophyll content Y Linear (Y) Figure 12. Sarju-52, 90DAT, 2006. y = -0.61x 2 + 5. 2 3x + 20. 485 r = 0. 760999 26.5 27 27.5 28 28.5 29 29.5 30 30.5 31 31.5 32 32.5 33 1.522.533.544.555 LCC score Chlorophyll content .5 Y Pol y. ( Y) y = –0.61x 2 + 5.23x + 20.485 r = 0.760999 Figure 13. HUBR 2-1, 30DAT, 2005. y = -0.5325x 2 + 5.0105x + 18.884 r = 0.796643 25.00 25.50 26.00 26.50 27.00 27.50 28.00 28.50 29.00 29.50 30.00 30.50 31.00 31.50 32.00 32.50 1.522.533.544.555. LCC score Chlorophyll content 5 Y Poly . (Y) y = –0.5325x 2 + 5.0105x + 18.884 r = 0.796643 Figure 14. HUBR 2-1, 30DAT, 2006. y = -0.4725x 2 + 3.7725x + 25.462 r = 0.639901861 30.00 30.50 31.00 31.50 32.00 32.50 33.00 33.50 34.00 1.5 22.5 3 3.5 4 4.5 55.5 LCC score Chlorophyll content Y Poly. (Y) y = –0.4725x 2 + 3.7725x + 25.462 r = 0.639901861 Figure 15. HUBR 2-1, 60DAT, 2005. y = -0.4625x 2 + 3.6765x + 24.603 r = 0.63085197 28.50 29.00 29.50 30.00 30.50 31.00 31.50 32.00 32.50 33.00 1.5 2 2.5 33.5 4 4.5 55.5 LCC score Chlorophyll conten t Y Poly . (Y) y = –0.4625x 2 + 3.6765x + 24.603 r = 0.63085197 Figure 16. HUBR 2-1, 60DAT, 2006. Copyright © 2011 SciRes. AJPS 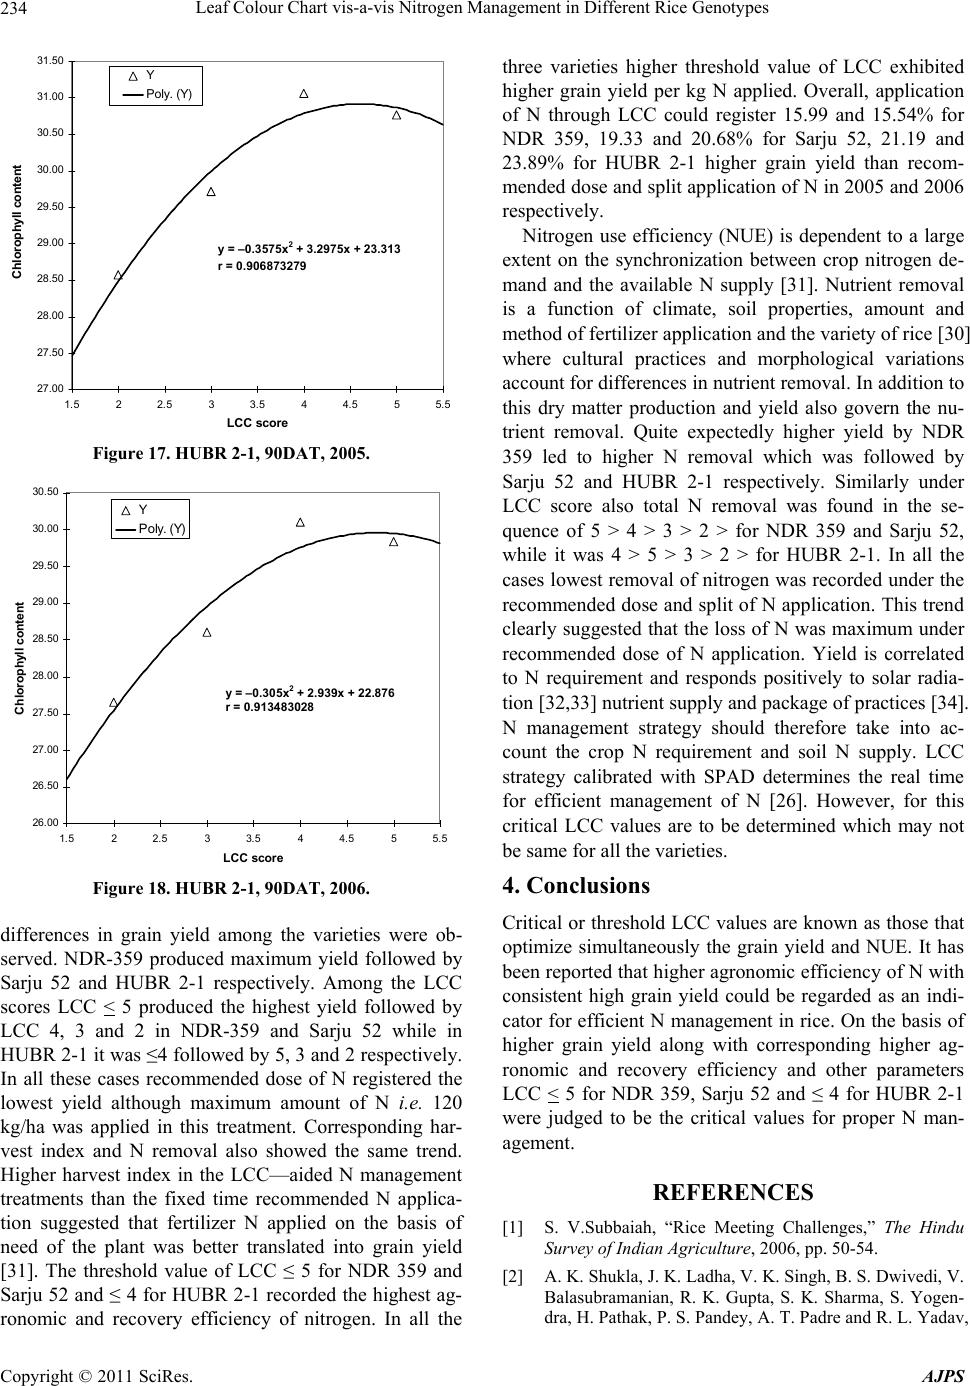 Leaf Colour Chart vis-a-vis Nitrogen Management in Different Rice Genotypes 234 y = -0.3575x 2 + 3.2975x + 23.313 r = 0.906873279 27.00 27.50 28.00 28.50 29.00 29.50 30.00 30.50 31.00 31.50 1.522.533.54 4.555.5 LCC s co r e Chlorophyll content Y Poly. (Y) y = –0.3575x 2 + 3.2975x + 23.313 r = 0.906873279 Figure 17. HUBR 2-1, 90DAT, 2005. y = -0.305x 2 + 2.939x + 22.876 r = 0.913483028 26.00 26.50 27.00 27.50 28.00 28.50 29.00 29.50 30.00 30.50 1.522.533.544.55 5.5 LCC score Chlorophyll content Y Pol y. ( Y) y = –0.305x 2 + 2.939x + 22.876 r = 0.913483028 Figure 18. HUBR 2-1, 90DAT, 2006. differences in grain yield among the varieties were ob- served. NDR-359 produced maximum yield followed by Sarju 52 and HUBR 2-1 respectively. Among the LCC scores LCC < 5 produced the highest yield followed by LCC 4, 3 and 2 in NDR-359 and Sarju 52 while in HUBR 2-1 it was ≤4 followed by 5, 3 and 2 respectively. In all these cases recommended dose of N registered the lowest yield although maximum amount of N i.e. 120 kg/ha was applied in this treatment. Corresponding har- vest index and N removal also showed the same trend. Higher harvest index in the LCC—aided N management treatments than the fixed time recommended N applica- tion suggested that fertilizer N applied on the basis of need of the plant was better translated into grain yield [31]. The threshold value of LCC ≤ 5 for NDR 359 and Sarju 52 and ≤ 4 for HUBR 2-1 recorded the highest ag- ronomic and recovery efficiency of nitrogen. In all the three varieties higher threshold value of LCC exhibited higher grain yield per kg N applied. Overall, application of N through LCC could register 15.99 and 15.54% for NDR 359, 19.33 and 20.68% for Sarju 52, 21.19 and 23.89% for HUBR 2-1 higher grain yield than recom- mended dose and split application of N in 2005 and 2006 respectively. Nitrogen use efficiency (NUE) is dependent to a large extent on the synchronization between crop nitrogen de- mand and the available N supply [31]. Nutrient removal is a function of climate, soil properties, amount and method of fertilizer application and the variety of rice [30] where cultural practices and morphological variations account for differences in nutrient removal. In addition to this dry matter production and yield also govern the nu- trient removal. Quite expectedly higher yield by NDR 359 led to higher N removal which was followed by Sarju 52 and HUBR 2-1 respectively. Similarly under LCC score also total N removal was found in the se- quence of 5 > 4 > 3 > 2 > for NDR 359 and Sarju 52, while it was 4 > 5 > 3 > 2 > for HUBR 2-1. In all the cases lowest removal of nitrogen was recorded under the recommended dose and split of N application. This trend clearly suggested that the loss of N was maximum under recommended dose of N application. Yield is correlated to N requirement and responds positively to solar radia- tion [32,33] nutrient supply and package of practices [34]. N management strategy should therefore take into ac- count the crop N requirement and soil N supply. LCC strategy calibrated with SPAD determines the real time for efficient management of N [26]. However, for this critical LCC values are to be determined which may not be same for all the varieties. 4. Conclusions Critical or threshold LCC values are known as those that optimize simultaneously the grain yield and NUE. It has been reported that higher agronomic efficiency of N with consistent high grain yield could be regarded as an indi- cator for efficient N management in rice. On the basis of higher grain yield along with corresponding higher ag- ronomic and recovery efficiency and other parameters LCC < 5 for NDR 359, Sarju 52 and ≤ 4 for HUBR 2-1 were judged to be the critical values for proper N man- agement. REFERENCES [1] S. V.Subbaiah, “Rice Meeting Challenges,” The Hindu Survey of Indian Agriculture, 2006, pp. 50-54. [2] A. K. Shukla, J. K. Ladha, V. K. Singh, B. S. Dwivedi, V. Balasubramanian, R. K. Gupta, S. K. Sharma, S. Yogen- dra, H. Pathak, P. S. Pandey, A. T. Padre and R. L. Yadav, Copyright © 2011 SciRes. AJPS  Leaf Colour Chart vis-a-vis Nitrogen Management in Different Rice Genotypes 235 “Calibrating the Leaf Color Chart for Nitrogen Manage- ment in Different Genotypes of Rice and Wheat in a Sys- tems Perspective,” Agronomy Journal, Vol. 96, No. 6, 2004, pp. 1606-1621. doi:10.2134/agronj2004.1606 [3] T. J. Krupnik, J. Six, J. K. Ladha, M. J. Paine and C. van Kessel, “An Assessment of Fertilizer Nitrogen Recovery Efficiency by Grain Crops,” In: A. R. Mosier et al., Eds., Agriculture and the Nitrogen Cycle: Assessing the Im- pacts of Fertilizer Use on Food Production and the En- vironment, Scientific Committee on Problems of the En- vironment (SCOPE), Paris, 2004. [4] R. L. Yadav, A. T. Padre, P. S. Pandey and S. K. Sharma, “Calibrating the Leaf Color Chart for Nitrogen Manage- ment in Different Genotypes of Rice and Wheat in a Sys- tem,” Agronomy Journal, Vol. 98, 2004, pp. 1606-1621. [5] K. G. Pillai and D. K. Kundu, “Fertilizer Management in Rice,” In: H. L. S. Tandon, Ed., Fertilizer Management in Food Crops, Fertilizer Development and Consultation Organization, New Delhi, 1993, pp. 1-26. [6] J. K. Ladha, K. S. Fischer, M. Hossain, P. R. Hobbs and B. Hardy, Eds., “Improving the Productivity and Sus- tainability of Rice-Wheat Systems of the Indo-Gangetic Plains,” A Synthesis of NARS-IRRI Partnership Research Discussion Paper 40, IRRI, Los Banos, 2000. [7] S. Bijay, S. Yadvinder, J. K. Ladha, K. F. Bronson, V. Balasubramanian, S. Jagdeep and C. S. Khind, “Chloro- phyll Meter and Leaf Color Chart-Based Nitrogen Man- agement for Rice and Wheat in Northwestern India,” Agronomy Journal, Vol. 94, No. 4, 2002, pp. 821-829. doi:10.2134/agronj2002.0821 [8] F. Hussain, K. F. Bronson, S. Yadvinder, S. Bijay and S. Peng, “Use of Well—Fertilized Reference Plots for Chlorophyll-Meter Based Nitrogen Management in Irri- gated Rice,” Agronomy Journal, Vol. 92, 2000, pp. 875-879. [9] L. M. Dwyer, M. Tollenaar and L. Houwing, “A Non- Destructive Method to Monitor Leaf Greenness in Corn,” Canadian Journal of Plant Science, Vol. 71, 1991, pp. 505-509. doi:10.4141/cjps91-070 [10] T. M. Blackmer and J. S. Schepers, “Techniques for Monitoring Crop Nitrogen Status in Corn,” Communica- tions in Soil Science and Plant Analysis, Vol. 25, No. 9-10, 1994, pp. 1791-1800. doi:10.1080/00103629409369153 [11] R. H. Follet, R. F. Follet and A. D. Halvorson, “Use of a Chlorophyll Meter to Evaluate the Nitrogen Status of Dryland Winter Wheat,” Communications in Soil Science and Plant Analysis, Vol. 23, No. 7-8, 1992, pp. 687-697. doi:10.1080/00103629209368619 [12] M. N. Budhar, “Leaf Colour Chart with Nitrogen Man- agement in Direct Seeded Puddled Rice (Oryza Sativa L),” Fertilizer News, Vol. 50, No. 3, 2005, pp. 41-44. [13] M. M. Alam, J. K. Ladha, K. S. Rahaman, H. R. Foyjun- nessa, A. H. Khan and R. J. Buresh, “Leaf Color Chart for Managing Nitrogen Fertilizer in Lowland Rice in Bang- ladesh,” Agronomy Journal, Vol. 97, No. 3, 2005, pp. 949-959.doi:10.2134/agronj2004.0206 [14] M. M. Alam, M. A. A. Sikder, M. S. Islam, V. Kumar and J. K. Ladha, “Integrated Crop Management: A Potential Agronomic Technique for Increased Productivity and Profit of Rice Cultivation in Bangladesh,” 4th World Congress on Conservation Agriculture, Abstracts, New Delhi, 4-7 February 2009, p. 106. [15] E. M. E. Baksh, O. Erenstein and S. L. G. Page, “Liveli- hood Improvement through Resource Conserving Tech- nologies in the Lower Gangetic Plains of Northern Bang- ladesh,” 4th World Congress on Conservation Agriculture, Abstracts, New Delhi, 4-7 February 2009, p. 457. [16] V. Balasubramanian, J. K. Ladha, R. K. Gupta, R. K. Naresh, R. S. Mehla, S. Bijay and S. Yadvinder, “Tech- nology Options for Rice in Rice-Wheat System in South Asia,” In: J. K. Ladha, J. E. Hill, J. M. Duxbury, R. K. Gupta and R. J. Buresh, Eds., Improving the Productivity and Sustainability of Rice-Wheat Systems: Issues and Impact, ASA, Special Publication 65, Madison, 2003, pp. 115-147. [17] S. Peng, F. V. Garcia, R. C. Laza, A. L. Sanico, R. M. Visperas and K. G. Cassman, “Increased Nitrogen Use Efficiency Using a Chlorophyll Meter in High-Yielding Irrigated Rice,” Field Crops Research, Vol. 47, No. 2-3, 1996, pp. 243-252. doi:10.1016/0378-4290(96)00018-4 [18] V. Balasubramanian, A. C. Morales, R. T. Cruz and S. Abdulrachman, “On-Farm Adaption of Knowledge Inten- sive Nitrogen Management Technologies for Rice Sys- tem,” Nutrient Cycling Agroecosystem, Vol. 53, No. 1, 1999, pp. 59-69. doi:10.1023/A:1009744605920 [19] K. A. Gomez, “Techniques for Field Experiments with Rice,” International Rice Research Institute, Los Banos, 1972. [20] J. M. Bremner and C. S. Mulvaney, “Nirogen—Total,” In: A. L. Page, et al., Eds., Methods of Soil Analysis, Part 2, 2nd Edition, Agronomy Monograph 9, ASA and SSSA, Madison, 1982. pp. 595-624 [21] K. G. Cassman, S. Peng, D. C. Olk, J. K. Ladha, W. Reichardt, A. Dobermann and U. Singh, “Opportunities for Increased Nitrogen Use Efficiency from Improved Resources Management in Irrigated Lowland Rice Sys- tems,” Field Crops Research, Vol. 56, No. 1-2, 1998, pp. 7-38. doi:10.1016/S0378-4290(97)00140-8 [22] R. K. Rattan and N. N. Goswami, “Essential Nutrients and Their Uptake by Plants,” In: G. S. Sekhon, P. K. Chhonkar, D. K. Das, N. N. Goswami, G. Narayanasamy, S. R. Poonia, R. K. Rattan and J. L. Sehgal, Eds., Fun- damentals of Soil Science, Indian Society of Soil Science, New Delhi, 2002, pp. 309-332. [23] K. A. Gomez and A. A. Gomez, “Statistical Procedure for Agricultural Research,” John Wiley and Sons, New York, 1984, pp. 139-153. [24] Y. Murata and S. Matsushima, “Rice,” In: L. T. Evans, Ed., Crop Physiology, Some Case Histories, Cambridge University Press, London, 1978, pp. 73-99. [25] A. Tanaka, S. A. Navasero, C. V. Garcia, F. T. Parao and E. Ramirez, “Growth Habit of the Rice Plant in the Trop- ics and Its Effect on Nitrogen Response,” IRRI Technical Copyright © 2011 SciRes. AJPS  Leaf Colour Chart vis-a-vis Nitrogen Management in Different Rice Genotypes Copyright © 2011 SciRes. AJPS 236 Bulletin, Vol. 3, 1964, pp. 1-80. [26] W. H. Yang, S. Peng, J. Huang, A. L. Sanico, R. J. Bu- resh and C. Witt, “Using Leaf Color Charts to Estimate Leaf Nitrogen Status of Rice,” Agronomy Journal, Vol. 95, 2003, pp. 212-217. [27] S. Peng, K. G. Cassman and M. J. Kropff, “Relationship between Leaf Photosynthesis and Nitrogen Content of Field Grown Rice in the Tropics,” Crop Science, Vol. 35, No. 6, 1995, pp. 1627-1630. doi:10.2135/cropsci1995.0011183X003500060018x [28] M. J. Kropff, K. G. Cassman, H. H. van Laar and S. Peng, “Nitrogen and Yield Potential of Irrigated Rice,” Plant and Soil, Vol. 155/156, No. 1, 1993, pp. 391-394. doi:10.1007/BF00025065 [29] S. Yoshida and S. B. Ahn, “The Accumulation Process of Carbohydrate in Rice Varieties in Relation to Their Re- sponse to Nitrogen in the Tropics,” Soil Science and Plant Nutrition (Tokyo), Vol. 14, 1968, pp. 153-161. [30] S. K. De Datta, “Principles and Practices of Rice Produc- tion,” John Wiley & Sons, New York, 1981, pp. 360-361. [31] S. Bijay, R. K. Gupta, S. Yadvinder, S. K. Gupta, S. Jag- deep, J. S. Bains and M. Vashishta, “Need-Based Nitro- gen Management Using Leaf Color Chart in Wet Di- rect-Seeded Rice in Northwestern,” Indian Journal of New Seeds, Vol. 8, No. 1, 2006, pp. 35-47. doi:10.1300/J153v08n01_03 [32] S. K. De Datta and P. M. Zarate, “Environmental Condi- tions Affecting Growth Characteristics, Nitrogen Re- sponse and Grain Yield of Tropical Rice,” Biometeorol- ogy, Vol. 4, 1970, pp. 71-89. [33] International Rice Research Institute, “Climatic Influence on Yield,” Annual Report for 1973, IRRI, Los Banos, 1974. [34] T. Y. Reddy and G. H. S. Reddi, “Principles of Agron- omy,” 2nd Edition, Kalyani Publishers, Ludhiana, 1995, p. 72.
|