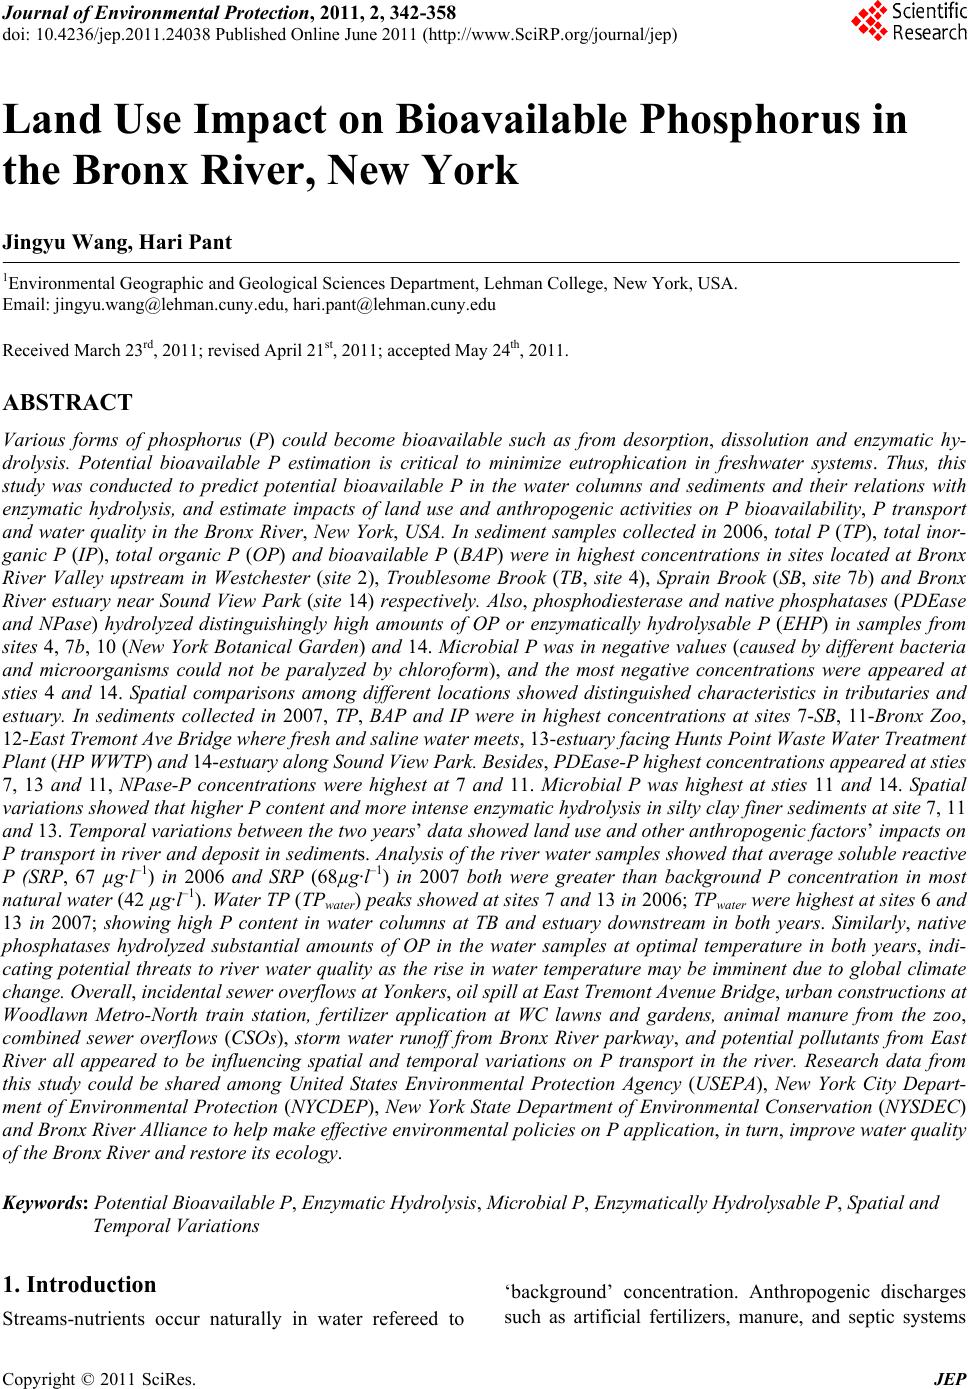
 Journal of Environmental Protection, 2011, 2, 342-358 doi: 10.4236/jep.2011.24038 Published Online June 2011 (http://www.SciRP.org/journal/jep) Copyright © 2011 SciRes. JEP Land Use Impact on Bioavailable Phosphorus in the Bronx River, New York Jingyu Wang, Hari Pant 1Environmental Geographic and Geological Sciences Department, Lehman College, New York, USA. Email: jingyu.wang@lehman.cuny.edu, hari.pant@lehman.cuny.edu Received March 23rd, 2011; revised April 21st, 2011; accepted May 24th, 2011. ABSTRACT Various forms of phosphorus (P) could become bioavailable such as from desorption, dissolution and enzymatic hy- drolysis. Potential bioavailable P estimation is critical to minimize eutrophication in freshwater systems. Thus, this study was conducted to predict potential bioavailable P in the water columns and sediments and their relations with enzymatic hydrolysis, and estimate impacts of land use and anthropogenic activities on P bioavailability, P transport and water quality in the Bronx River, New York, USA. In sediment samples collected in 2006, total P (TP), total inor- ganic P (IP), total organic P (OP) and bioavailable P (BAP) were in highest concentrations in sites located at Bronx River Valley upstream in Westchester (site 2), Troublesome Brook (TB, site 4), Sprain Brook (SB, site 7b) and Bronx River estuary near Sound View Park (site 14) respectively. Also, phosphodiesterase and native phosphatases (PDEase and NPase) hydrolyzed distinguishingly high amounts of OP or enzymatically hydrolysable P (EHP) in samples from sites 4, 7b, 10 (New York Botanical Garden) and 14. Microbial P was in negative values (caused by different bacteria and microorganisms could not be paralyzed by chloroform), and the most negative concentrations were appeared at sties 4 and 14. Spatial comparisons among different locations showed distinguished characteristics in tributaries and estuary. In sediments collected in 2007, TP, BAP and IP were in highest concentrations at sites 7-SB, 11-Bronx Zoo, 12-East Tremont Ave Bridge where fresh and saline water meets, 13-estuary facing Hunts Point Waste Water Treatment Plant (HP WWTP) and 14-estuary along Sound View Park. Besides, PDEase-P highest c o ncent r at i o ns a pp e ar e d at sti es 7, 13 and 11, NPase-P concentrations were highest at 7 and 11. Microbial P was highest at sties 11 and 14. Spatial variations showed that high er P content and more intense en zymatic hydrolysis in silty clay fin er sediments at site 7, 11 and 13. Temporal variations between the two years’ data showed land use and other anthropogenic factors’ impacts on P transport in river and deposit in sediments. Analysis of the river water samples showed that average solub le reactive P (SRP, 67 µg·l–1) in 2006 and SRP (68µg·l–1) in 2007 both were greater than background P concentration in most natural water (42 µg·l–1). Wate r T P (TPwater) peaks showed at sites 7 and 13 in 2006; TPwater were highest at sites 6 and 13 in 2007; showing high P content in water columns at TB and estuary downstream in both years. Similarly, native phosphatases hydrolyzed substantial amounts of OP in the water samples at optimal temperature in both years, indi- cating potential threats to river water quality as the rise in water temperature may be imminent due to global climate change. Overall, incidental sewer overflows at Yonkers, oil spill at East Tremont Avenue Bridge, urban constructions at Woodlawn Metro-North train station, fertilizer application at WC lawns and gardens, animal manure from the zoo, combined sewer overflows (CSOs), storm water runoff from Bronx River parkway, and potential pollutants from East River all appeared to be influencing spatial and temporal variations on P transport in the river. Research data from this study could be shared among United States Environmental Protection Agency (USEPA), New York City Depart- ment of Environmental Protection (NYCDEP), New York State Department of Environmental Conservation (NYSDEC) and Bronx River Alliance to help make effective enviro nmenta l policies on P app lication, in turn, improve wa ter quality of the Bronx River and restore its ecology. Keywords: Potential Bioavailable P, Enzymatic Hydrolysis, Microbial P, Enzymatical l y Hy drolysable P , Sp at ial and Temporal Variations 1. Introduction Streams-nutrients occur naturally in water refereed to ‘background’ concentration. Anthropogenic discharges such as artificial fertilizers, manure, and septic systems 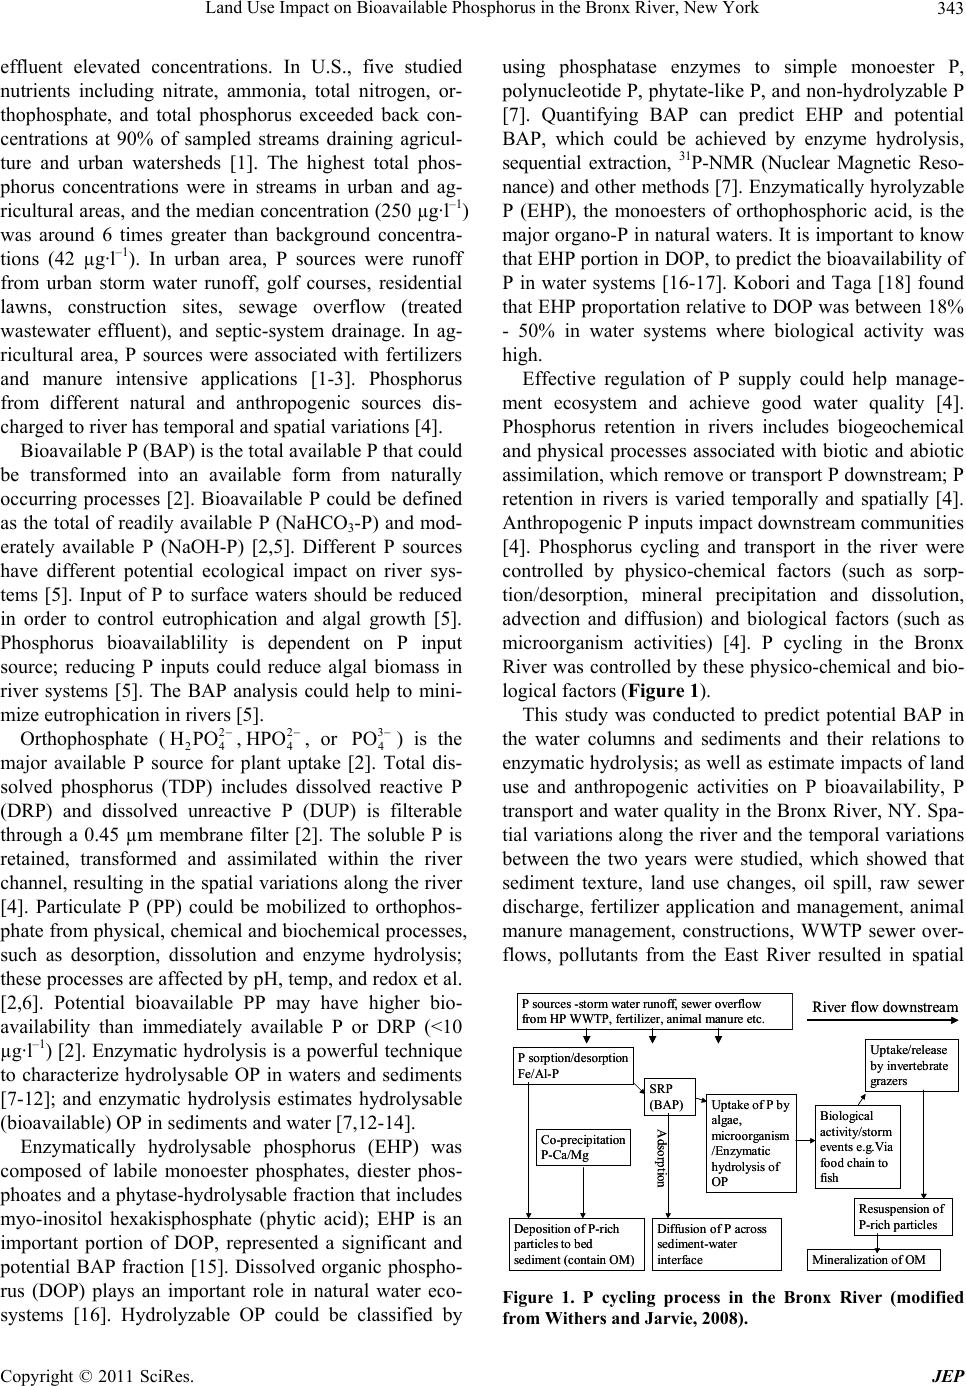 Land Use Impact on Bioavailable Phosphorus in the Bronx River, New York343 effluent elevated concentrations. In U.S., five studied nutrients including nitrate, ammonia, total nitrogen, or- thophosphate, and total phosphorus exceeded back con- centrations at 90% of sampled streams draining agricul- ture and urban watersheds [1]. The highest total phos- phorus concentrations were in streams in urban and ag- ricultural areas, and the median concentration (250 µg·l–1) was around 6 times greater than background concentra- tions (42 µg·l–1). In urban area, P sources were runoff from urban storm water runoff, golf courses, residential lawns, construction sites, sewage overflow (treated wastewater effluent), and septic-system drainage. In ag- ricultural area, P sources were associated with fertilizers and manure intensive applications [1-3]. Phosphorus from different natural and anthropogenic sources dis- charged to river has temporal and spatial variations [4]. Bioavailable P (BAP) is the total available P that could be transformed into an available form from naturally occurring processes [2]. Bioavailable P could be defined as the total of readily available P (NaHCO3-P) and mod- erately available P (NaOH-P) [2,5]. Different P sources have different potential ecological impact on river sys- tems [5]. Input of P to surface waters should be reduced in order to control eutrophication and algal growth [5]. Phosphorus bioavailablility is dependent on P input source; reducing P inputs could reduce algal biomass in river systems [5]. The BAP analysis could help to mini- mize eutrophication in rivers [5]. Orthophosphate (,, or 2 24 HPO2 4 HPO 3 4 PO ) is the major available P source for plant uptake [2]. Total dis- solved phosphorus (TDP) includes dissolved reactive P (DRP) and dissolved unreactive P (DUP) is filterable through a 0.45 µm membrane filter [2]. The soluble P is retained, transformed and assimilated within the river channel, resulting in the spatial variations along the river [4]. Particulate P (PP) could be mobilized to orthophos- phate from physical, chemical and biochemical processes, such as desorption, dissolution and enzyme hydrolysis; these processes are affected by pH, temp, and redox et al. [2,6]. Potential bioavailable PP may have higher bio- availability than immediately available P or DRP (<10 µg·l–1) [2]. Enzymatic hydrolysis is a powerful technique to characterize hydrolysable OP in waters and sediments [7-12]; and enzymatic hydrolysis estimates hydrolysable (bioavailable) OP in sediments and water [7,12-14]. Enzymatically hydrolysable phosphorus (EHP) was composed of labile monoester phosphates, diester phos- phoates and a phytase-hydrolysable fraction that includes myo-inositol hexakisphosphate (phytic acid); EHP is an important portion of DOP, represented a significant and potential BAP fraction [15]. Dissolved organic phospho- rus (DOP) plays an important role in natural water eco- systems [16]. Hydrolyzable OP could be classified by using phosphatase enzymes to simple monoester P, polynucleotide P, phytate-like P, and non-hydrolyzable P [7]. Quantifying BAP can predict EHP and potential BAP, which could be achieved by enzyme hydrolysis, sequential extraction, 31P-NMR (Nuclear Magnetic Reso- nance) and other methods [7]. Enzymatically hyrolyzable P (EHP), the monoesters of orthophosphoric acid, is the major organo-P in natural waters. It is important to know that EHP portion in DOP, to predict the bioavailability of P in water systems [16-17]. Kobori and Taga [18] found that EHP proportation relative to DOP was between 18% - 50% in water systems where biological activity was high. Effective regulation of P supply could help manage- ment ecosystem and achieve good water quality [4]. Phosphorus retention in rivers includes biogeochemical and physical processes associated with biotic and abiotic assimilation, which remove or transport P downstream; P retention in rivers is varied temporally and spatially [4]. Anthropogenic P inputs impact downstream communities [4]. Phosphorus cycling and transport in the river were controlled by physico-chemical factors (such as sorp- tion/desorption, mineral precipitation and dissolution, advection and diffusion) and biological factors (such as microorganism activities) [4]. P cycling in the Bronx River was controlled by these physico-chemical and bio- logical factors (Figure 1). This study was conducted to predict potential BAP in the water columns and sediments and their relations to enzymatic hydrolysis; as well as estimate impacts of land use and anthropogenic activities on P bioavailability, P transport and water quality in the Bronx River, NY. Spa- tial variations along the river and the temporal variations between the two years were studied, which showed that sediment texture, land use changes, oil spill, raw sewer discharge, fertilizer application and management, animal manure management, constructions, WWTP sewer over- flows, pollutants from the East River resulted in spatial P sorption/desorption Fe/Al-P SRP (BAP) Uptake of P by algae, microorganism /Enzymatic hydrolysis of OP Diffusion of P across sediment-water interface Co-precipitation P-Ca/Mg Deposition of P-rich particles to bed sediment (contain OM) Biological activity/storm events e.g.Via food chain to fish Resuspension of P-rich particles Mineralizationof OM Uptake/release by invertebrate grazers P sources -storm water runoff, sewer overflow from HP WWTP, fertilizer, animal manure etc. Adsorption River flow downstream P sorption/desorption Fe/Al-P SRP (BAP) Uptake of P by algae, microorganism /Enzymatic hydrolysis of OP Diffusion of P across sediment-water interface Co-precipitation P-Ca/Mg Deposition of P-rich particles to bed sediment (contain OM) Biological activity/storm events e.g.Via food chain to fish Resuspension of P-rich particles Mineralizationof OM Uptake/release by invertebrate grazers P sources -storm water runoff, sewer overflow from HP WWTP, fertilizer, animal manure etc. Adsorption River flow downstream Figure 1. P cycling process in the Bronx River (modified from Withers and Jarvie, 2008). Copyright © 2011 SciRes. JEP 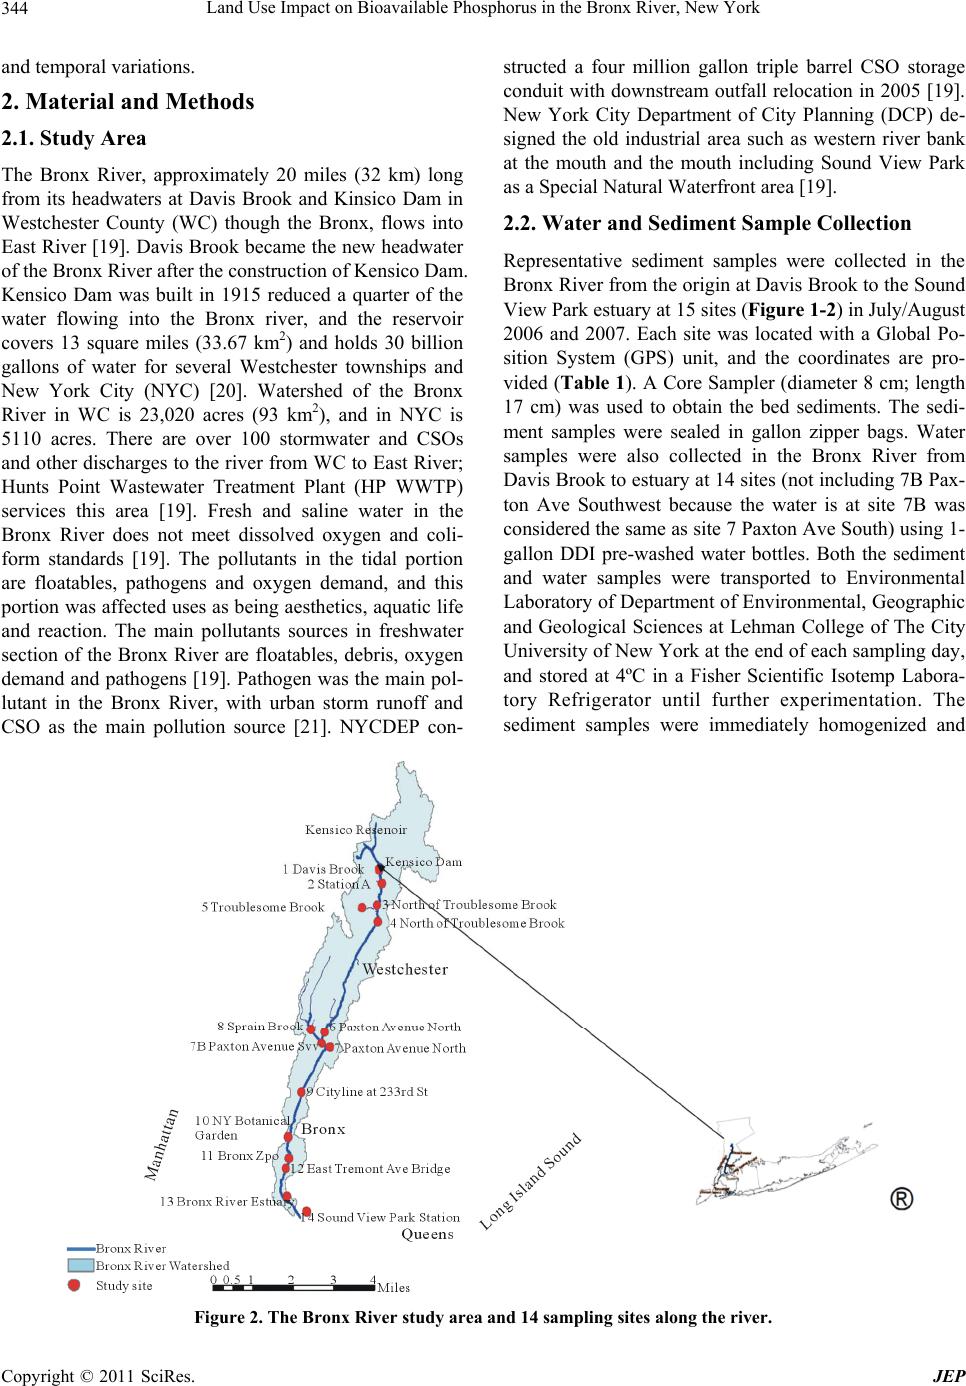 Land Use Impact on Bioavailable Phosphorus in the Bronx River, New York Copyright © 2011 SciRes. JEP 344 and temporal variations. 2. Material and Methods 2.1. Study Area The Bronx River, approximately 20 miles (32 km) long from its headwaters at Davis Brook and Kinsico Dam in Westchester County (WC) though the Bronx, flows into East River [19]. Davis Brook became the new headwater of the Bronx River after the construction of Kensico Dam. Kensico Dam was built in 1915 reduced a quarter of the water flowing into the Bronx river, and the reservoir covers 13 square miles (33.67 km2) and holds 30 billion gallons of water for several Westchester townships and New York City (NYC) [20]. Watershed of the Bronx River in WC is 23,020 acres (93 km2), and in NYC is 5110 acres. There are over 100 stormwater and CSOs and other discharges to the river from WC to East River; Hunts Point Wastewater Treatment Plant (HP WWTP) services this area [19]. Fresh and saline water in the Bronx River does not meet dissolved oxygen and coli- form standards [19]. The pollutants in the tidal portion are floatables, pathogens and oxygen demand, and this portion was affected uses as being aesthetics, aquatic life and reaction. The main pollutants sources in freshwater section of the Bronx River are floatables, debris, oxygen demand and pathogens [19]. Pathogen was the main pol- lutant in the Bronx River, with urban storm runoff and CSO as the main pollution source [21]. NYCDEP con- structed a four million gallon triple barrel CSO storage conduit with downstream outfall relocation in 2005 [19]. New York City Department of City Planning (DCP) de- signed the old industrial area such as western river bank at the mouth and the mouth including Sound View Park as a Special Natural Waterfront area [19]. 2.2. Water and Sediment Sample Collection Representative sediment samples were collected in the Bronx River from the origin at Davis Brook to the Sound View Park estuary at 15 sites (Figure 1-2) in July/August 2006 and 2007. Each site was located with a Global Po- sition System (GPS) unit, and the coordinates are pro- vided (Table 1). A Core Sampler (diameter 8 cm; length 17 cm) was used to obtain the bed sediments. The sedi- ment samples were sealed in gallon zipper bags. Water samples were also collected in the Bronx River from Davis Brook to estuary at 14 sites (not including 7B Pax- ton Ave Southwest because the water is at site 7B was considered the same as site 7 Paxton Ave South) using 1- gallon DDI pre-washed water bottles. Both the sediment and water samples were transported to Environmental Laboratory of Department of Environmental, Geographic and Geological Sciences at Lehman College of The City University of New York at the end of each sampling day, and stored at 4ºC in a Fisher Scientific Isotemp Labora- tory Refrigerator until further experimentation. The sediment samples were immediately homogenized and Figure 2. The Bronx River study area and 14 sampling sites along the river. 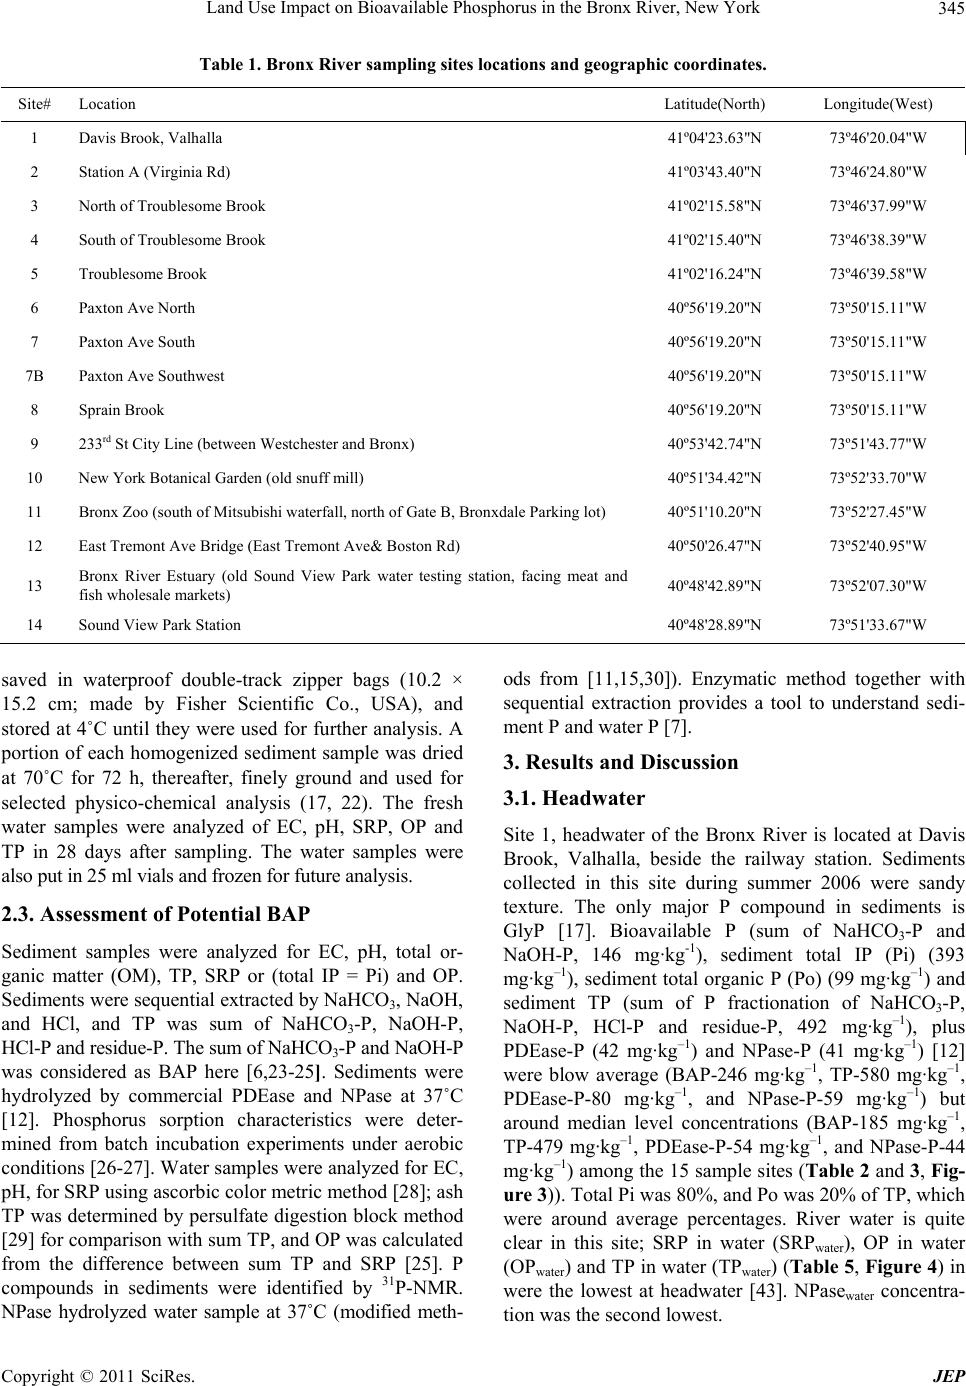 Land Use Impact on Bioavailable Phosphorus in the Bronx River, New York345 Table 1. Bronx River sampling sites locations and geographic coordinates. Site# Location Latitude(North) Longitude(West) 1 Davis Brook, Valhalla 41º04'23.63"N 73º46'20.04"W 2 Station A (Virginia Rd) 41º03'43.40"N 73º46'24.80"W 3 North of Troublesome Brook 41º02'15.58"N 73º46'37.99"W 4 South of Troublesome Brook 41º02'15.40"N 73º46'38.39"W 5 Troublesome Brook 41º02'16.24"N 73º46'39.58"W 6 Paxton Ave North 40º56'19.20"N 73º50'15.11"W 7 Paxton Ave South 40º56'19.20"N 73º50'15.11"W 7B Paxton Ave Southwest 40º56'19.20"N 73º50'15.11"W 8 Sprain Brook 40º56'19.20"N 73º50'15.11"W 9 233rd St City Line (between Westchester and Bronx) 40º53'42.74"N 73º51'43.77"W 10 New York Botanical Garden (old snuff mill) 40º51'34.42"N 73º52'33.70"W 11 Bronx Zoo (south of Mitsubishi waterfall, north of Gate B, Bronxdale Parking lot) 40º51'10.20"N 73º52'27.45"W 12 East Tremont Ave Bridge (East Tremont Ave& Boston Rd) 40º50'26.47"N 73º52'40.95"W 13 Bronx River Estuary (old Sound View Park water testing station, facing meat and fish wholesale markets) 40º48'42.89"N 73º52'07.30"W 14 Sound View Park Station 40º48'28.89"N 73º51'33.67"W saved in waterproof double-track zipper bags (10.2 × 15.2 cm; made by Fisher Scientific Co., USA), and stored at 4˚C until they were used for further analysis. A portion of each homogenized sediment sample was dried at 70˚C for 72 h, thereafter, finely ground and used for selected physico-chemical analysis (17, 22). The fresh water samples were analyzed of EC, pH, SRP, OP and TP in 28 days after sampling. The water samples were also put in 25 ml vials and frozen for future analysis. 2.3. Assessment of Potential BAP Sediment samples were analyzed for EC, pH, total or- ganic matter (OM), TP, SRP or (total IP = Pi) and OP. Sediments were sequential extracted by NaHCO3, NaOH, and HCl, and TP was sum of NaHCO3-P, NaOH-P, HCl-P and residue-P. The sum of NaHCO3-P and NaOH-P was considered as BAP here [6,23-25]. Sediments were hydrolyzed by commercial PDEase and NPase at 37˚C [12]. Phosphorus sorption characteristics were deter- mined from batch incubation experiments under aerobic conditions [26-27]. Water samples were analyzed for EC, pH, for SRP using ascorbic color metric method [28]; ash TP was determined by persulfate digestion block method [29] for comparison with sum TP, and OP was calculated from the difference between sum TP and SRP [25]. P compounds in sediments were identified by 31P-NMR. NPase hydrolyzed water sample at 37˚C (modified meth- ods from [11,15,30]). Enzymatic method together with sequential extraction provides a tool to understand sedi- ment P and water P [7]. 3. Results and Discussion 3.1. Headwater Site 1, headwater of the Bronx River is located at Davis Brook, Valhalla, beside the railway station. Sediments collected in this site during summer 2006 were sandy texture. The only major P compound in sediments is GlyP [17]. Bioavailable P (sum of NaHCO3-P and NaOH-P, 146 mg·kg-1), sediment total IP (Pi) (393 mg· k g –1), sediment total organic P (Po) (99 mg·kg–1) and sediment TP (sum of P fractionation of NaHCO3-P, NaOH-P, HCl-P and residue-P, 492 mg·kg–1), plus PDEase-P (42 mg·kg–1) and NPase-P (41 mg·kg–1) [12] were blow average (BAP-246 mg·kg–1, TP-580 mg·kg–1, PDEase-P-80 mg·kg–1, and NPase-P-59 mg·kg–1) but around median level concentrations (BAP-185 mg·kg–1, TP-479 mg·kg–1, PDEase-P-54 mg·kg–1, and NPase-P-44 mg· k g –1) among the 15 sample sites (Table 2 and 3, Fig- ure 3)). Total Pi was 80%, and Po was 20% of TP, which were around average percentages. River water is quite clear in this site; SRP in water (SRPwater), OP in water (OPwater) and TP in water (TPwater) (Table 5 , Figure 4) in were the lowest at headwater [43]. NPasewater concentra- ion was the second lowest. t Copyright © 2011 SciRes. JEP 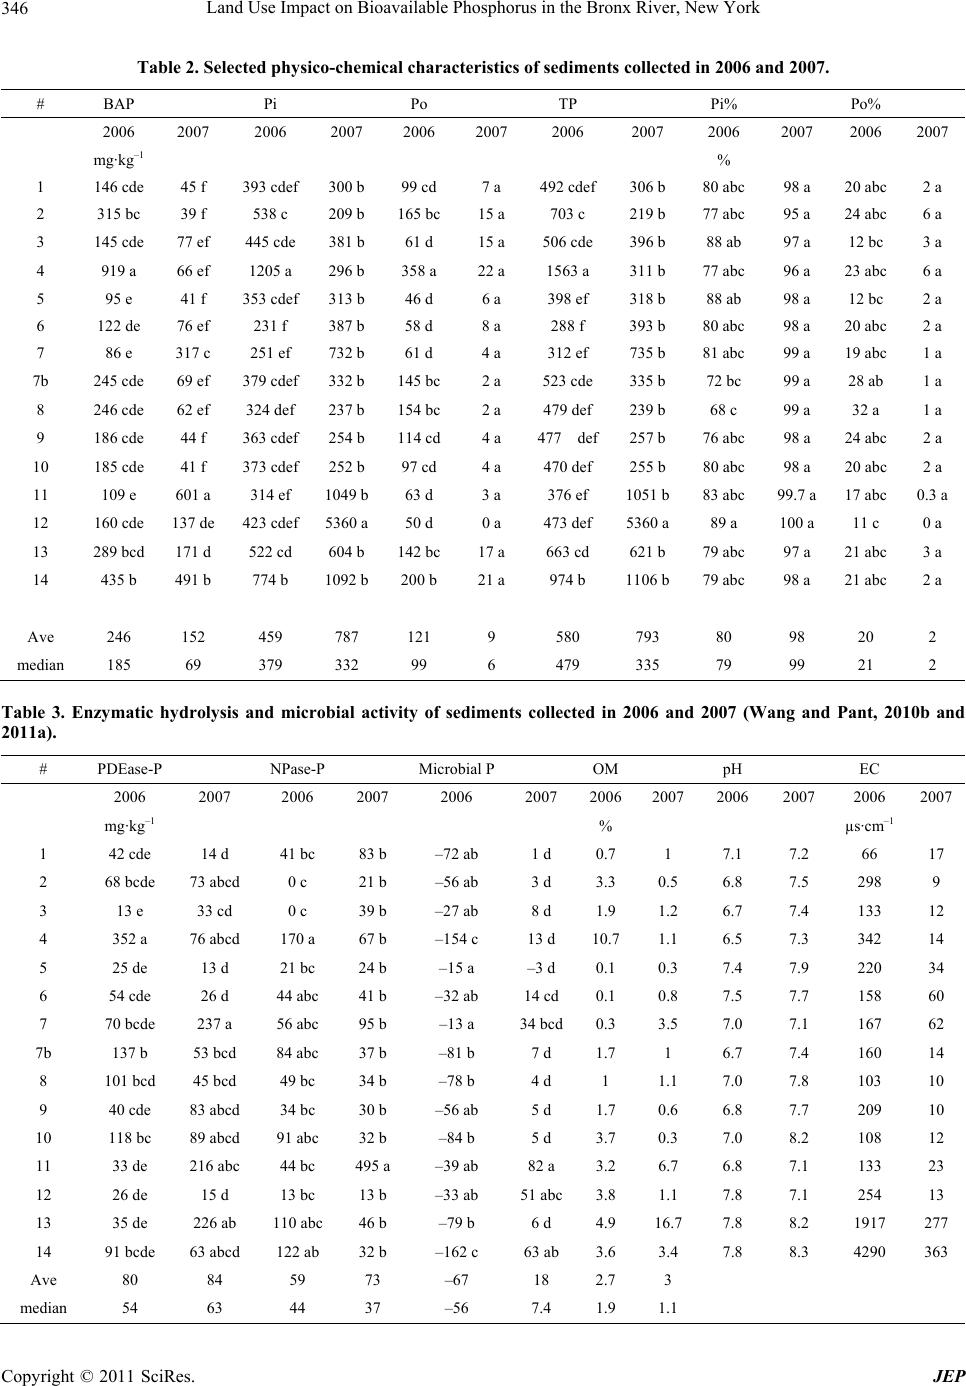 Land Use Impact on Bioavailable Phosphorus in the Bronx River, New York 346 Table 2. Selected physico-chemical characteristics of sediments collected in 2006 and 2007. # BAP Pi Po TP Pi% Po% 2006 2007 2006 2007 2006 2007 2006 2007 2006 2007 2006 2007 mg·kg–1 % 1 146 cde 45 f 393 cdef 300 b 99 cd 7 a 492 cdef306 b 80 abc 98 a 20 abc2 a 2 315 bc 39 f 538 c 209 b 165 bc 15 a 703 c 219 b 77 abc 95 a 24 abc6 a 3 145 cde 77 ef 445 cde 381 b 61 d 15 a 506 cde 396 b 88 ab 97 a 12 bc 3 a 4 919 a 66 ef 1205 a 296 b 358 a 22 a 1563 a 311 b 77 abc 96 a 23 abc6 a 5 95 e 41 f 353 cdef 313 b 46 d 6 a 398 ef 318 b 88 ab 98 a 12 bc 2 a 6 122 de 76 ef 231 f 387 b 58 d 8 a 288 f 393 b 80 abc 98 a 20 abc2 a 7 86 e 317 c 251 ef 732 b 61 d 4 a 312 ef 735 b 81 abc 99 a 19 abc1 a 7b 245 cde 69 ef 379 cdef 332 b 145 bc 2 a 523 cde 335 b 72 bc 99 a 28 ab 1 a 8 246 cde 62 ef 324 def 237 b 154 bc 2 a 479 def 239 b 68 c 99 a 32 a 1 a 9 186 cde 44 f 363 cdef 254 b 114 cd 4 a 477 def257 b 76 abc 98 a 24 abc2 a 10 185 cde 41 f 373 cdef 252 b 97 cd 4 a 470 def 255 b 80 abc 98 a 20 abc2 a 11 109 e 601 a 314 ef 1049 b 63 d 3 a 376 ef 1051 b 83 abc 99.7 a 17 abc0.3 a 12 160 cde 137 de 423 cdef 5360 a 50 d 0 a 473 def 5360 a 89 a 100 a 11 c 0 a 13 289 bcd 171 d 522 cd 604 b 142 bc 17 a 663 cd 621 b 79 abc 97 a 21 abc3 a 14 435 b 491 b 774 b 1092 b 200 b 21 a 974 b 1106 b 79 abc 98 a 21 abc2 a Ave 246 152 459 787 121 9 580 793 80 98 20 2 median 185 69 379 332 99 6 479 335 79 99 21 2 Table 3. Enzymatic hydrolysis and microbial activity of sediments collected in 2006 and 2007 (Wang and Pant, 2010b and 2011a). # PDEase-P NPase-P Microbial P OM pH EC 2006 2007 2006 2007 2006 2007 200620072006 2007 2006 2007 mg·kg–1 % µs·cm–1 1 42 cde 14 d 41 bc 83 b –72 ab 1 d 0.7 1 7.1 7.2 66 17 2 68 bcde 73 abcd0 c 21 b –56 ab 3 d 3.3 0.5 6.8 7.5 298 9 3 13 e 33 cd 0 c 39 b –27 ab 8 d 1.9 1.2 6.7 7.4 133 12 4 352 a 76 abcd170 a 67 b –154 c 13 d 10.7 1.1 6.5 7.3 342 14 5 25 de 13 d 21 bc 24 b –15 a –3 d 0.1 0.3 7.4 7.9 220 34 6 54 cde 26 d 44 abc 41 b –32 ab 14 cd 0.1 0.8 7.5 7.7 158 60 7 70 bcde 237 a 56 abc 95 b –13 a 34 bcd0.3 3.5 7.0 7.1 167 62 7b 137 b 53 bcd 84 abc 37 b –81 b 7 d 1.7 1 6.7 7.4 160 14 8 101 bcd 45 bcd 49 bc 34 b –78 b 4 d 1 1.1 7.0 7.8 103 10 9 40 cde 83 abcd34 bc 30 b –56 ab 5 d 1.7 0.6 6.8 7.7 209 10 10 118 bc 89 abcd91 abc 32 b –84 b 5 d 3.7 0.3 7.0 8.2 108 12 11 33 de 216 abc44 bc 495 a–39 ab 82 a 3.2 6.7 6.8 7.1 133 23 12 26 de 15 d 13 bc 13 b –33 ab 51 abc3.8 1.1 7.8 7.1 254 13 13 35 de 226 ab 110 abc 46 b –79 b 6 d 4.9 16.7 7.8 8.2 1917 277 14 91 bcde 63 abcd122 ab 32 b –162 c 63 ab 3.6 3.4 7.8 8.3 4290 363 Ave 80 84 59 73 –67 18 2.7 3 median 54 63 44 37 –56 7.4 1.9 1.1 Copyright © 2011 SciRes. JEP 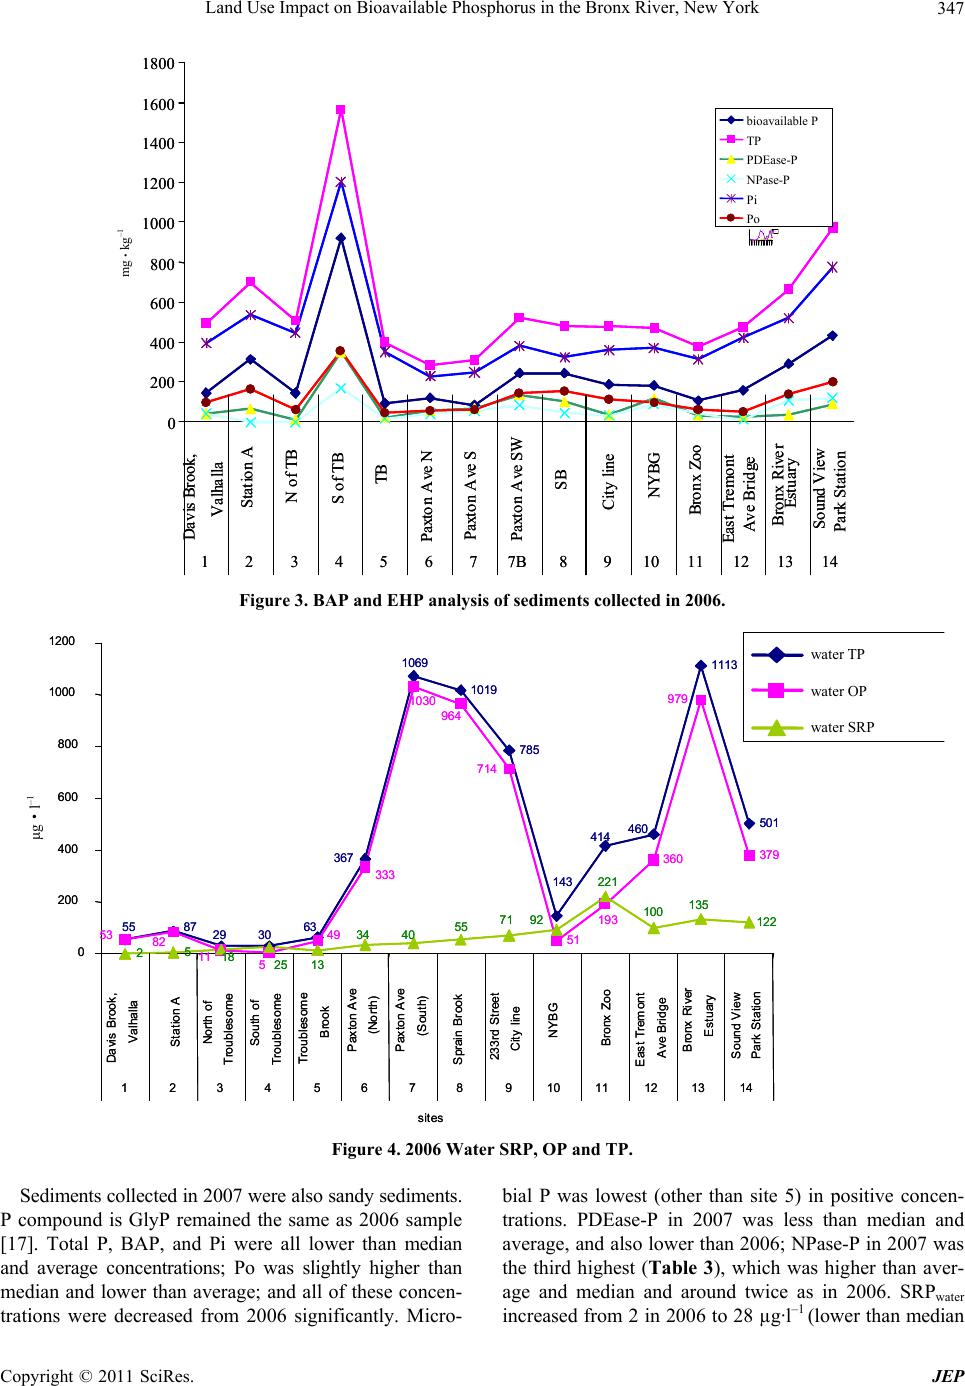 Land Use Impact on Bioavailable Phosphorus in the Bronx River, New York347 0 200 400 600 800 1000 1200 1400 1600 1800 Davis Brook, Valhalla Station A N of TB S of TB TB Paxton Ave N Paxton Ave S Paxton Ave SW SB City line NYBG Bronx Zoo East Tremont Ave Bridge Bronx River Es tu ary Sound View Park Station 1 23 4 5677B8 91011121314 mg kg-1 0 200 400 600 800 1000 1200 1400 1600 1800 Davis Brook, Valhalla Station A N of TB S of TB TB Paxton Ave N Paxton Ave S Paxton Ave SW SB City line NYBG Bronx Zoo East Tremont Ave Bridge Bronx River Es tu ary Sound View Park Station 1 23 4 5677B8 91011121314 mg kg-1 bioavailable P TP PDEase-P Pase-P Pi Po 558729 30 63 367 1069 1019 785 143 414 460 1113 501 53 82 115 49 333 1030964 714 51 193 360 979 379 2518 2513 34 40 55 71 92 221 100 135 122 0 200 400 600 800 1000 1200 Davis Brook, Valhalla Station A North of Troublesome South of Troublesome Troublesome Brook Paxton Ave (North) Paxton Ave (South) Sprain Brook 233rd Street City line NYBG Bronx Zoo East Tremont Ave Bridge Bronx River Estuary Sound View Park Station 1234567891011121314 sites µg l-1 558729 30 63 367 1069 1019 785 143 414 460 1113 501 53 82 115 49 333 1030964 714 51 193 360 979 379 2518 2513 34 40 55 71 92 221 100 135 122 0 200 400 600 800 1000 1200 Davis Brook, Valhalla Station A North of Troublesome South of Troublesome Troublesome Brook Paxton Ave (North) Paxton Ave (South) Sprain Brook 233rd Street City line NYBG Bronx Zoo East Tremont Ave Bridge Bronx River Estuary Sound View Park Station 1234567891011121314 sites µg l-1 water TP water OP water SRP μg l –1 mg · kg –1 Figure 3. BAP and EHP analysis of sediments collected in 2006. 5587 29 30 63 367 1069 1019 785 143 414 460 1113 501 53 82 11 5 49 333 1030 964 714 51 193 360 979 379 2518 25 13 34 4055 71 92 221 100 135 122 0 200 400 600 800 1000 1200 Davis Brook, Valhalla Station A Nort h of Troubles ome Sout h of Troub lesome Troublesome Brook Paxton Ave (North) Paxton Ave (South) Sprain Brook 233r d S treet City line NY B G Bronx Zoo East Tremont Ave Bridg e Bronx River Estuary S ound V i e w Park Stat ion 1234567891011121314 sites µg l-1 5587 29 30 63 367 1069 1019 785 143 414 460 1113 501 53 82 11 5 49 333 1030 964 714 51 193 360 979 379 2518 25 13 34 4055 71 92 221 100 135 122 0 200 400 600 800 1000 1200 Davis Brook, Valhalla Station A Nort h of Troubles ome Sout h of Troub lesome Troublesome Brook Paxton Ave (North) Paxton Ave (South) Sprain Brook 233r d S treet City line NY B G Bronx Zoo East Tremont Ave Bridg e Bronx River Estuary S ound V i e w Park Stat ion 1234567891011121314 sites µg l-1 water TP water OP water SRP μg·l–1 Figure 4. 2006 Water SRP, OP and TP. Sediments collected in 2007 were also sandy sediments. P compound is GlyP remained the same as 2006 sample [17]. Total P, BAP, and Pi were all lower than median and average concentrations; Po was slightly higher than median and lower than average; and all of these concen- trations were decreased from 2006 significantly. Micro- bial P was lowest (other than site 5) in positive concen- trations. PDEase-P in 2007 was less than median and average, and also lower than 2006; NPase-P in 2007 was the third highest (Table 3), which was higher than aver- age and median and around twice as in 2006. SRPwater increased from 2 in 2006 to 28 µg·l–1 (lower than median Copyright © 2011 SciRes. JEP 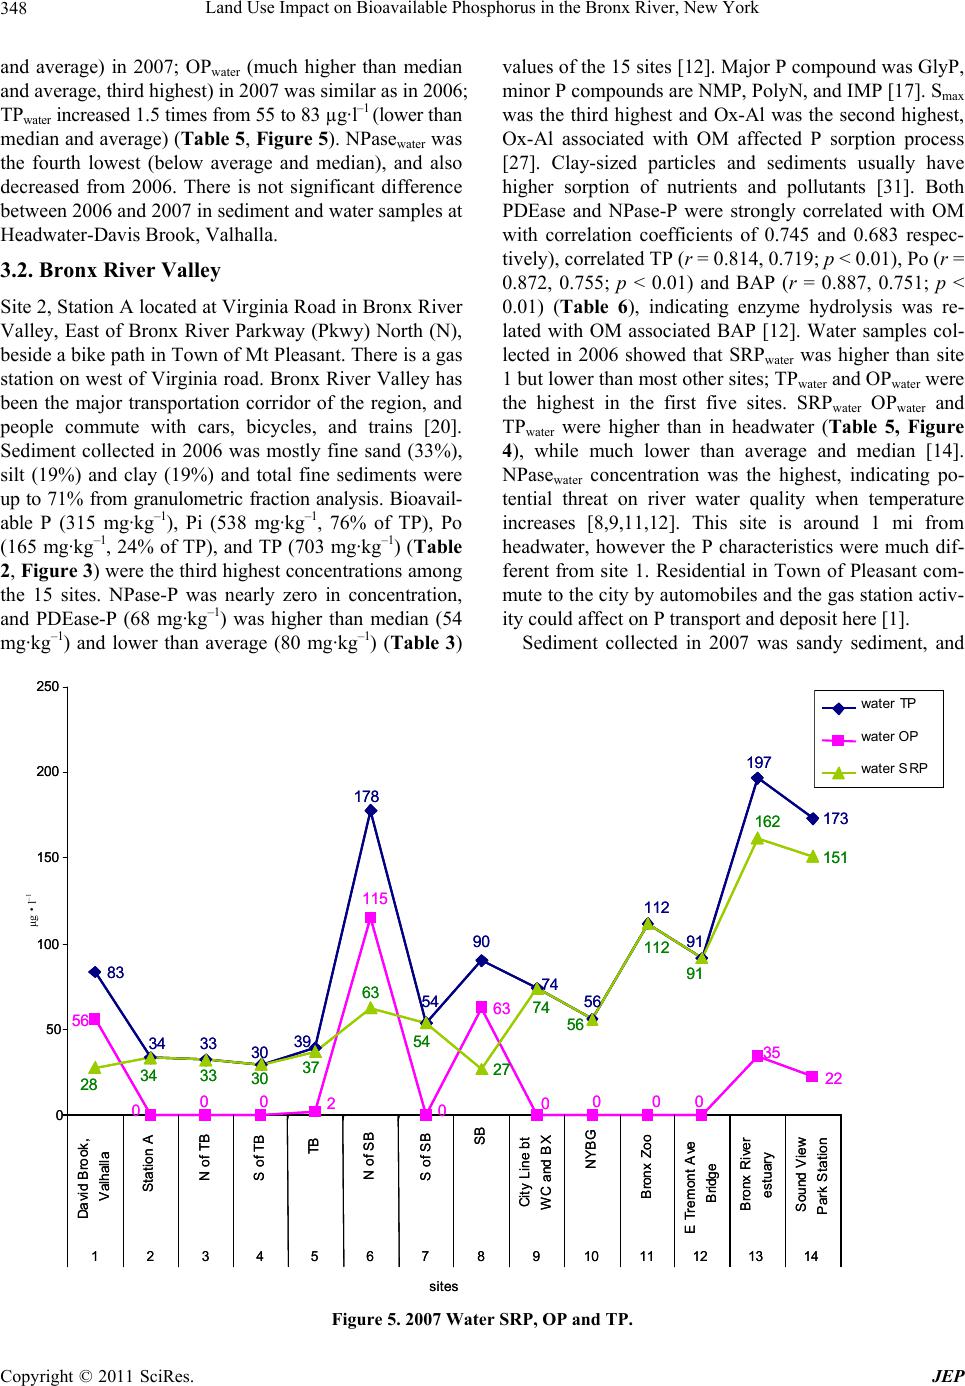 Land Use Impact on Bioavailable Phosphorus in the Bronx River, New York 348 and average) in 2007; OPwater (much higher than median and average, third highest) in 2007 was similar as in 2006; TPwater increased 1.5 times from 55 to 83 µg·l–1 (lower than median and average) (Table 5 , Figure 5). NPasewater was the fourth lowest (below average and median), and also decreased from 2006. There is not significant difference between 2006 and 2007 in sediment and water samples at Headwater-Davis Brook, Valhalla. 3.2. Bronx River Valley Site 2, Station A located at Virginia Road in Bronx River Valley, East of Bronx River Parkway (Pkwy) North (N), beside a bike path in Town of Mt Pleasant. There is a gas station on west of Virginia road. Bronx River Valley has been the major transportation corridor of the region, and people commute with cars, bicycles, and trains [20]. Sediment collected in 2006 was mostly fine sand (33%), silt (19%) and clay (19%) and total fine sediments were up to 71% from granulometric fraction analysis. Bioavail- able P (315 mg·kg–1), Pi (538 mg·kg–1, 76% of TP), Po (165 mg·kg–1, 24% of TP), and TP (703 mg·kg–1) (Table 2, Figure 3) were the third highest concentrations among the 15 sites. NPase-P was nearly zero in concentration, and PDEase-P (68 mg·kg–1) was higher than median (54 mg· k g –1) and lower than average (80 mg·kg–1) (Table 3) values of the 15 sites [12]. Major P compound was GlyP, minor P compounds are NMP, PolyN, and IMP [17]. Smax was the third highest and Ox-Al was the second highest, Ox-Al associated with OM affected P sorption process [27]. Clay-sized particles and sediments usually have higher sorption of nutrients and pollutants [31]. Both PDEase and NPase-P were strongly correlated with OM with correlation coefficients of 0.745 and 0.683 respec- tively), correlated TP (r = 0.814, 0.719; p < 0.01), Po (r = 0.872, 0.755; p < 0.01) and BAP (r = 0.887, 0.751; p < 0.01) (Table 6), indicating enzyme hydrolysis was re- lated with OM associated BAP [12]. Water samples col- lected in 2006 showed that SRPwater was higher than site 1 but lower than most other sites; TPwater and OPwater were the highest in the first five sites. SRPwater OPwater and TPwater were higher than in headwater (Table 5, Figure 4), while much lower than average and median [14]. NPasewater concentration was the highest, indicating po- tential threat on river water quality when temperature increases [8,9,11,12]. This site is around 1 mi from headwater, however the P characteristics were much dif- ferent from site 1. Residential in Town of Pleasant com- mute to the city by automobiles and the gas station activ- ity could affect on P transport and deposit here [1]. Sediment collected in 2007 was sandy sediment, and 83 34 33 30 39 178 54 90 74 56 112 91 197 17 56 000 2 115 0 63 0000 35 22 28 3433 30 37 63 54 27 74 56 112 91 162 151 0 50 100 150 200 250 David B r ook , Valhalla S t ation A N of TB S of TB TB N of S B S of SB SB Cit y Linebt WC and BX NYBG B ronx Z oo E Tremont Ave Bridge B ronx River estuary S ound V i ew Park Station 1234567891011121314 sites µg l -1 83 34 33 30 39 178 54 90 74 56 112 91 197 17 56 000 2 115 0 63 0000 35 22 28 3433 30 37 63 54 27 74 56 112 91 162 151 0 50 100 150 200 250 David B r ook , Valhalla S t ation A N of TB S of TB TB N of S B S of SB SB Cit y Linebt WC and BX NYBG B ronx Z oo E Tremont Ave Bridge B ronx River estuary S ound V i ew Park Station 1234567891011121314 sites µg l -1 water TP wat e r OP wat e r SRP water TP wat e r OP wat e r SRP μg·l –1 Figure 5. 2007 Water SRP, OP and TP. Copyright © 2011 SciRes. JEP  Land Use Impact on Bioavailable Phosphorus in the Bronx River, New York349 its texture was different from that of 2006. GlyP is the only P compound in 2007, and trace amounts of NMP, PolyN, IMP in 2006 not showing up here [17]. Bioavail- able P, Pi, and TP concentrations were the lowest among the 15 sites; TP, BAP, OM, Pi and Po were all decreased significantly from 2006 (Table 2), and other than Po were all lower than median and average concentrations. PDEase-P and NPase-P were increased from 2006 and both lower than median and average. TPwater in 2007 was the third lowest (lower than median and average concen- trations), lower than background concentration in natural waters, also lower than water samples collected in 2006. SRPwater increased from 2006, which was still lower than median and average; OPwater in 2007 is 0, and only SRPwater in this site. NPasewater (Table 5, Fig.5) was higher than median but lower than average, and much lower than that of in 2006. Perhaps the decreased OPwater was the reason of decreased EHP and consequently de- creased NPase hydrolysis activity in water column [7, 15,16]. 3.3. Troublesome Brook Tributary Site 3, 4, and 5 were located at Troublesome Brook tributary (TB), east of Westchester County Center and Bronx River Parkway (Pkwy) North (N). Westchester County Center was built in 1930, adjacent to the Pkwy [20]. Sediment textures were different among these three sites. Fine sandy sediments (coarse dand 19%, medium sand 26%, and fine sand 41%) collected in 2006 at site 3 N of TB, silty clay (fine sand 38%, silt 30%, and clay 17% from Granulometric fraction analysis) in site 4, S of TB, and sandy sediments in site 5 (coarse sand 42% and medium sand 16%), TB. Site 4 is a very representative tributary site, and it had highest TP, Pi (1205 mg·kg–1, 77%), Po (358 mg·kg–1, 23%), BAP (919 mg·kg–1) (Table 2), PDEase-P, NPase-P, OM, Ox-Al, S0; the third highest Ox-Fe, HCl-Ca and HCl-Mg, and the lowest Smax. Major P compound was DHAP, and GlyP, NMP, and IMP were in trace amounts [17]. BAP% was also the highest of 59%, which was higher than BAP% in Great Lake tribu- taries (25% - 50%) [31]. Al, Fe, Mg, Ca associated with OM affected P sorption. Original sorbed P-S0, P absorp- tion energy Kf and bonding strength (k) were highest among 15 sites [27]; Smax was the lowest among the 15 sites, relative high EPC0 values (more than average 0.36 mg· l –1), indicating there was high original sorbed P-S0 in sediments that was correlated with P absorption en- ergy-Kf (0.883), constant relates to bonding strength-k (0.569), and sorption coefficient Kd (0.796) meanwhile there was low sorption capacity in sediments [27]. Site 4 had the second most negative value of microbial P. Wang and Pant [25] mentioned that the negative values of mi- crobial P were possibly caused by different microorgan- isms or bacteria which were resistant to cell ly- sis/inhibition, and they could not be paralyzed by chlo- roform. Those resistant microorganisms and bacteria con- tinue to proliferate and uptake the SRP/BAP resulting in negative values. The more negative the value, the more resistant microorganism/bacteria biological activities occurred and uptake more P [4,25]. The high negative microbial P at site 4 indicated there were more P micro- bial available, and enzyme could hydrolyzed those mi- crobial P to SRP for plants use. PDEase-P was strongly correlated with BAP, TP, Pi, Po, k, Kf , and OM at p < 0.01, S0 and Ox-Al at p < 0.05. NPase-P was correlated with BAP, TP, Pi, Po, OM at p < 0.01, with EPC0, S0, k, and Kf at p < 0.05 (Tabl e 6), indicating enzyme hydroly- sis, microbial activity, BAP, potential BAP, and P sorp- tion processes were correlated and impacted each other. PDEase-P and NPase-P were strongly correlated with S0 (r = 0.589, 0.556; p < 0.05), NPase-P was negatively correlated with microbial P (r = –0.677; p < 0.01) (be- cause microbial-P concentrations were in negative val- ues), and indicating P sorption is connected with micro- bial activity and enzyme hydrolysis process [4]. Micro- bial P was negatively correlated (because microbial P were in negative values) with BAP, TP, Po, Pi and NP, indicating that the highest TP, Po, Pi values could proba- bly resulting in a second most negative microbial P, and the more negative value, the more microbial activity could have occurred that might have provided more in- herent EHP resulting in highest NPase-P. However, the negative values of microbial P were still need further exploration in the future. It is known that physico- chemi- cal activity such as sorption/desorption and biological activity such as microbial activity/enzyme hydrolysis were interaction each other and controlled P cycling and transport in rivers [4]. Site 4 TB was a narrow small low flow rate tributary that could result in OM and other metal associated P deposition [17]. Clay-sized particles and sediments usually have higher sorption of nutrients and pollutants [31]. Clay-sized sediments are easily sus- pended and settle slowly, and usually have high sorption rates of OM and cation (Al, Fe, Ca, Mg) associated P [33,39]; and P content increased as sediment size de- creased [25, 32]. SRPwater was 25 µg·l–1, TPwater was 30 µg·l–1, OPwater was 5 µg·l–1 (Table 5), and all of them were lower than average and median concentrations. Al- gal growth is linear correlated with P concentration ranged from 10 to 200 µg·l–1 [5], indicating that there was potential possibility of algal growth at this site. Bioavailable P and TP in sites 3 and 5 were much lower, and significantly lower PDEase-P and NPase-P concentrations than most of other sites (lower than me- dian and average concentrations). Microbial P was in lower negative concentrations, much less negative than Copyright © 2011 SciRes. JEP 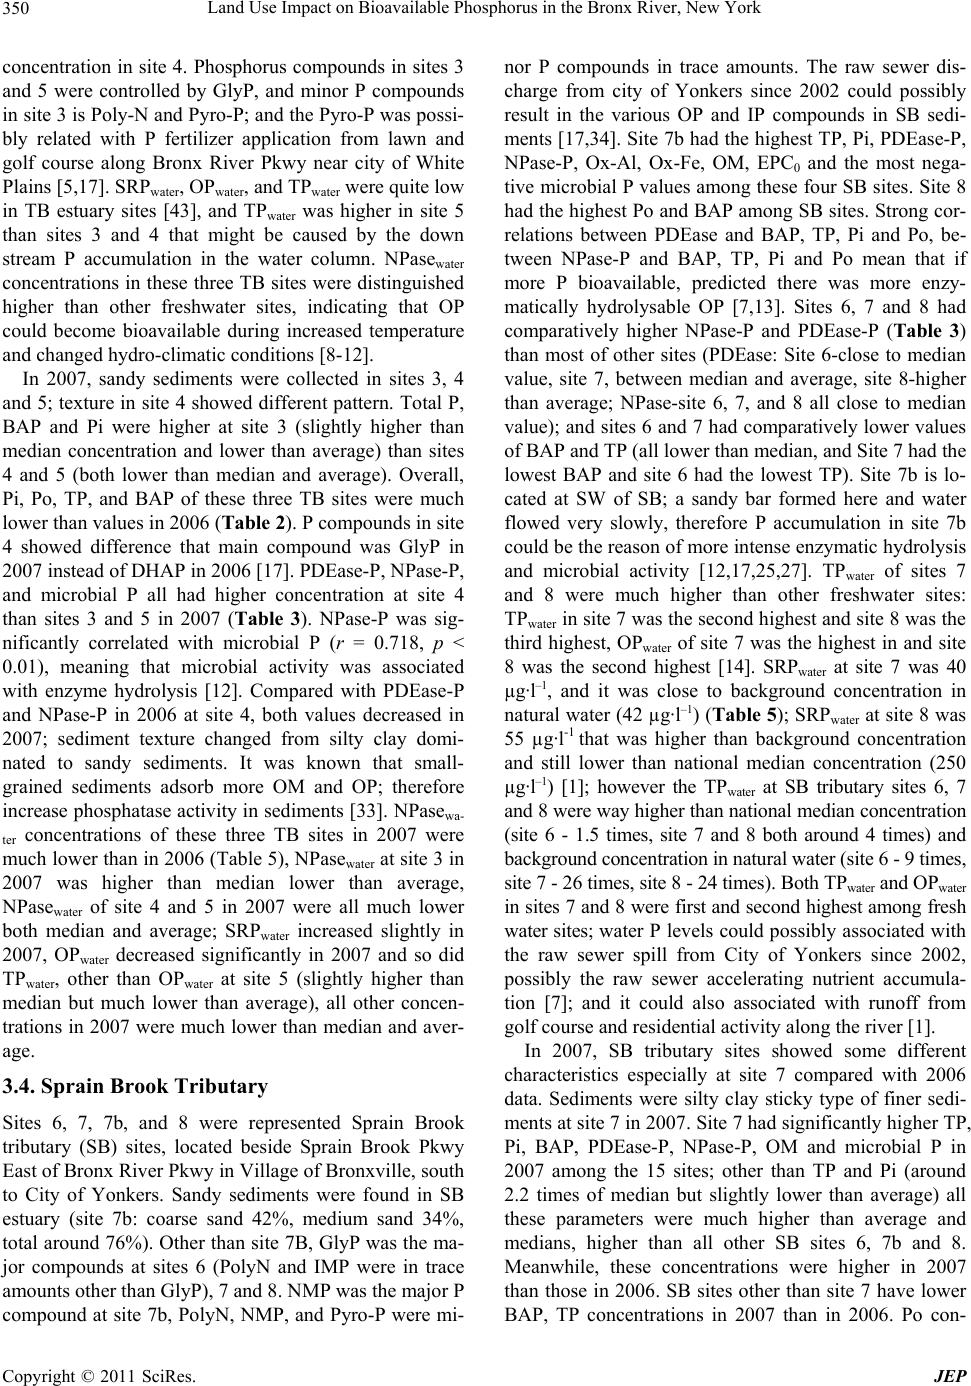 Land Use Impact on Bioavailable Phosphorus in the Bronx River, New York 350 concentration in site 4. Phosphorus compounds in sites 3 and 5 were controlled by GlyP, and minor P compounds in site 3 is Poly-N and Pyro-P; and the Pyro-P was possi- bly related with P fertilizer application from lawn and golf course along Bronx River Pkwy near city of White Plains [5,17]. SRPwater, OPwater, and TPwater were quite low in TB estuary sites [43], and TPwater was higher in site 5 than sites 3 and 4 that might be caused by the down stream P accumulation in the water column. NPasewater concentrations in these three TB sites were distinguished higher than other freshwater sites, indicating that OP could become bioavailable during increased temperature and changed hydro-climatic conditions [8-12]. In 2007, sandy sediments were collected in sites 3, 4 and 5; texture in site 4 showed different pattern. Total P, BAP and Pi were higher at site 3 (slightly higher than median concentration and lower than average) than sites 4 and 5 (both lower than median and average). Overall, Pi, Po, TP, and BAP of these three TB sites were much lower than values in 2006 (Tabl e 2). P compounds in site 4 showed difference that main compound was GlyP in 2007 instead of DHAP in 2006 [17]. PDEase-P, NPase-P, and microbial P all had higher concentration at site 4 than sites 3 and 5 in 2007 (Table 3). NPase-P was sig- nificantly correlated with microbial P (r = 0.718, p < 0.01), meaning that microbial activity was associated with enzyme hydrolysis [12]. Compared with PDEase-P and NPase-P in 2006 at site 4, both values decreased in 2007; sediment texture changed from silty clay domi- nated to sandy sediments. It was known that small- grained sediments adsorb more OM and OP; therefore increase phosphatase activity in sediments [33]. NPasewa- ter concentrations of these three TB sites in 2007 were much lower than in 2006 (Table 5), NPasewater at site 3 in 2007 was higher than median lower than average, NPasewater of site 4 and 5 in 2007 were all much lower both median and average; SRPwater increased slightly in 2007, OPwater decreased significantly in 2007 and so did TPwater, other than OPwater at site 5 (slightly higher than median but much lower than average), all other concen- trations in 2007 were much lower than median and aver- age. 3.4. Sprain Brook Tributary Sites 6, 7, 7b, and 8 were represented Sprain Brook tributary (SB) sites, located beside Sprain Brook Pkwy East of Bronx River Pkwy in Village of Bronxville, south to City of Yonkers. Sandy sediments were found in SB estuary (site 7b: coarse sand 42%, medium sand 34%, total around 76%). Other than site 7B, GlyP was the ma- jor compounds at sites 6 (PolyN and IMP were in trace amounts other than GlyP), 7 and 8. NMP was the major P compound at site 7b, PolyN, NMP, and Pyro-P were mi- nor P compounds in trace amounts. The raw sewer dis- charge from city of Yonkers since 2002 could possibly result in the various OP and IP compounds in SB sedi- ments [17,34]. Site 7b had the highest TP, Pi, PDEase-P, NPase-P, Ox-Al, Ox-Fe, OM, EPC0 and the most nega- tive microbial P values among these four SB sites. Site 8 had the highest Po and BAP among SB sites. Strong cor- relations between PDEase and BAP, TP, Pi and Po, be- tween NPase-P and BAP, TP, Pi and Po mean that if more P bioavailable, predicted there was more enzy- matically hydrolysable OP [7,13]. Sites 6, 7 and 8 had comparatively higher NPase-P and PDEase-P (Table 3) than most of other sites (PDEase: Site 6-close to median value, site 7, between median and average, site 8-higher than average; NPase-site 6, 7, and 8 all close to median value); and sites 6 and 7 had comparatively lower values of BAP and TP (all lower than median, and Site 7 had the lowest BAP and site 6 had the lowest TP). Site 7b is lo- cated at SW of SB; a sandy bar formed here and water flowed very slowly, therefore P accumulation in site 7b could be the reason of more intense enzymatic hydrolysis and microbial activity [12,17,25,27]. TPwater of sites 7 and 8 were much higher than other freshwater sites: TPwater in site 7 was the second highest and site 8 was the third highest, OPwater of site 7 was the highest in and site 8 was the second highest [14]. SRPwater at site 7 was 40 µg·l–1, and it was close to background concentration in natural water (42 µg·l–1) (Table 5); SRPwater at site 8 was 55 µg·l-1 that was higher than background concentration and still lower than national median concentration (250 µg·l–1) [1]; however the TPwater at SB tributary sites 6, 7 and 8 were way higher than national median concentration (site 6 - 1.5 times, site 7 and 8 both around 4 times) and background concentration in natural water (site 6 - 9 times, site 7 - 26 times, site 8 - 24 times). Both TPwater and OPwater in sites 7 and 8 were first and second highest among fresh water sites; water P levels could possibly associated with the raw sewer spill from City of Yonkers since 2002, possibly the raw sewer accelerating nutrient accumula- tion [7]; and it could also associated with runoff from golf course and residential activity along the river [1]. In 2007, SB tributary sites showed some different characteristics especially at site 7 compared with 2006 data. Sediments were silty clay sticky type of finer sedi- ments at site 7 in 2007. Site 7 had significantly higher TP, Pi, BAP, PDEase-P, NPase-P, OM and microbial P in 2007 among the 15 sites; other than TP and Pi (around 2.2 times of median but slightly lower than average) all these parameters were much higher than average and medians, higher than all other SB sites 6, 7b and 8. Meanwhile, these concentrations were higher in 2007 than those in 2006. SB sites other than site 7 have lower BAP, TP concentrations in 2007 than in 2006. Po con- Copyright © 2011 SciRes. JEP 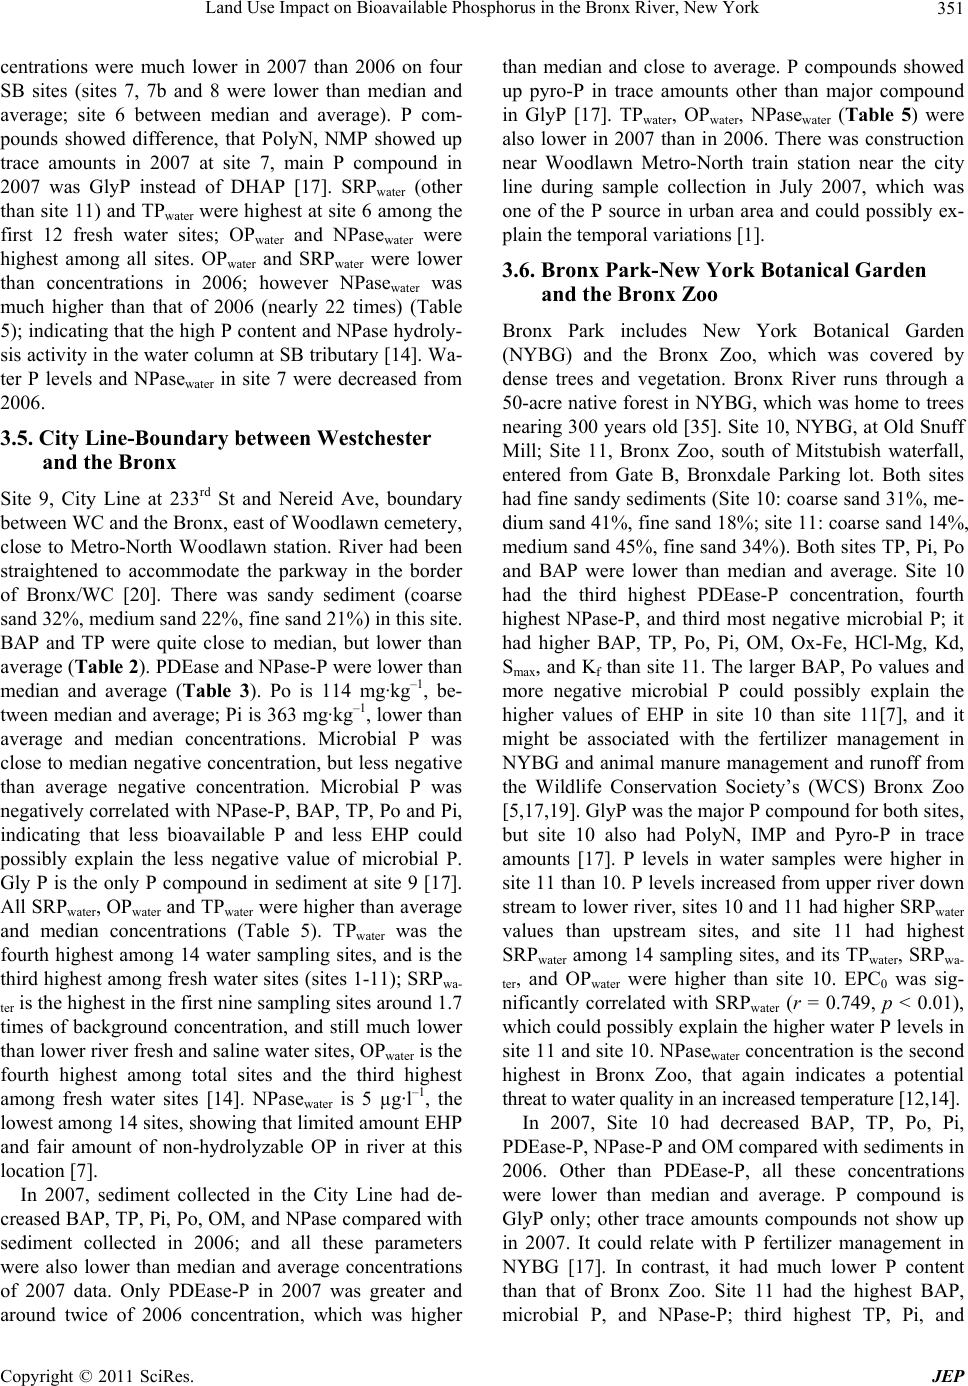 Land Use Impact on Bioavailable Phosphorus in the Bronx River, New York351 centrations were much lower in 2007 than 2006 on four SB sites (sites 7, 7b and 8 were lower than median and average; site 6 between median and average). P com- pounds showed difference, that PolyN, NMP showed up trace amounts in 2007 at site 7, main P compound in 2007 was GlyP instead of DHAP [17]. SRPwater (other than site 11) and TPwater were highest at site 6 among the first 12 fresh water sites; OPwater and NPasewater were highest among all sites. OPwater and SRPwater were lower than concentrations in 2006; however NPasewater was much higher than that of 2006 (nearly 22 times) (Table 5); indicating that the high P content and NPase hydroly- sis activity in the water column at SB tributary [14]. Wa- ter P levels and NPasewater in site 7 were decreased from 2006. 3.5. City Line-Boundary between Westchester and the Bronx Site 9, City Line at 233rd St and Nereid Ave, boundary between WC and the Bronx, east of Woodlawn cemetery, close to Metro-North Woodlawn station. River had been straightened to accommodate the parkway in the border of Bronx/WC [20]. There was sandy sediment (coarse sand 32%, medium sand 22%, fine sand 21%) in this site. BAP and TP were quite close to median, but lower than average (Table 2). PDEase and NPase-P were lower than median and average (Table 3). Po is 114 mg·kg–1, be- tween median and average; Pi is 363 mg·kg–1, lower than average and median concentrations. Microbial P was close to median negative concentration, but less negative than average negative concentration. Microbial P was negatively correlated with NPase-P, BAP, TP, Po and Pi, indicating that less bioavailable P and less EHP could possibly explain the less negative value of microbial P. Gly P is the only P compound in sediment at site 9 [17]. All SRPwater, OPwater and TPwater were higher than average and median concentrations (Table 5). TPwater was the fourth highest among 14 water sampling sites, and is the third highest among fresh water sites (sites 1-11); SRPwa- ter is the highest in the first nine sampling sites around 1.7 times of background concentration, and still much lower than lower river fresh and saline water sites, OPwater is the fourth highest among total sites and the third highest among fresh water sites [14]. NPasewater is 5 µg·l–1, the lowest among 14 sites, showing that limited amount EHP and fair amount of non-hydrolyzable OP in river at this location [7]. In 2007, sediment collected in the City Line had de- creased BAP, TP, Pi, Po, OM, and NPase compared with sediment collected in 2006; and all these parameters were also lower than median and average concentrations of 2007 data. Only PDEase-P in 2007 was greater and around twice of 2006 concentration, which was higher than median and close to average. P compounds showed up pyro-P in trace amounts other than major compound in GlyP [17]. TPwater, OPwater, NPasewater (Table 5) were also lower in 2007 than in 2006. There was construction near Woodlawn Metro-North train station near the city line during sample collection in July 2007, which was one of the P source in urban area and could possibly ex- plain the temporal variations [1]. 3.6. Bronx Park-New York Botanical Garden and the Bronx Zoo Bronx Park includes New York Botanical Garden (NYBG) and the Bronx Zoo, which was covered by dense trees and vegetation. Bronx River runs through a 50-acre native forest in NYBG, which was home to trees nearing 300 years old [35]. Site 10, NYBG, at Old Snuff Mill; Site 11, Bronx Zoo, south of Mitstubish waterfall, entered from Gate B, Bronxdale Parking lot. Both sites had fine sandy sediments (Site 10: coarse sand 31%, me- dium sand 41%, fine sand 18%; site 11: coarse sand 14%, medium sand 45%, fine sand 34%). Both sites TP, Pi, Po and BAP were lower than median and average. Site 10 had the third highest PDEase-P concentration, fourth highest NPase-P, and third most negative microbial P; it had higher BAP, TP, Po, Pi, OM, Ox-Fe, HCl-Mg, Kd, Smax, and Kf than site 11. The larger BAP, Po values and more negative microbial P could possibly explain the higher values of EHP in site 10 than site 11[7], and it might be associated with the fertilizer management in NYBG and animal manure management and runoff from the Wildlife Conservation Society’s (WCS) Bronx Zoo [5,17,19]. GlyP was the major P compound for both sites, but site 10 also had PolyN, IMP and Pyro-P in trace amounts [17]. P levels in water samples were higher in site 11 than 10. P levels increased from upper river down stream to lower river, sites 10 and 11 had higher SRPwater values than upstream sites, and site 11 had highest SRPwater among 14 sampling sites, and its TPwater, SRPwa- ter, and OPwater were higher than site 10. EPC0 was sig- nificantly correlated with SRPwater (r = 0.749, p < 0.01), which could possibly explain the higher water P levels in site 11 and site 10. NPasewater concentration is the second highest in Bronx Zoo, that again indicates a potential threat to water quality in an increased temperature [12,14]. In 2007, Site 10 had decreased BAP, TP, Po, Pi, PDEase-P, NPase-P and OM compared with sediments in 2006. Other than PDEase-P, all these concentrations were lower than median and average. P compound is GlyP only; other trace amounts compounds not show up in 2007. It could relate with P fertilizer management in NYBG [17]. In contrast, it had much lower P content than that of Bronx Zoo. Site 11 had the highest BAP, microbial P, and NPase-P; third highest TP, Pi, and Copyright © 2011 SciRes. JEP 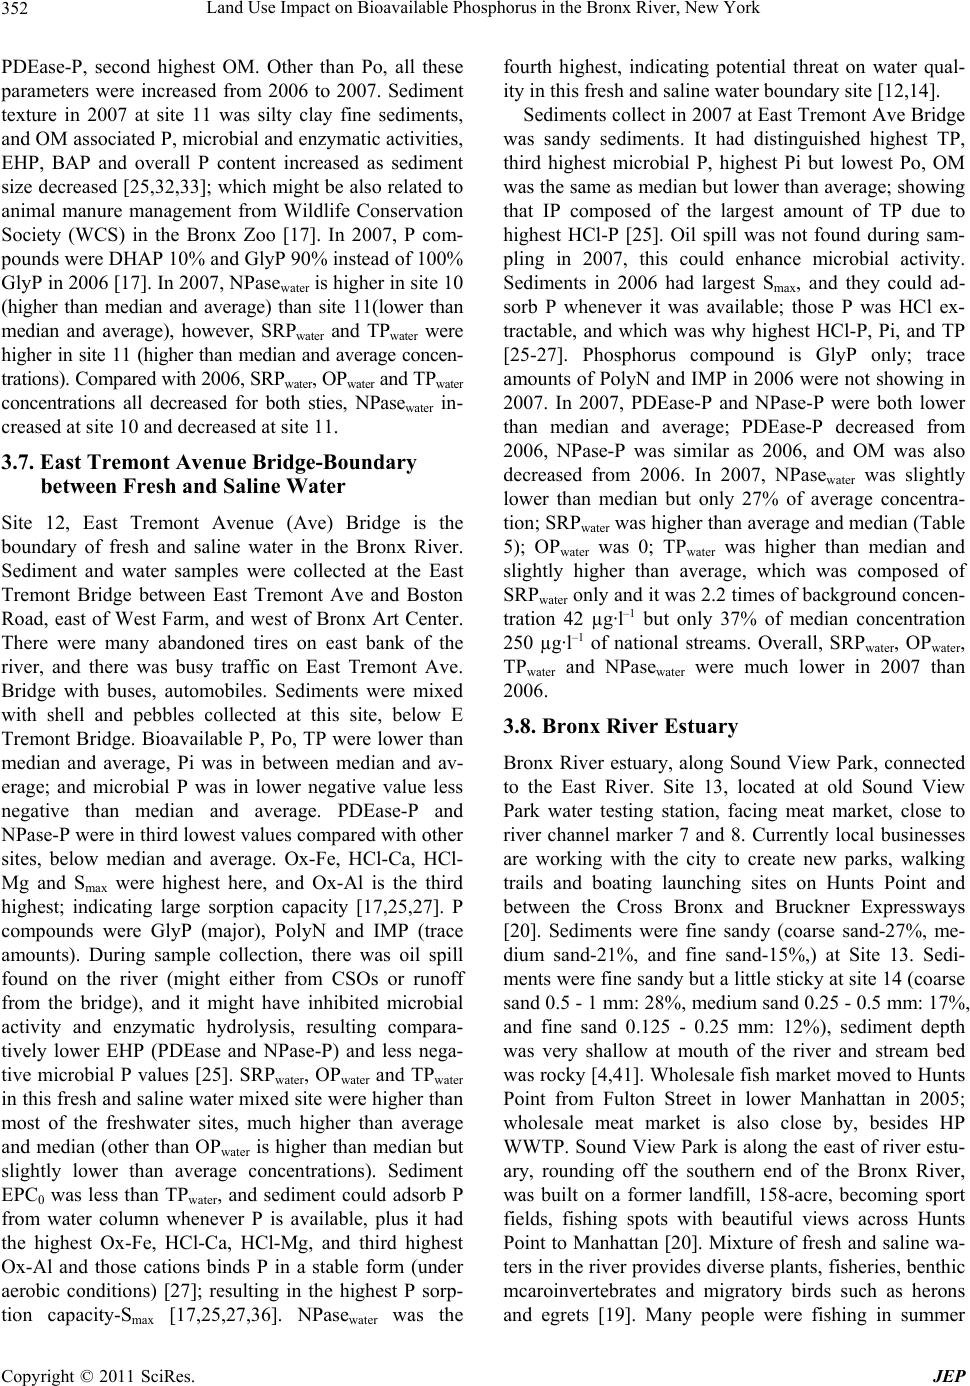 Land Use Impact on Bioavailable Phosphorus in the Bronx River, New York 352 PDEase-P, second highest OM. Other than Po, all these parameters were increased from 2006 to 2007. Sediment texture in 2007 at site 11 was silty clay fine sediments, and OM associated P, microbial and enzymatic activities, EHP, BAP and overall P content increased as sediment size decreased [25,32,33]; which might be also related to animal manure management from Wildlife Conservation Society (WCS) in the Bronx Zoo [17]. In 2007, P com- pounds were DHAP 10% and GlyP 90% instead of 100% GlyP in 2006 [17]. In 2007, NPasewater is higher in site 10 (higher than median and average) than site 11(lower than median and average), however, SRPwater and TPwater were higher in site 11 (higher than median and average concen- trations). Compared with 2006, SRPwater, OPwater and TPwater concentrations all decreased for both sties, NPasewate r in- creased at site 10 and decreased at site 11. 3.7. East Tremont Avenue Bridge-Boundary between Fresh and Saline Water Site 12, East Tremont Avenue (Ave) Bridge is the boundary of fresh and saline water in the Bronx River. Sediment and water samples were collected at the East Tremont Bridge between East Tremont Ave and Boston Road, east of West Farm, and west of Bronx Art Center. There were many abandoned tires on east bank of the river, and there was busy traffic on East Tremont Ave. Bridge with buses, automobiles. Sediments were mixed with shell and pebbles collected at this site, below E Tremont Bridge. Bioavailable P, Po, TP were lower than median and average, Pi was in between median and av- erage; and microbial P was in lower negative value less negative than median and average. PDEase-P and NPase-P were in third lowest values compared with other sites, below median and average. Ox-Fe, HCl-Ca, HCl- Mg and Smax were highest here, and Ox-Al is the third highest; indicating large sorption capacity [17,25,27]. P compounds were GlyP (major), PolyN and IMP (trace amounts). During sample collection, there was oil spill found on the river (might either from CSOs or runoff from the bridge), and it might have inhibited microbial activity and enzymatic hydrolysis, resulting compara- tively lower EHP (PDEase and NPase-P) and less nega- tive microbial P values [25]. SRPwater, OPwater and TPwater in this fresh and saline water mixed site were higher than most of the freshwater sites, much higher than average and median (other than OPwater is higher than median but slightly lower than average concentrations). Sediment EPC0 was less than TPwater, and sediment could adsorb P from water column whenever P is available, plus it had the highest Ox-Fe, HCl-Ca, HCl-Mg, and third highest Ox-Al and those cations binds P in a stable form (under aerobic conditions) [27]; resulting in the highest P sorp- tion capacity-Sma x [17,25,27,36]. NPasewater was the fourth highest, indicating potential threat on water qual- ity in this fresh and saline water boundary site [12,14]. Sediments collect in 2007 at East Tremont Ave Bridge was sandy sediments. It had distinguished highest TP, third highest microbial P, highest Pi but lowest Po, OM was the same as median but lower than average; showing that IP composed of the largest amount of TP due to highest HCl-P [25]. Oil spill was not found during sam- pling in 2007, this could enhance microbial activity. Sediments in 2006 had largest Smax, and they could ad- sorb P whenever it was available; those P was HCl ex- tractable, and which was why highest HCl-P, Pi, and TP [25-27]. Phosphorus compound is GlyP only; trace amounts of PolyN and IMP in 2006 were not showing in 2007. In 2007, PDEase-P and NPase-P were both lower than median and average; PDEase-P decreased from 2006, NPase-P was similar as 2006, and OM was also decreased from 2006. In 2007, NPasewater was slightly lower than median but only 27% of average concentra- tion; SRPwater was higher than average and median (Table 5); OPwater was 0; TPwater was higher than median and slightly higher than average, which was composed of SRPwater only and it was 2.2 times of background concen- tration 42 µg·l–1 but only 37% of median concentration 250 µg·l–1 of national streams. Overall, SRPwater, OPwater, TPwater and NPasewater were much lower in 2007 than 2006. 3.8. Bronx River Estuary Bronx River estuary, along Sound View Park, connected to the East River. Site 13, located at old Sound View Park water testing station, facing meat market, close to river channel marker 7 and 8. Currently local businesses are working with the city to create new parks, walking trails and boating launching sites on Hunts Point and between the Cross Bronx and Bruckner Expressways [20]. Sediments were fine sandy (coarse sand-27%, me- dium sand-21%, and fine sand-15%,) at Site 13. Sedi- ments were fine sandy but a little sticky at site 14 (coarse sand 0.5 - 1 mm: 28%, medium sand 0.25 - 0.5 mm: 17%, and fine sand 0.125 - 0.25 mm: 12%), sediment depth was very shallow at mouth of the river and stream bed was rocky [4,41]. Wholesale fish market moved to Hunts Point from Fulton Street in lower Manhattan in 2005; wholesale meat market is also close by, besides HP WWTP. Sound View Park is along the east of river estu- ary, rounding off the southern end of the Bronx River, was built on a former landfill, 158-acre, becoming sport fields, fishing spots with beautiful views across Hunts Point to Manhattan [20]. Mixture of fresh and saline wa- ters in the river provides diverse plants, fisheries, benthic mcaroinvertebrates and migratory birds such as herons and egrets [19]. Many people were fishing in summer Copyright © 2011 SciRes. JEP  Land Use Impact on Bioavailable Phosphorus in the Bronx River, New York Copyright © 2011 SciRes. JEP 353 during sample collection time. Fishes in Bronx Estuary includes striped bass, American eel, blue fish, summer flounder etc. Electrical Conductivity (EC) in water and sediments were much higher than fresh water sites. Site 14 sedi- ments had second highest BAP, TP, Po, Pi and NPase-P, the most negative microbial P, the fifth highest PDEase-P (all of these values were above average and median con- centrations), indicating intense microbial activity pro- vided more available P for enzyme hydrolysis activities [26]. The most negative microbial P could represent a significant amount of TP [25,26,37]. Site 13 had the fourth highest TP, BAP, and Pi, sixth highest Po. Site 14 had higher Smax than site 13, even though Ox-Al, Ox-Fe, HCl-Ca, and HCl-Mg were not as high as site 13, be- cause there were higher P levels (BAP, Pi, Po and TP in sediments) and higher P retained (92% in site 14 vs. 88% in site 13) [25,27]. Bioavailable P was the second highest (435 µg–1) (Table 1), and BAP% (BAP/TP%) was the fifth highest (45%) in site 14; BAP was the fourth high- est (289 µg–1) (Table 1) and BAP% (44%) was sixth highest in site 13; both BAP and BAP% were higher than average and median levels in both sites; showing the lar- ger amount BAP in estuary because discharges from HP WWTP sewer overflow during summer storms [12,17,27]. Similarly, other studies found that BAP% was higher in effluents from WWTP (average 72%) than other urban drainage discharges with BAP of 53% [5]. Furthermore, Smax was correlated with BAP (r = 0.641, p < 0.05), TP (r = 0.613, p < 0.05) and Pi (r = 0.623, p < 0.05), site 14 had significant higher BAP, TP and Pi than site 13 and other 12 sites, therefore, it had second highest Smax. Major P compound in estuary was GlyP; trace amounts of polyN in site 13 and NMP in site 14 [17]. Sewer overflow from HP WWTP during summer storm, CSOs from fish and meat wholesale markets, potential pollutants from East River could result in higher P in river water [38] and substantial microbial activity and enzyme hydrolysis process in estuary [1,12]. In site 13, TPwater (1113 µg·l–1) was the highest and OPwater (979 µg·l-1) was the second highest among the 14 water sam- pling sites (Table 4), showing a second peak of P con- centrations in estuary other than the first peak at SB (sites 7 and 8). In the water column, SRPwater, OPwater and TPwater in site 13 were all higher than those of site 14; TPwater and OPwater concentrations in both estuary sites were above median and average values and greater than national me- dian P concentration (250 µg·l–1) in waters, showing the highest nutrient concentrations in urban rivers were down- stream of WWTP facilities [1]. NPasewater of these two estuary sties were lower than median and average, mean- while, NPasewater in site 14 was slightly higher than that of site 13 (Table 4). Fishing is popular in summer at Table 4. Sorption characteristics of sediments collected in 2006 (Wang and Pant, 2010c). # EPC0 S 0 S max mg·kg–1 1 0.15 9 120 2 0.04 4 333 3 0.28 20 244 4 0.45 66 81 5 0.15 2 167 6 0.15 3 175 7 0.02 0 192 7b 0.73 29 179 8 0.44 53 370 9 0.42 24 169 10 0.41 13 208 11 0.58 13 120 12 0.33 46 476 13 0.54 31 333 14 0.67 42 435 Ave 0.36 24 240 median 0.41 24 192 Bronx River estuary. P levels in water and sediments could be a potential threat to water quality and fish con- sumption safety in estuary area. In 2007, sediments collected at site 13 were silty clay sticky sediments, and at site 14 were mixed sandy and silty sediments. Total P, Pi, Po, BAP and microbial P were second highest in site 14 (Table 2); Site 13 had the fifth highest TP and Pi, third highest Po, fourth highest BAP, and highest OM (16.7%, around 6 times of aver- age). Similar as data showed in 2006, it was indicating higher P levels in estuary sediments. PDEase-P was sec- ond highest in site 13, which was higher than site 14 (Table 3); NPase was also higher in site 13 than 14. As had mentioned earlier, it was showing that fine-grained silty clay type of sediments tends to adsorb more OM consequently increased enzymatic hydrolysis activities [33]. Microbial P was significantly correlated with BAP (r = 0.879, p < 0.01), Pi (r = 0.547, p < 0.05), and TP (r = 0.547, p < 0.05); therefore similar as 2006, site 14 had both second highest microbial P and P concentrations, further proved higher P levels and intense microbial ac- tivity in estuary [1,12]. Compared with data in 2006, BAP, TP, Po, NPase-P decreased, PDEase-P and OM 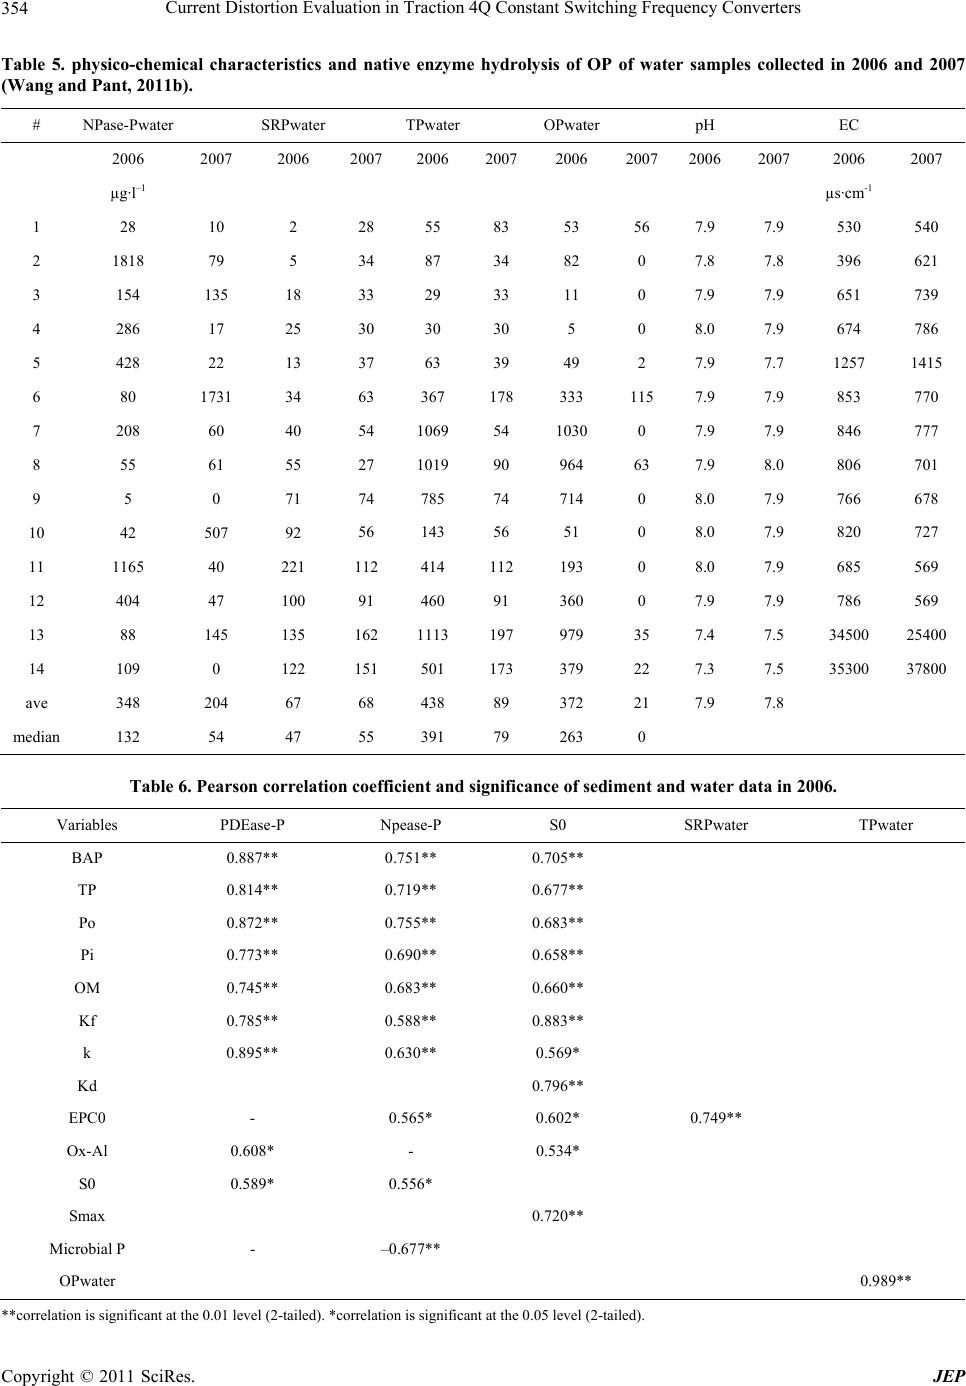 Current Distortion Evaluation in Traction 4Q Constant Switching Frequency Converters 354 Table 5. physico-chemical characteristics and native enzyme hydrolysis of OP of water samples collected in 2006 and 2007 (Wang and Pant, 2011b). # NPase-Pwater SRPwater TPwater OPwater pH EC 2006 2007 2006 20072006 20072006 20072006 2007 2006 2007 µg·l–1 µs·cm -1 1 28 10 2 28 55 83 53 56 7.9 7.9 530 540 2 1818 79 5 34 87 34 82 0 7.8 7.8 396 621 3 154 135 18 33 29 33 11 0 7.9 7.9 651 739 4 286 17 25 30 30 30 5 0 8.0 7.9 674 786 5 428 22 13 37 63 39 49 2 7.9 7.7 1257 1415 6 80 1731 34 63 367 178 333 115 7.9 7.9 853 770 7 208 60 40 54 1069 54 1030 0 7.9 7.9 846 777 8 55 61 55 27 1019 90 964 63 7.9 8.0 806 701 9 5 0 71 74 785 74 714 0 8.0 7.9 766 678 10 42 507 92 56 143 56 51 0 8.0 7.9 820 727 11 1165 40 221 112 414 112 193 0 8.0 7.9 685 569 12 404 47 100 91 460 91 360 0 7.9 7.9 786 569 13 88 145 135 162 1113 197 979 35 7.4 7.5 34500 25400 14 109 0 122 151 501 173 379 22 7.3 7.5 35300 37800 ave 348 204 67 68 438 89 372 21 7.9 7.8 median 132 54 47 55 391 79 263 0 Table 6. Pearson correlation coefficient and significance of sediment and water data in 2006. Variables PDEase-P Npease-P S0 SRPwater TPwater BAP 0.887** 0.751** 0.705** TP 0.814** 0.719** 0.677** Po 0.872** 0.755** 0.683** Pi 0.773** 0.690** 0.658** OM 0.745** 0.683** 0.660** Kf 0.785** 0.588** 0.883** k 0.895** 0.630** 0.569* Kd 0.796** EPC0 - 0.565* 0.602* 0.749** Ox-Al 0.608* - 0.534* S0 0.589* 0.556* Smax 0.720** Microbial P - –0.677** OPwater 0.989** **correlation is significant at the 0.01 level (2-tailed). *correlation is significant at the 0.05 level (2-tailed). Copyright © 2011 SciRes. JEP 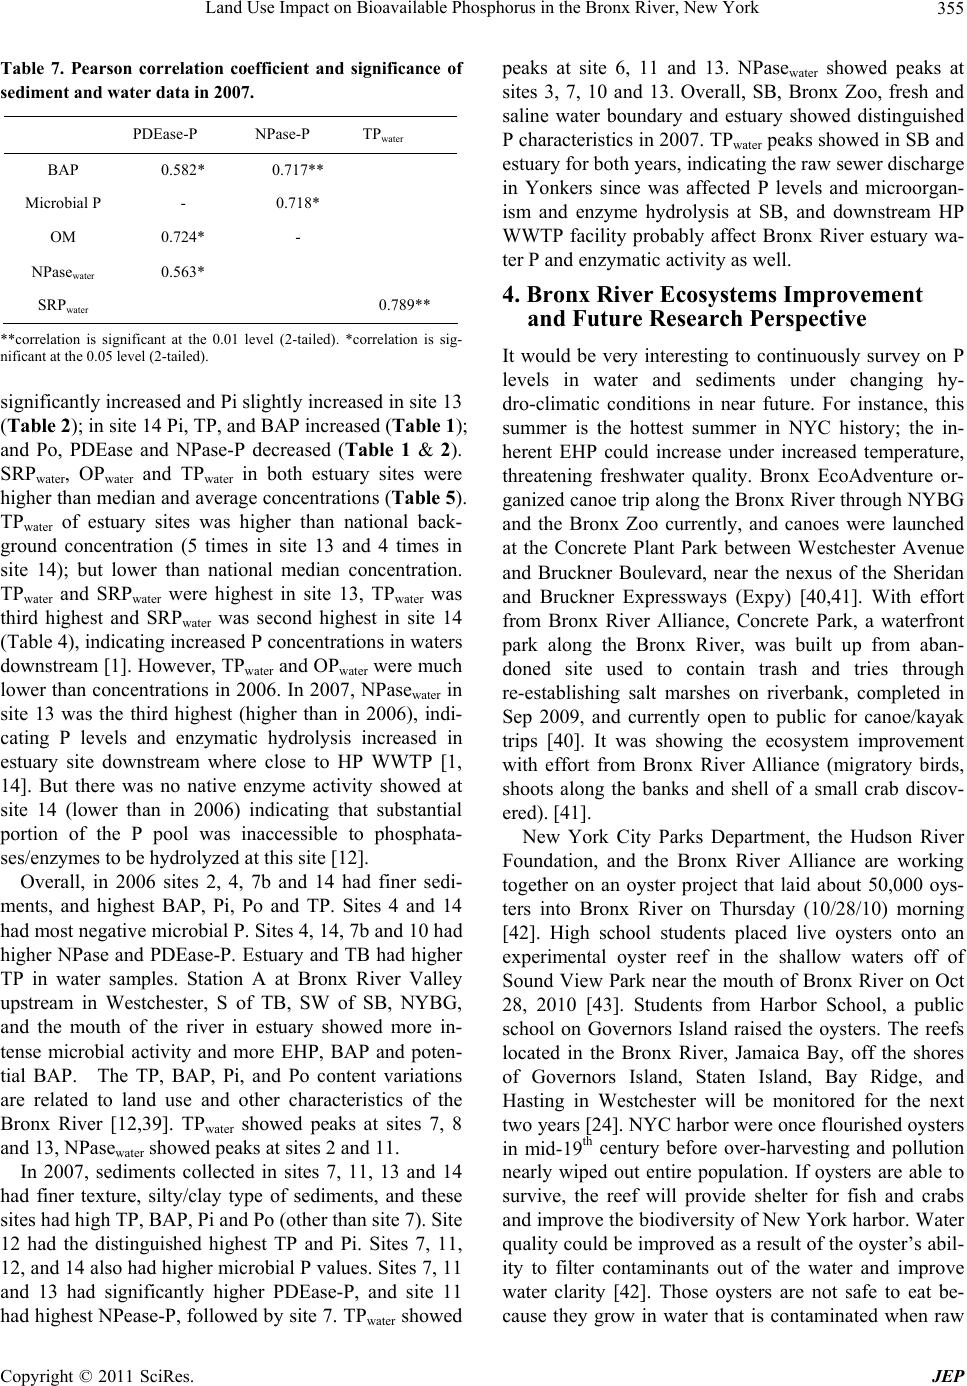 Land Use Impact on Bioavailable Phosphorus in the Bronx River, New York Copyright © 2011 SciRes. JEP 355 Table 7. Pearson correlation coefficient and significance of sediment and water data in 2007. PDEase-P NPase-P TPwater BAP 0.582* 0.717** Microbial P - 0.718* OM 0.724* - NPasewater 0.563* SRPwater 0.789** **correlation is significant at the 0.01 level (2-tailed). *correlation is sig- nificant at the 0.05 level (2-tailed). significantly increased and Pi slightly increased in site 13 (Table 2); in site 14 Pi, TP, and BAP increased (Table 1); and Po, PDEase and NPase-P decreased (Table 1 & 2). SRPwater, OPwater and TPwater in both estuary sites were higher than median and average concentrations (Table 5). TPwater of estuary sites was higher than national back- ground concentration (5 times in site 13 and 4 times in site 14); but lower than national median concentration. TPwater and SRPwater were highest in site 13, TPwater was third highest and SRPwater was second highest in site 14 (Table 4), indicating increased P concentrations in waters downstream [1]. However, TPwater and OPwater were much lower than concentrations in 2006. In 2007, NPasewater in site 13 was the third highest (higher than in 2006), indi- cating P levels and enzymatic hydrolysis increased in estuary site downstream where close to HP WWTP [1, 14]. But there was no native enzyme activity showed at site 14 (lower than in 2006) indicating that substantial portion of the P pool was inaccessible to phosphata- ses/enzymes to be hydrolyzed at this site [12]. Overall, in 2006 sites 2, 4, 7b and 14 had finer sedi- ments, and highest BAP, Pi, Po and TP. Sites 4 and 14 had most negative microbial P. Sites 4, 14, 7b and 10 had higher NPase and PDEase-P. Estuary and TB had higher TP in water samples. Station A at Bronx River Valley upstream in Westchester, S of TB, SW of SB, NYBG, and the mouth of the river in estuary showed more in- tense microbial activity and more EHP, BAP and poten- tial BAP. The TP, BAP, Pi, and Po content variations are related to land use and other characteristics of the Bronx River [12,39]. TPwater showed peaks at sites 7, 8 and 13, NPasewater showed peaks at sites 2 and 11. In 2007, sediments collected in sites 7, 11, 13 and 14 had finer texture, silty/clay type of sediments, and these sites had high TP, BAP, Pi and Po (other than site 7). Site 12 had the distinguished highest TP and Pi. Sites 7, 11, 12, and 14 also had higher microbial P values. Sites 7, 11 and 13 had significantly higher PDEase-P, and site 11 had highest NPease-P, followed by site 7. TPwater showed peaks at site 6, 11 and 13. NPasewater showed peaks at sites 3, 7, 10 and 13. Overall, SB, Bronx Zoo, fresh and saline water boundary and estuary showed distinguished P characteristics in 2007. TPwater peaks showed in SB and estuary for both years, indicating the raw sewer discharge in Yonkers since was affected P levels and microorgan- ism and enzyme hydrolysis at SB, and downstream HP WWTP facility probably affect Bronx River estuary wa- ter P and enzymatic activity as well. 4. Bronx River Ecosystems Improvement and Future Research Perspective It would be very interesting to continuously survey on P levels in water and sediments under changing hy- dro-climatic conditions in near future. For instance, this summer is the hottest summer in NYC history; the in- herent EHP could increase under increased temperature, threatening freshwater quality. Bronx EcoAdventure or- ganized canoe trip along the Bronx River through NYBG and the Bronx Zoo currently, and canoes were launched at the Concrete Plant Park between Westchester Avenue and Bruckner Boulevard, near the nexus of the Sheridan and Bruckner Expressways (Expy) [40,41]. With effort from Bronx River Alliance, Concrete Park, a waterfront park along the Bronx River, was built up from aban- doned site used to contain trash and tries through re-establishing salt marshes on riverbank, completed in Sep 2009, and currently open to public for canoe/kayak trips [40]. It was showing the ecosystem improvement with effort from Bronx River Alliance (migratory birds, shoots along the banks and shell of a small crab discov- ered). [41]. New York City Parks Department, the Hudson River Foundation, and the Bronx River Alliance are working together on an oyster project that laid about 50,000 oys- ters into Bronx River on Thursday (10/28/10) morning [42]. High school students placed live oysters onto an experimental oyster reef in the shallow waters off of Sound View Park near the mouth of Bronx River on Oct 28, 2010 [43]. Students from Harbor School, a public school on Governors Island raised the oysters. The reefs located in the Bronx River, Jamaica Bay, off the shores of Governors Island, Staten Island, Bay Ridge, and Hasting in Westchester will be monitored for the next two years [24]. NYC harbor were once flourished oysters in mid-19th century before over-harvesting and pollution nearly wiped out entire population. If oysters are able to survive, the reef will provide shelter for fish and crabs and improve the biodiversity of New York harbor. Water quality could be improved as a result of the oyster’s abil- ity to filter contaminants out of the water and improve water clarity [42]. Those oysters are not safe to eat be- cause they grow in water that is contaminated when raw 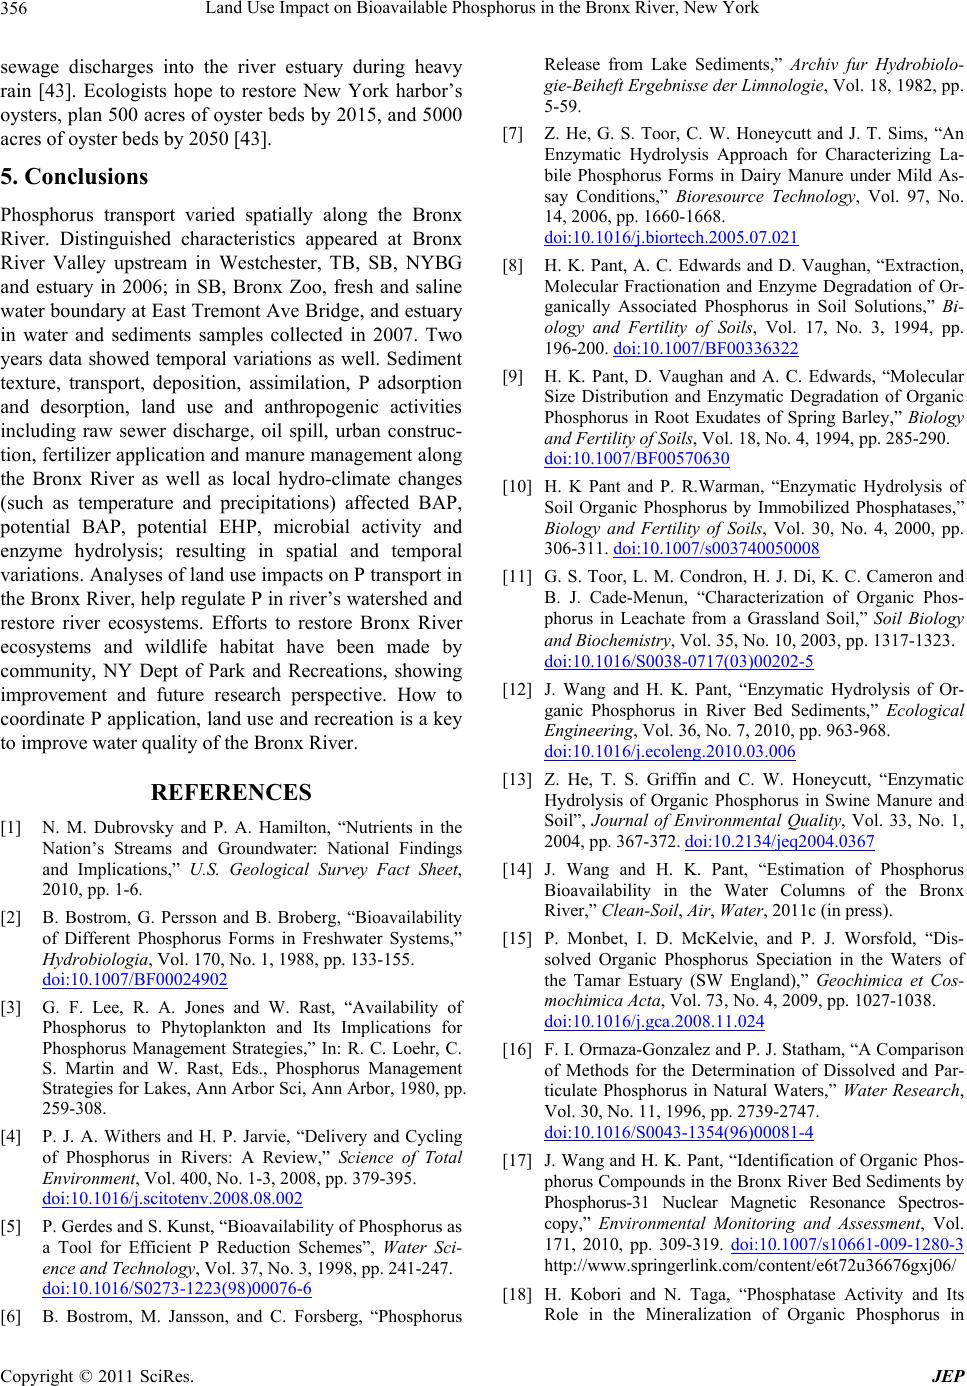 Land Use Impact on Bioavailable Phosphorus in the Bronx River, New York 356 sewage discharges into the river estuary during heavy rain [43]. Ecologists hope to restore New York harbor’s oysters, plan 500 acres of oyster beds by 2015, and 5000 acres of oyster beds by 2050 [43]. 5. Conclusions Phosphorus transport varied spatially along the Bronx River. Distinguished characteristics appeared at Bronx River Valley upstream in Westchester, TB, SB, NYBG and estuary in 2006; in SB, Bronx Zoo, fresh and saline water boundary at East Tremont Ave Bridge, and estuary in water and sediments samples collected in 2007. Two years data showed temporal variations as well. Sediment texture, transport, deposition, assimilation, P adsorption and desorption, land use and anthropogenic activities including raw sewer discharge, oil spill, urban construc- tion, fertilizer application and manure management along the Bronx River as well as local hydro-climate changes (such as temperature and precipitations) affected BAP, potential BAP, potential EHP, microbial activity and enzyme hydrolysis; resulting in spatial and temporal variations. Analyses of land use impacts on P transport in the Bronx River, help regulate P in river’s watershed and restore river ecosystems. Efforts to restore Bronx River ecosystems and wildlife habitat have been made by community, NY Dept of Park and Recreations, showing improvement and future research perspective. How to coordinate P application, land use and recreation is a key to improve water quality of the Bronx River. REFERENCES [1] N. M. Dubrovsky and P. A. Hamilton, “Nutrients in the Nation’s Streams and Groundwater: National Findings and Implications,” U.S. Geological Survey Fact Sheet, 2010, pp. 1-6. [2] B. Bostrom, G. Persson and B. Broberg, “Bioavailability of Different Phosphorus Forms in Freshwater Systems,” Hydrobiologia, Vol. 170, No. 1, 1988, pp. 133-155. doi:10.1007/BF00024902 [3] G. F. Lee, R. A. Jones and W. Rast, “Availability of Phosphorus to Phytoplankton and Its Implications for Phosphorus Management Strategies,” In: R. C. Loehr, C. S. Martin and W. Rast, Eds., Phosphorus Management Strategies for Lakes, Ann Arbor Sci, Ann Arbor, 1980, pp. 259-308. [4] P. J. A. Withers and H. P. Jarvie, “Delivery and Cycling of Phosphorus in Rivers: A Review,” Science of Total Environment, Vol. 400, No. 1-3, 2008, pp. 379-395. doi:10.1016/j.scitotenv.2008.08.002 [5] P. Gerdes and S. Kunst, “Bioavailability of Phosphorus as a Tool for Efficient P Reduction Schemes”, Water Sci- ence and Technology, Vol. 37, No. 3, 1998, pp. 241-247. doi:10.1016/S0273-1223(98)00076-6 [6] B. Bostrom, M. Jansson, and C. Forsberg, “Phosphorus Release from Lake Sediments,” Archiv fur Hydrobiolo- gie-Beiheft Ergebnisse der Limnologie, Vol. 18, 1982, pp. 5-59. [7] Z. He, G. S. Toor, C. W. Honeycutt and J. T. Sims, “An Enzymatic Hydrolysis Approach for Characterizing La- bile Phosphorus Forms in Dairy Manure under Mild As- say Conditions,” Bioresource Technology, Vol. 97, No. 14, 2006, pp. 1660-1668. doi:10.1016/j.biortech.2005.07.021 [8] H. K. Pant, A. C. Edwards and D. Vaughan, “Extraction, Molecular Fractionation and Enzyme Degradation of Or- ganically Associated Phosphorus in Soil Solutions,” Bi- ology and Fertility of Soils, Vol. 17, No. 3, 1994, pp. 196-200. doi:10.1007/BF00336322 [9] H. K. Pant, D. Vaughan and A. C. Edwards, “Molecular Size Distribution and Enzymatic Degradation of Organic Phosphorus in Root Exudates of Spring Barley,” Biology and Fertility of Soils, Vol. 18, No. 4, 1994, pp. 285-290. doi:10.1007/BF00570630 [10] H. K Pant and P. R.Warman, “Enzymatic Hydrolysis of Soil Organic Phosphorus by Immobilized Phosphatases,” Biology and Fertility of Soils, Vol. 30, No. 4, 2000, pp. 306-311. doi:10.1007/s003740050008 [11] G. S. Toor, L. M. Condron, H. J. Di, K. C. Cameron and B. J. Cade-Menun, “Characterization of Organic Phos- phorus in Leachate from a Grassland Soil,” Soil Biology and Biochemistry, Vol. 35, No. 10, 2003, pp. 1317-1323. doi:10.1016/S0038-0717(03)00202-5 [12] J. Wang and H. K. Pant, “Enzymatic Hydrolysis of Or- ganic Phosphorus in River Bed Sediments,” Ecological Engineering, Vol. 36, No. 7, 2010, pp. 963-968. doi:10.1016/j.ecoleng.2010.03.006 [13] Z. He, T. S. Griffin and C. W. Honeycutt, “Enzymatic Hydrolysis of Organic Phosphorus in Swine Manure and Soil”, Journal of Environmental Quality, Vol. 33, No. 1, 2004, pp. 367-372. doi:10.2134/jeq2004.0367 [14] J. Wang and H. K. Pant, “Estimation of Phosphorus Bioavailability in the Water Columns of the Bronx River,” Clean-Soil, Air, Water, 2011c (in press). [15] P. Monbet, I. D. McKelvie, and P. J. Worsfold, “Dis- solved Organic Phosphorus Speciation in the Waters of the Tamar Estuary (SW England),” Geochimica et Cos- mochimica Acta, Vol. 73, No. 4, 2009, pp. 1027-1038. doi:10.1016/j.gca.2008.11.024 [16] F. I. Ormaza-Gonzalez and P. J. Statham, “A Comparison of Methods for the Determination of Dissolved and Par- ticulate Phosphorus in Natural Waters,” Water Research, Vol. 30, No. 11, 1996, pp. 2739-2747. doi:10.1016/S0043-1354(96)00081-4 [17] J. Wang and H. K. Pant, “Identification of Organic Phos- phorus Compounds in the Bronx River Bed Sediments by Phosphorus-31 Nuclear Magnetic Resonance Spectros- copy,” Environmental Monitoring and Assessment, Vol. 171, 2010, pp. 309-319. doi:10.1007/s10661-009-1280-3 http://www.springerlink.com/content/e6t72u36676gxj06/ [18] H. Kobori and N. Taga, “Phosphatase Activity and Its Role in the Mineralization of Organic Phosphorus in Copyright © 2011 SciRes. JEP  Land Use Impact on Bioavailable Phosphorus in the Bronx River, New York357 Coastal Sea Water,” Journal of Experimental Marine Bi- ology and Ecology, Vol. 36, No.1, 1979, pp. 23-29. doi:10.1016/0022-0981(79)90098-4 [19] Bronx River, “Use and Standards Attainment Project Preliminary Waterbody/Watershed Characterization Re- port, Bronx River,” Vers. 2., BR1-BR6, 2001, December 5. Retrieved Februtary 14, 2006 from http://www.hydroqual.com/projects/usa/allprojects/pdfs/c haracterization_pdfs/Bronx_River.PDF [20] City of New York Parks & Recreation, “Bronx River New York Map,” 2003. [21] R. F. Wagner, “South Bronx Environmental Health and Policy Study: Water Quality in the South Bronx Water- shed. Institute of Civil Infrastructure System,” Graduate School of Public Service, New York University, New York, 2009. [22] W. A. House and F. H. Denison, “Total Phosphorus Con- tent of River Sediments in Relationship to Calcium, Iron and Organic Matter Concentrations,” The Science o f To t al Environment, Vol. 282-283, 2002, pp. 341-351. doi:10.1016/S0048-9697(01)00923-8 [23] M. J. Hedley, J. W. B.Stewart and B. S. Chauhan, “Chan- ges in Inorganic and Organic Soil Phosphorus Fractions Induced by Cultivation Practices and by Laboratory In- cubations,” Soil Science Society of America Journal, Vol. 46, No. 5, 1982, pp. 970-976. doi:10.2136/sssaj1982.03615995004600050017x [24] D. B. Ivanoff, K. R. Reddy and S. Robinson, “Chemical Fractionation of Organic Phosphorus in Selected Histo- soils,” Soil Science, Vol. 163, No. 1, 1998, pp. 36-45. doi:10.1097/00010694-199801000-00006 [25] J. Wang and H. K. Pant, “Assessment of Potential Spa- tial-Temporal Variations in Phosphorus Distribuation and Fractionation in River Bed Sediments,” Clean-Soil, Air, Water, Vol. 39, No. 2, 2011b, pp. 148-156. doi:10.1002/clen.201000088 [26] H. K. Pant and K. R. Reddy, “Phosphorus Sorption Char- acteristics of Estuarine Sediments under Different Redox Conditions,” Journal of Environmental Quality, Vol. 30, No. 4, 2001, pp. 1474-1480. doi:10.2134/jeq2001.3041474x [27] J. Wang and H. K. Pant, “Phosphorus Sorption Charac- teristics of the Bronx River Bed Sediments,” Chemical Speciation and Bioavailability, Vol. 22, No. 3, 2011, pp. 171-181. doi:10.3184/095422910X12827492153851 http://tinyurl.com/32cdd64 [28] USEPA (U.S. Environmental Protection Agency), “ESS Method 310.1: Ortho-Phosphorus, Dissolved Automated, Ascorbic Acid,” Environmental Sciences Section Inor- ganic Chemistry Unit, Wisconsin State Lab of Hygiene, Madison, 1992. [29] USEPA (U.S. Environmental Protection Agency), “Method 365.4. Determination of total phosphorus in Kjeldahl di- gestion by semi automated colorimetry,” Brazos River Authority SOP, No. BRA-007, 2003. [30] H. K. Pant, K. R. Reddy, and F. E. Dierberg, “Bioavail- ability of Organic Phosphorus in a Submerged Aquatic Vegetation-Dominated Treatment Wetland,” Journal of Environmental Quality, Vol. 31, No. 5, 2002, pp. 1748- 1756. doi:10.2134/jeq2002.1748 [31] W. C. Sonzogni, G. Chesters, D. R. Coote, D. N. Jeffs, J. C. Konrad, R. C. Ostry and J. B. Robinson, “Pollution from Land Runoff,” Environmental Science and Tech- nology, Vol. 14, No. 2, 1980, pp. 148-153. doi:10.1021/es60162a003 [32] P. Vervier, S. Bonvallet-Garay, S. Sauvage, H. M. Valett and J. M. Sanchez-Perez, “Influence of the Hyporheic Zone on the Phosphorus Dynamics of a Large Gravel-Bed River, Garonne River, France,” Hydrological Processes, Vol. 23, No. 12, 2009, pp. 1801-1812. doi:10.1002/hyp.7319 [33] C. Liu, J. Lu, and H. Li, “Landward Changes of Soil En- zyme Activities in a Tidal Flat Wetland of the Yangtze River Estuary and Correlations with Physico-Chemical Factors,” Acta Ecologica Sinica, Vol. 27, No. 9, 2007, pp. 3663-3669. doi:10.1016/S1872-2032(07)60079-1 [34] M. Gannon, “Yonkers Told to Pay $1M in Fines”, August 23 2006. Journal News, The Westchester County, NY. [35] New York Times, “Nature’s Fall Palette, Blocks from the Subway,” C27 Friday, November 5, 2010. [36] H. M. Kunishi, A. W. Taylor, W. R. Heald, W. J. Gburek, and R. N. Weaver, “Phosphate Movement from an Agri- cultural Watershed during Two Rainfall Periods”, Journal of Agricultural and Food Chemistry, Vol. 20, No. 4, 1972, pp. 900-905. doi:10.1021/jf60182a026 [37] J. P. E. Anderson and K. H. Domsch, “Quantities of Plant Nutrients in the Microbial Biomass of Selected Soils,” Soil Science, Vol. 130, No. 4, 1980, pp. 211-216. doi:10.1097/00010694-198010000-00008 [38] A. L. Protopapas, “Combined Sewer Overflow Abate- ment: The East River project,” Water Resources Man- agement, Vol. 13, No. 2, 1999, pp.133-151. doi:10.1023/A:1008031716277 [39] P. N. Owens and D. E. Walling, “The Phosphorus Con- tent of Fluvial Sediment in Rural and Industrialized River Basins,” Water Research, Vol. 36, No. 3, 2002, pp. 685- 701. doi:10.1016/S0043-1354(01)00247-0 [40] New York City Department of Parks & Recreation, “Con- crete Plant Park: Bounded by Westerchester Avenue, Bruckner, Boulevard, the Amtrak Railroad, and the Bronx River,” 2009. Retrieved on October 8, 2010, from: http://www.nycgovparks.org/parks/concreteplantpark Michael R. Bloomberg, Mayor-Adrian Benepe, Commis- sioner [41] New York Times, “Rediscovering the Natural side of the Bronx,” C34. Friday, October 8, 2010. Retrieved on Oc- tober 8, 2010, from: http://www.nytimes.com/2010/10/08/nyregion/08bronxto ur.html?_r=2&ref=todayspaper [42] NY1, “Research Project Looks to Restore Oyster Reefs to Harbor,” October 28, 2010. Retrieved on October 28, 2010, from: http://bronx.ny1.com/content/top_stories/127931/research -project-looks-to-restore-oyster-reefs-to-harbor Copyright © 2011 SciRes. JEP  Land Use Impact on Bioavailable Phosphorus in the Bronx River, New York Copyright © 2011 SciRes. JEP 358 [43] Metro New York, “Turning to Oysters for Ecology. New York,” by Carly Baldwin. October 29-30 Friday-Sunday, 2010. Retrieved on October 29, 2010, from: http://www.metro.us/newyork/local/article/676372--turni ng-to-oysters-for-ecology.
|