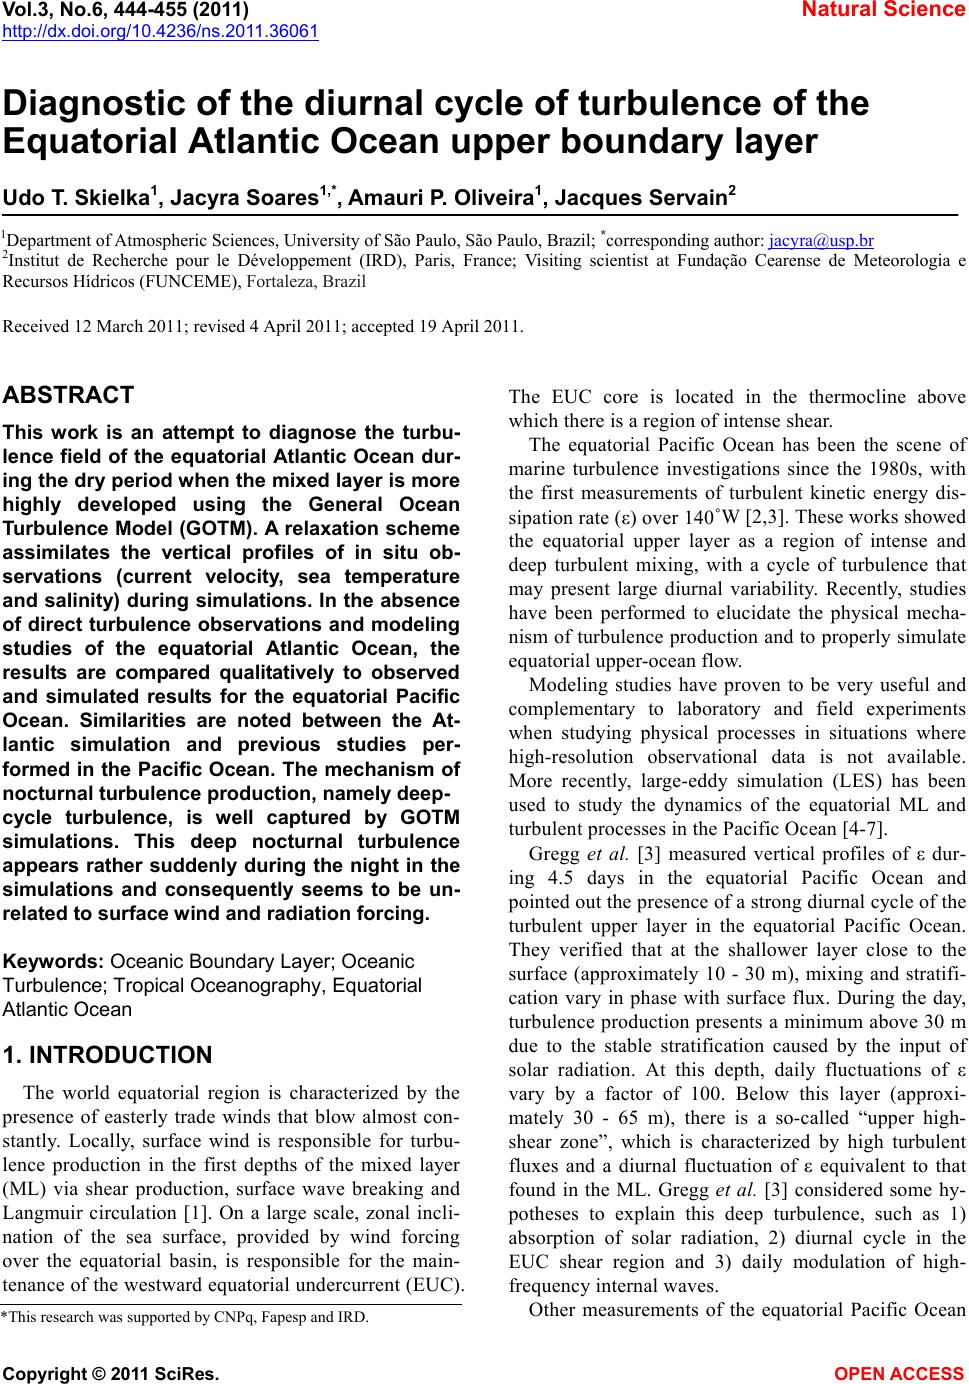
 Vol.3, No.6, 444-455 (2011) Natural Science http://dx.doi.org/10.4236/ns.2011.36061 Copyright © 2011 SciRes. OPEN ACCESS Diagnostic of the diurnal cycle of turbulence of the Equatorial Atlantic Ocean upper boundary layer Udo T. Skielka1, Jacyra Soares1,*, Amauri P. Oliveira1, Jacques Servain2 1Department of Atmospheric Sciences, University of São Paulo, São Paulo, Brazil; *corresponding author: jacyra@usp.br 2Institut de Recherche pour le Développement (IRD), Paris, France; Visiting scientist at Fundação Cearense de Meteorologia e Recursos Hídricos (FUNCEME), Fortaleza, Brazil Received 12 March 2011; revised 4 April 2011; accepted 19 April 2011. ABSTRACT This work is an attempt to diagnose the turbu- lence field of the equatorial Atlantic Ocean dur- ing the dry period when the mixed layer is more highly developed using the General Ocean Turbulence Model (GOTM). A relaxation scheme assimilates the vertical profiles of in situ ob- servations (current velocity, sea temperature and salinity) during simulations. In the absence of direct turbulence observations and modeling studies of the equatorial Atlantic Ocean, the results are compared qualitatively to observed and simulated results for the equatorial Pacific Ocean. Similarities are noted between the At- lantic simulation and previous studies per- formed in the Pacific Ocean. The mechanism of nocturnal turbulence production, namely deep- cycle turbulence, is well captured by GOTM simulations. This deep nocturnal turbulence appears rather suddenly during the night in the simulations and consequently seems to be un- related to surface wind and radiation forcing. Keywords: Oceanic Boundary Layer; Oceanic Turbulence; Tropical Oceanography, Equatorial Atlantic Ocean 1. INTRODUCTION The world equatorial region is characterized by the presence of easterly trade winds that blow almost con- stantly. Locally, surface wind is responsible for turbu- lence production in the first depths of the mixed layer (ML) via shear production, surface wave breaking and Langmuir circulation [1]. On a large scale, zonal incli- nation of the sea surface, provided by wind forcing over the equatorial basin, is responsible for the main- tenance of the westward equatorial undercurrent (EUC). The EUC core is located in the thermocline above which there is a region of intense shear. The equatorial Pacific Ocean has been the scene of marine turbulence investigations since the 1980s, with the first measurements of turbulent kinetic energy dis- sipation rate (ε) over 140˚W [2,3]. These works showed the equatorial upper layer as a region of intense and deep turbulent mixing, with a cycle of turbulence that may present large diurnal variability. Recently, studies have been performed to elucidate the physical mecha- nism of turbulence production and to properly simulate equatorial upper-ocean flow. Modeling studies have proven to be very useful and complementary to laboratory and field experiments when studying physical processes in situations where high-resolution observational data is not available. More recently, large-eddy simulation (LES) has been used to study the dynamics of the equatorial ML and turbulent processes in the Pacific Ocean [4-7]. Gregg et al. [3] measured vertical profiles of ε dur- ing 4.5 days in the equatorial Pacific Ocean and pointed out the presence of a strong diurnal cycle of the turbulent upper layer in the equatorial Pacific Ocean. They verified that at the shallower layer close to the surface (approximately 10 - 30 m), mixing and stratifi- cation vary in phase with surface flux. During the day, turbulence production presents a minimum above 30 m due to the stable stratification caused by the input of solar radiation. At this depth, daily fluctuations of ε vary by a factor of 100. Below this layer (approxi- mately 30 - 65 m), there is a so-called “upper high- shear zone”, which is characterized by high turbulent fluxes and a diurnal fluctuation of ε equivalent to that found in the ML. Gregg et al. [3] considered some hy- potheses to explain this deep turbulence, such as 1) absorption of solar radiation, 2) diurnal cycle in the EUC shear region and 3) daily modulation of high- frequency internal waves. Other measurements of the equatorial Pacific Ocean *This research was supported by CNPq, Fapesp and IRD. 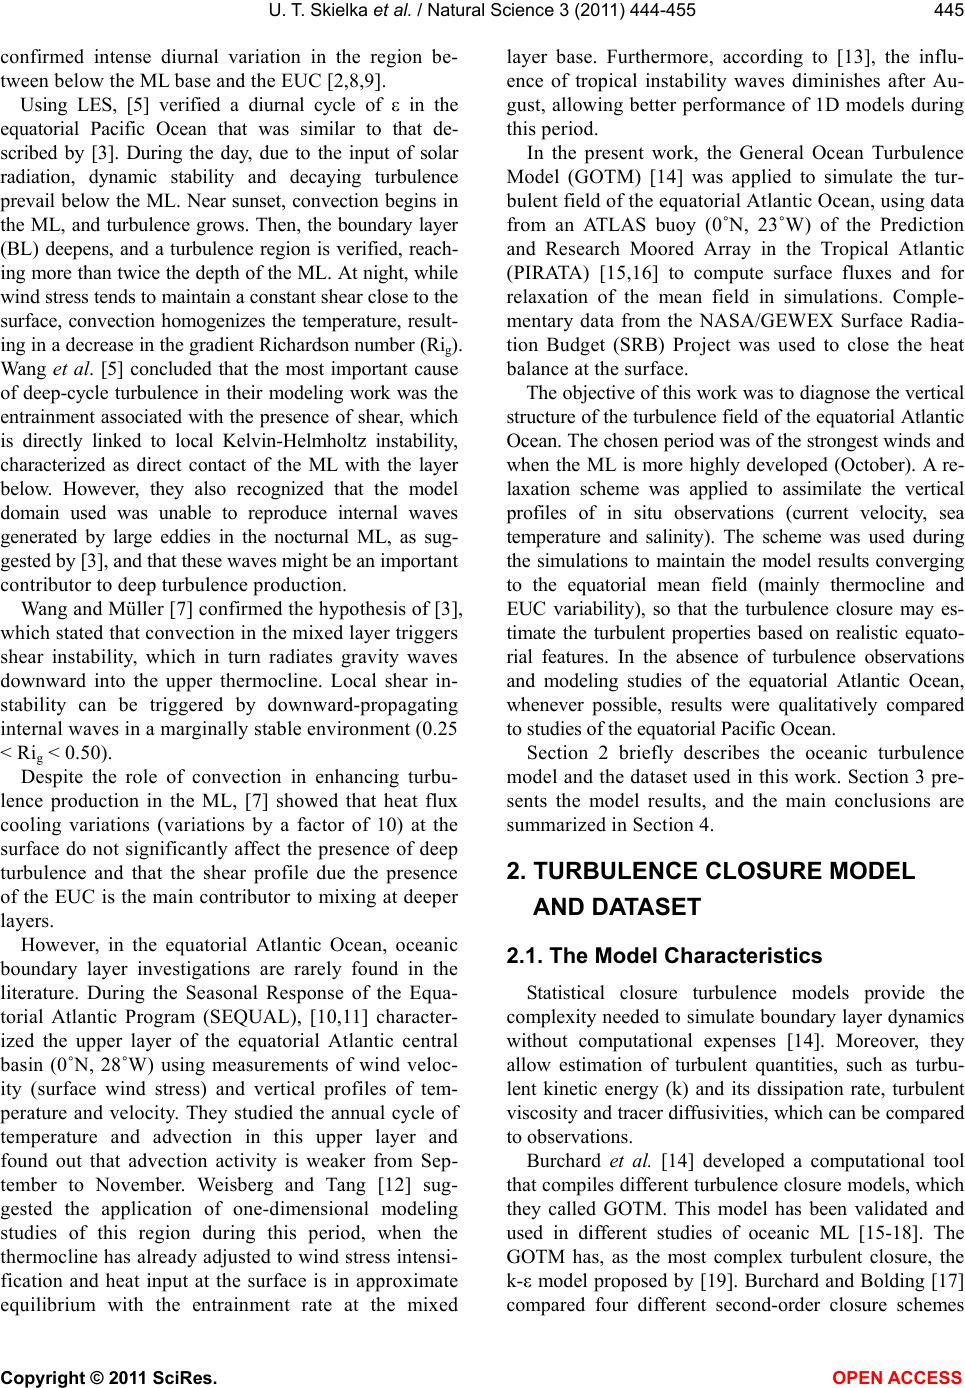 U. T. Skielka et al. / Natural Science 3 (2011) 444-455 Copyright © 2011 SciRes. OPEN ACCESS 445 confirmed intense diurnal variation in the region be- tween below the ML base and the EUC [2,8,9]. Using LES, [5] verified a diurnal cycle of ε in the equatorial Pacific Ocean that was similar to that de- scribed by [3]. During the day, due to the input of solar radiation, dynamic stability and decaying turbulence prevail below the ML. Near sunset, convection begins in the ML, and turbulence grows. Then, the boundary layer (BL) deepens, and a turbulence region is verified, reach- ing more than twice the depth of the ML. At night, while wind stress tends to maintain a constant shear close to the surface, convection homogenizes the temperature, result- ing in a decrease in the gradient Richardson number (Rig). Wang et al. [5] concluded that the most important cause of deep-cycle turbulence in their modeling work was the entrainment associated with the presence of shear, which is directly linked to local Kelvin-Helmholtz instability, characterized as direct contact of the ML with the layer below. However, they also recognized that the model domain used was unable to reproduce internal waves generated by large eddies in the nocturnal ML, as sug- gested by [3], and that these waves might be an important contributor to deep turbulence production. Wang and Müller [7] confirmed the hypothesis of [3], which stated that convection in the mixed layer triggers shear instability, which in turn radiates gravity waves downward into the upper thermocline. Local shear in- stability can be triggered by downward-propagating internal waves in a marginally stable environment (0.25 < Rig < 0.50). Despite the role of convection in enhancing turbu- lence production in the ML, [7] showed that heat flux cooling variations (variations by a factor of 10) at the surface do not significantly affect the presence of deep turbulence and that the shear profile due the presence of the EUC is the main contributor to mixing at deeper layers. However, in the equatorial Atlantic Ocean, oceanic boundary layer investigations are rarely found in the literature. During the Seasonal Response of the Equa- torial Atlantic Program (SEQUAL), [10,11] character- ized the upper layer of the equatorial Atlantic central basin (0˚N, 28˚W) using measurements of wind veloc- ity (surface wind stress) and vertical profiles of tem- perature and velocity. They studied the annual cycle of temperature and advection in this upper layer and found out that advection activity is weaker from Sep- tember to November. Weisberg and Tang [12] sug- gested the application of one-dimensional modeling studies of this region during this period, when the thermocline has already adjusted to wind stress intensi- fication and heat input at the surface is in approximate equilibrium with the entrainment rate at the mixed layer base. Furthermore, according to [13], the influ- ence of tropical instability waves diminishes after Au- gust, allowing better performance of 1D models during this period. In the present work, the General Ocean Turbulence Model (GOTM) [14] was applied to simulate the tur- bulent field of the equatorial Atlantic Ocean, using data from an ATLAS buoy (0˚N, 23˚W) of the Prediction and Research Moored Array in the Tropical Atlantic (PIRATA) [15,16] to compute surface fluxes and for relaxation of the mean field in simulations. Comple- mentary data from the NASA/GEWEX Surface Radia- tion Budget (SRB) Project was used to close the heat balance at the surface. The objective of this work was to diagnose the vertical structure of the turbulence field of the equatorial Atlantic Ocean. The chosen period was of the strongest winds and when the ML is more highly developed (October). A re- laxation scheme was applied to assimilate the vertical profiles of in situ observations (current velocity, sea temperature and salinity). The scheme was used during the simulations to maintain the model results converging to the equatorial mean field (mainly thermocline and EUC variability), so that the turbulence closure may es- timate the turbulent properties based on realistic equato- rial features. In the absence of turbulence observations and modeling studies of the equatorial Atlantic Ocean, whenever possible, results were qualitatively compared to studies of the equatorial Pacific Ocean. Section 2 briefly describes the oceanic turbulence model and the dataset used in this work. Section 3 pre- sents the model results, and the main conclusions are summarized in Section 4. 2. TURBULENCE CLOSURE MODEL AND DATASET 2.1. The Model Characteristics Statistical closure turbulence models provide the complexity needed to simulate boundary layer dynamics without computational expenses [14]. Moreover, they allow estimation of turbulent quantities, such as turbu- lent kinetic energy (k) and its dissipation rate, turbulent viscosity and tracer diffusivities, which can be compared to observations. Burchard et al. [14] developed a computational tool that compiles different turbulence closure models, which they called GOTM. This model has been validated and used in different studies of oceanic ML [15-18]. The GOTM has, as the most complex turbulent closure, the k-ε model proposed by [19]. Burchard and Bolding [17] compared four different second-order closure schemes  U. T. Skielka et al. / Natural Science 3 (2011) 444-455 Copyright © 2011 SciRes. OPEN ACCESS 446 and concluded that the closure scheme of [19] is the most efficient scheme for simulating the ML in idealized and applied cases. The implementation of the GOTM in the laboratory involved the test of different hydrodynamic cases, ideal- ized and applied to natural waters, available at the model’s website (www.gotm.net). Afterwards, the model was run using the PIRATA dataset. The model uses dynamic equations to compute k and ε. Eq.1 describes the terms used to analyze the upper layer turbulent field, where ∂tk is the local time varia- tion of k: tkPBD (1) P is the shear or mechanical production of k: 2 t PS (2) where t is the turbulent viscosity computed by the model, and S is the current shear, given by: 222 zz Suv (3) where u and v are the mean zonal and meridional current velocity, respectively, and z the vertical derivative. B is the buoyancy production/dissipation of k: 2 t BKN (4) which depends on the turbulent heat diffusivity (Kt) and the static stability of the water column, given by the buoyancy frequency (2 N): 2 0 z g N (5) where g (9.81 m·s–2) is the acceleration of gravity, ρ is the density, computed using the UNESCO algorithm [20], and ρ0 (1027 kg·m–3) is the reference density. The vertical diffusion of k (D) depends on the Schmidt number for k (σk), which is an empirical constant: t zz k Dk (6) The viscous dissipation rate of turbulent kinetic en- ergy (ε) is given by Eq.7, which is a linear combination of the terms of Eq.1 with the semi-empirical parameters cε1, cε2, cε3 and a vertical diffusion term (Tε). Further de- tails can be found in [14]. 132tcP cB cT k (7) The model uses the eddy viscosity principle, obtaining the turbulent viscosity and diffusivity using k, ε and a non-dimensional constant of proportionality called the stability function, which contains the information of the second-order closure. 2.2. Dataset The region investigated was the equatorial Atlantic central basin, at (0˚N, 23˚W), where an ATLAS mooring has existed since 1999 as part of the PIRATA backbone project. The buoy provides high frequency (every 10 minutes) measurements of air temperature and relative humidity, wind direction and velocity, incoming short- wave radiation and precipitation at the sea surface and vertical profiles (0 - 500 m) of temperature and salinity. Moreover, this PIRATA mooring is the only buoy of the array that measures the two components of the oceanic current by an Acoustic Doppler Current Profiler with a 4-m vertical resolution from the surface to approxi- mately 100 m [21,22]. The surface radiation balance was obtained using ob- served incoming shortwave radiation from the same PI- RATA buoy and the other radiation components, upward shortwave and downward and upward longwave radia- tions, from the SRB-NASA. The SRB-NASA estimates radiative parameters globally, with 1˚ X 1˚ resolution, using satellite products, meteorological inputs from re- analysis and radiative transfer algorithms (SRB, http://gewex-srb.larc.nasa.gov). Studies at the Air-Sea Interaction Research Lab-USP showed good agreement between the SRB-NASA dataset and the PIRATA in situ measurements [23]. The climatologic hourly averages of the SRB-NASA data from 1999 to 2005, the last year of available satellite data, were computed. Table 1 summa- rizes the data set used in this work. The bulk algorithm developed during the TOGA COARE [24] was used to compute atmospheric turbu- lent fluxes, with the observed air temperature and hu- midity, horizontal wind components and SST obtained using 10-minute averaged values of the PIRATA dataset Table 1. Dataset used in numerical experiments. Surface tur- bulent fluxes were computed using the COARE bulk algorithm with PIRATA measurements. PIRATA (0˚N, 23˚W) (2000-2006) SRB-NASA (1999-2005) Specification on the model Air Wind velocity Air temperature Air specific hu- midity Incoming shortwave radia- tion Upward shortwave radiation Down- ward and upward longwave radia- tions Upper boundary conditions: Sur- face wind stress Surface energy balance Ocean column Vertical profiles of: Sub-surface temperature Salinity Current velocity _____________ Relaxation scheme  U. T. Skielka et al. / Natural Science 3 (2011) 444-455 Copyright © 2011 SciRes. OPEN ACCESS 447 over the period from 2000 to 2006. These fluxes were then averaged hourly using approximately 7 years of data (considering some gaps, which were different for each variable), resulting in an annual data series for each variable used in the simulations. Figure 1 shows a meteorological characterization of the investigated region (0˚N, 23˚W) using PIRATA data from 2000 to 2006. During the first semester of the year, the Intertropical Convergence Zone (ITCZ) is located over the region; therefore, wind velocity is weaker, air humidity, air temperature and SST are higher, and pre- cipitation presents higher values. From June to Decem- ber, when ITCZ is displaced northward, easterly trade winds intensify, air humidity, SST and air temperatures (a) (b) (c) (d) Figure 1. Monthly variation at (0˚N, 23˚W), averaged during 2000-2006 from the PIRATA dataset, of the (a) zonal com- ponent (u, grey dotted line), meridional component (v, grey solid line) and total (│v│, black line) wind velocity; (b) air temperature (Tair, black line) and SST (grey line); (c) air spe- cific humidity (qair, black line) and surface saturation specific humidity (q0, grey line); and (d) accumulated precipitation. drop, and a dry season may be observed. Therefore, drop, and a dry season may be observed. Therefore, mixing in the ocean must be pronounced during the second period of the year, as winds are higher and precipitation is lower. 2.3. Boundary Conditions Bulk formulae from the TOGA COARE algorithm [24], described by Eqs.8-10, were used as superior boundary conditions, where Eq.8 is the surface stress components , y , Eq.9 gives the latent heat flux (Qe), and Eq.10 is the sensible heat flux (Qh). The surface fluxes were computed using PIRATA dataset. Complementary data from the SRB Project was used to close the heat balance at the surface. adx a CVu ; ady a CVv (8) 0eave a QLCVqq (9) haph a QcC VSST (10) ua and va are the horizontal wind components; qa is the air specific humidity, and q0 is the specific humidity ob- tained using the sea surface temperature (SST) in the Bolton equation for vapor pressure [25]; θa is the air potential temperature, and V is the wind module given by 1/2 22 2 aa g Vu v w, where wg is a gustiness wind component, preventing null fluxes when there are no horizontal winds. The constants are air density, ρa, com- puted using the gas law for a constant pressure atmos- pheric pressure of 1008 hPa; specific heat at constant pressure, cp (= 1004.67 J·kg–1·K–1) and evaporation latent heat Lv (= 2.5 10+6 - 2370 SST) J·kg–1. Transfer coeffi- cients (Cdx, Cdy, Ce, Ch) are obtained based on the Monin-Obukhov Similarity Theory for the atmospheric surface layer. Additional details about the bulk algo- rithms can be found in [24,26]. The heat balance at the surface and boundary condition for the heat conservation equation in the model is given by: 0nbeh QQQQI (11) where Qn is the net heat flux, Qb is the net longwave, also known as backward radiation, and I0 is the net shortwave radiation. By convention, the heat gain (lost) by the ocean is considered positive (negative). Therefore, the ocean loses energy when the heat flux occurs outward from the surface. No surface freshwater flux is used for the salinity equation. To compute solar radiation attenuation and absorption in the water column, the model uses an exponential de- caying expression as a function of depth, which also depends on the net shortwave radiation at the surface and 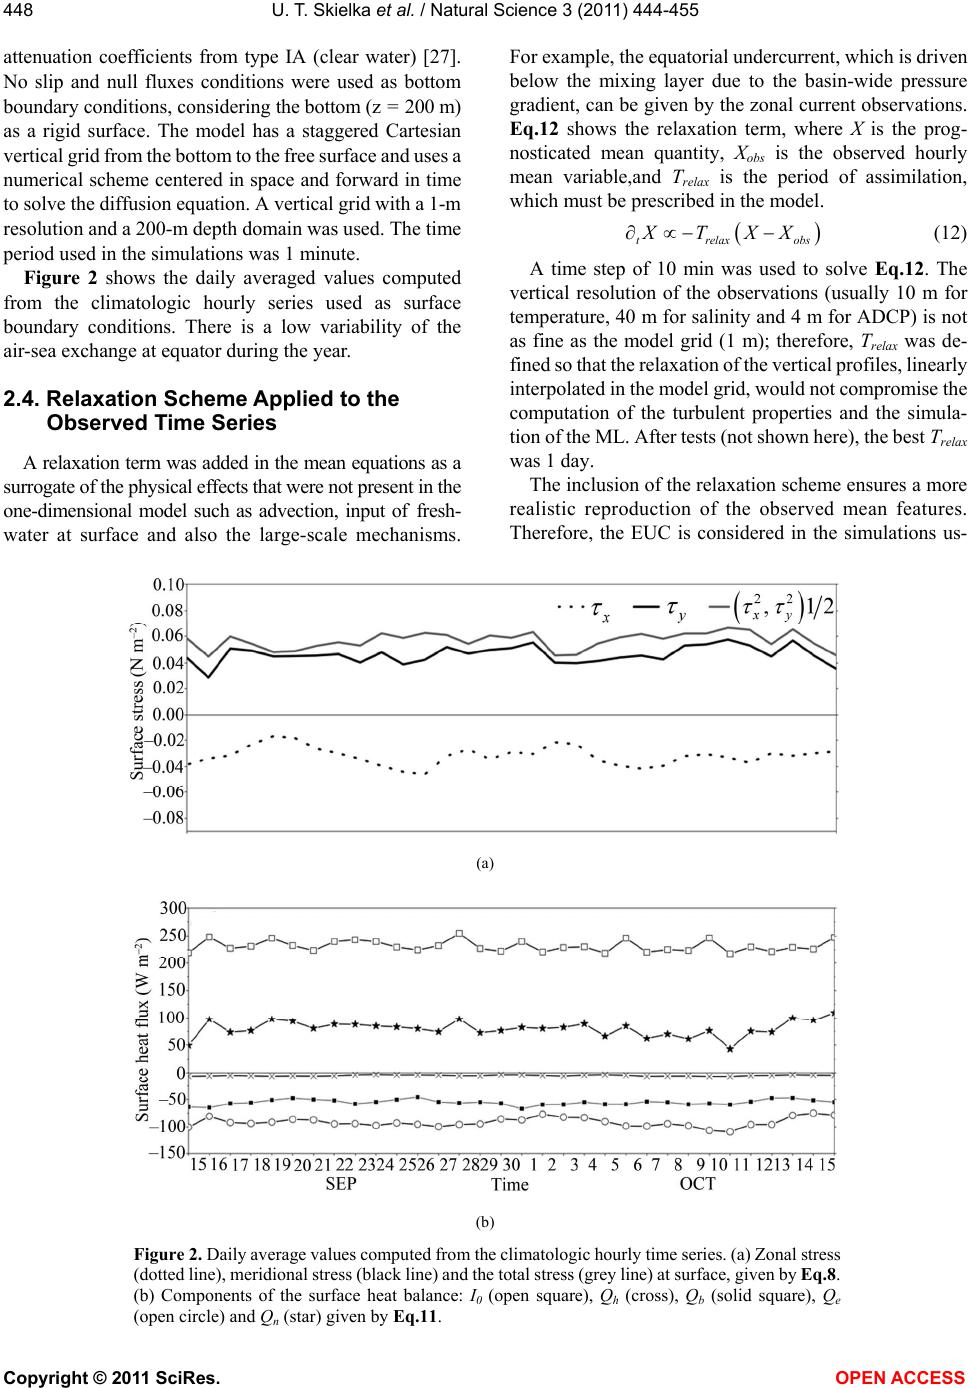 U. T. Skielka et al. / Natural Science 3 (2011) 444-455 Copyright © 2011 SciRes. OPEN ACCESS 448 attenuation coefficients from type IA (clear water) [27]. No slip and null fluxes conditions were used as bottom boundary conditions, considering the bottom (z = 200 m) as a rigid surface. The model has a staggered Cartesian vertical grid from the bottom to the free surface and uses a numerical scheme centered in space and forward in time to solve the diffusion equation. A vertical grid with a 1-m resolution and a 200-m depth domain was used. The time period used in the simulations was 1 minute. Figure 2 shows the daily averaged values computed from the climatologic hourly series used as surface boundary conditions. There is a low variability of the air-sea exchange at equator during the year. 2.4. Relaxation Scheme Applied to the Observed Time Series A relaxation term was added in the mean equations as a surrogate of the physical effects that were not present in the one-dimensional model such as advection, input of fresh- water at surface and also the large-scale mechanisms. For example, the equatorial undercurrent, which is driven below the mixing layer due to the basin-wide pressure gradient, can be given by the zonal current observations. Eq.12 shows the relaxation term, where X is the prog- nosticated mean quantity, X obs is the observed hourly mean variable,and Trelax is the period of assimilation, which must be prescribed in the model. trelax obs XTXX (12) A time step of 10 min was used to solve Eq.12. The vertical resolution of the observations (usually 10 m for temperature, 40 m for salinity and 4 m for ADCP) is not as fine as the model grid (1 m); therefore, Trelax was de- fined so that the relaxation of the vertical profiles, linearly interpolated in the model grid, would not compromise the computation of the turbulent properties and the simula- tion of the ML. After tests (not shown here), the best Trelax was 1 day. The inclusion of the relaxation scheme ensures a more realistic reproduction of the observed mean features. Therefore, the EUC is considered in the simulations us- (a) (b) Figure 2. Daily average values computed from the climatologic hourly time series. (a) Zonal stress (dotted line), meridional stress (black line) and the total stress (grey line) at surface, given by Eq.8. (b) Components of the surface heat balance: I0 (open square), Qh (cross), Qb (solid square), Qe (open circle) and Qn (star) given by Eq.11. 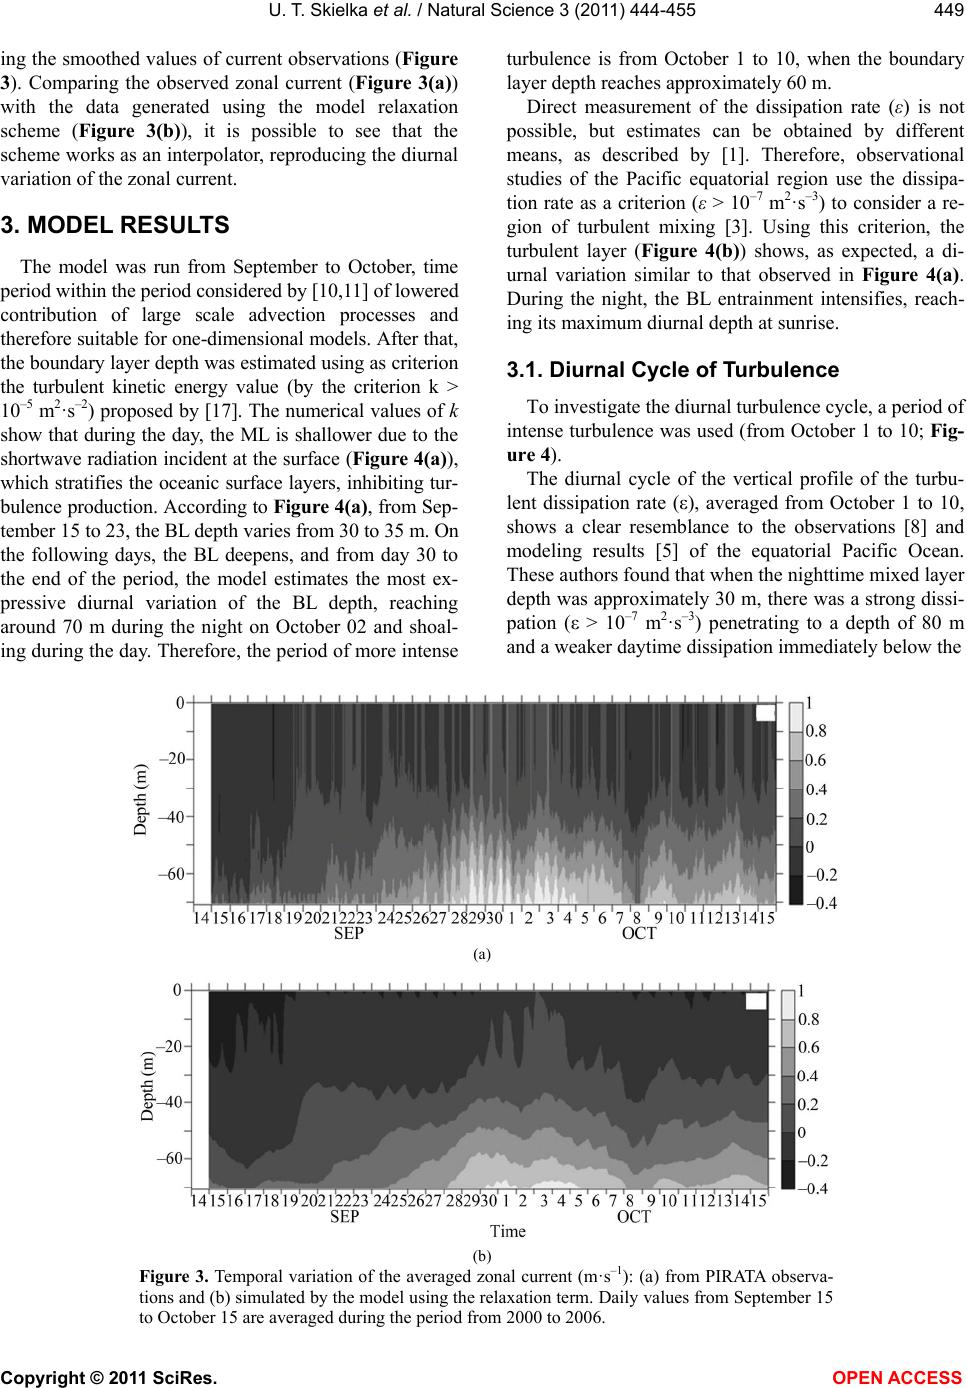 U. T. Skielka et al. / Natural Science 3 (2011) 444-455 Copyright © 2011 SciRes. OPEN ACCESS 449 ing the smoothed values of current observations (Figure 3). Comparing the observed zonal current (Figure 3(a)) with the data generated using the model relaxation scheme (Figure 3(b)), it is possible to see that the scheme works as an interpolator, reproducing the diurnal variation of the zonal current. 3. MODEL RESULTS The model was run from September to October, time period within the period considered by [10,11] of lowered contribution of large scale advection processes and therefore suitable for one-dimensional models. After that, the boundary layer depth was estimated using as criterion the turbulent kinetic energy value (by the criterion k > 10–5 m2·s–2) proposed by [17]. The numerical values of k show that during the day, the ML is shallower due to the shortwave radiation incident at the surface (Figure 4(a)), which stratifies the oceanic surface layers, inhibiting tur- bulence production. According to Figure 4(a), from Sep- tember 15 to 23, the BL depth varies from 30 to 35 m. On the following days, the BL deepens, and from day 30 to the end of the period, the model estimates the most ex- pressive diurnal variation of the BL depth, reaching around 70 m during the night on October 02 and shoal- ing during the day. Therefore, the period of more intense turbulence is from October 1 to 10, when the boundary layer depth reaches approximately 60 m. Direct measurement of the dissipation rate (ε) is not possible, but estimates can be obtained by different means, as described by [1]. Therefore, observational studies of the Pacific equatorial region use the dissipa- tion rate as a criterion (ε > 10–7 m2·s–3) to consider a re- gion of turbulent mixing [3]. Using this criterion, the turbulent layer (Figure 4(b)) shows, as expected, a di- urnal variation similar to that observed in Figure 4(a). During the night, the BL entrainment intensifies, reach- ing its maximum diurnal depth at sunrise. 3.1. Diurnal Cycle of Turbulence To investigate the diurnal turbulence cycle, a period of intense turbulence was used (from October 1 to 10; Fig- ure 4). The diurnal cycle of the vertical profile of the turbu- lent dissipation rate (ε), averaged from October 1 to 10, shows a clear resemblance to the observations [8] and modeling results [5] of the equatorial Pacific Ocean. These authors found that when the nighttime mixed layer depth was approximately 30 m, there was a strong dissi- pation (ε > 10–7 m 2·s–3) penetrating to a depth of 80 m and a weaker daytime dissipation immediately below the (a) (b) Figure 3. Temporal variation of the averaged zonal current (m·s–1): (a) from PIRATA observa- tions and (b) simulated by the model using the relaxation term. Daily values from September 15 to October 15 are averaged during the period from 2000 to 2006. 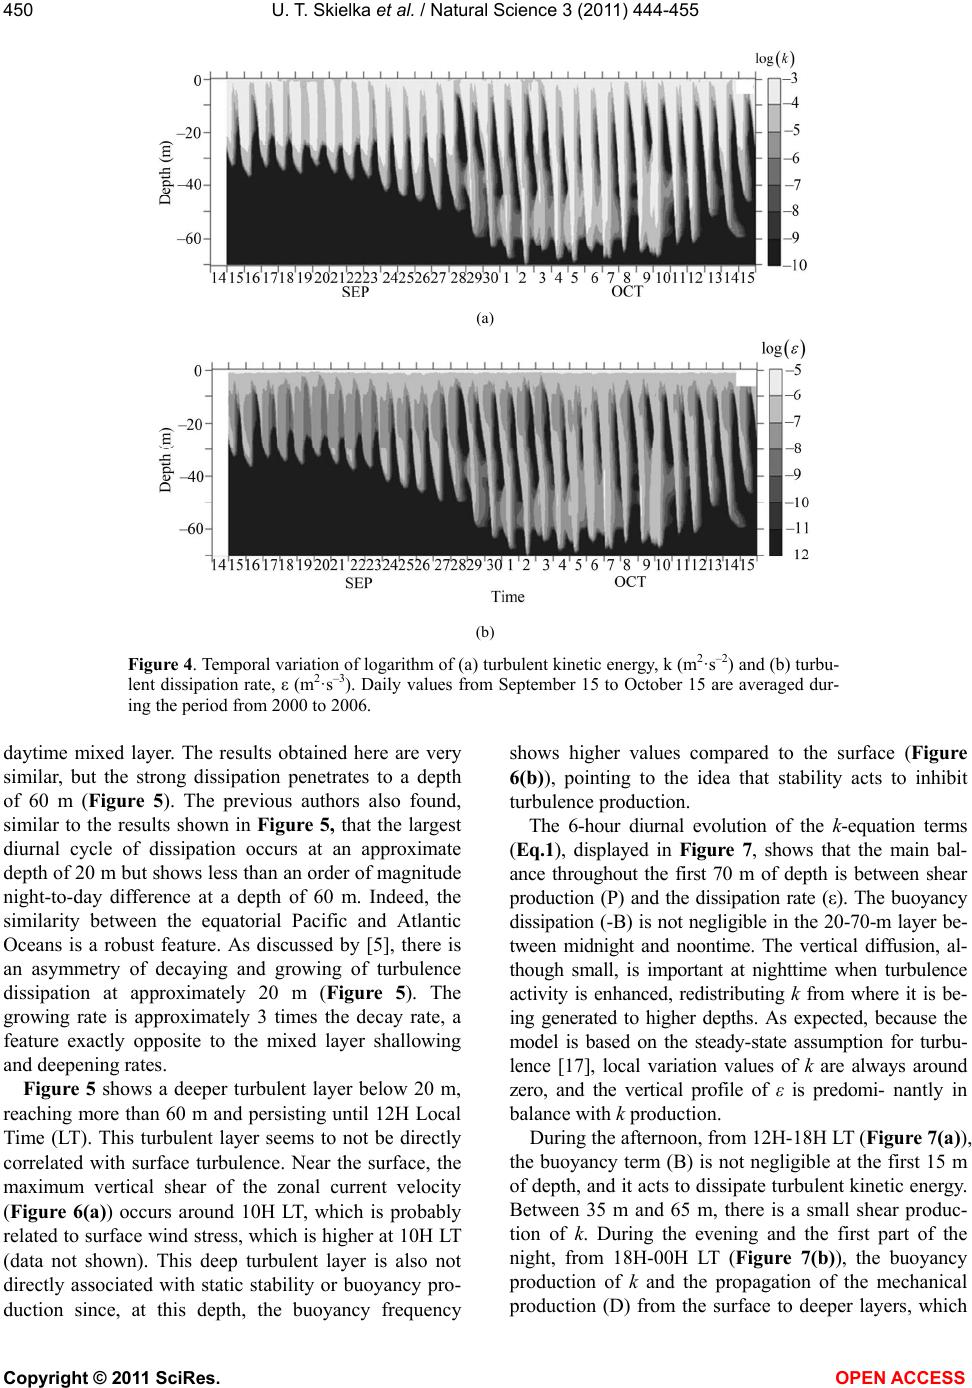 U. T. Skielka et al. / Natural Science 3 (2011) 444-455 Copyright © 2011 SciRes. OPEN ACCESS 450 (a) (b) Figure 4. Temporal variation of logarithm of (a) turbulent kinetic energy, k (m2·s–2) and (b) turbu- lent dissipation rate, ε (m2·s–3). Daily values from September 15 to October 15 are averaged dur- ing the period from 2000 to 2006. daytime mixed layer. The results obtained here are very similar, but the strong dissipation penetrates to a depth of 60 m (Figure 5). The previous authors also found, similar to the results shown in Figure 5, that the largest diurnal cycle of dissipation occurs at an approximate depth of 20 m but shows less than an order of magnitude night-to-day difference at a depth of 60 m. Indeed, the similarity between the equatorial Pacific and Atlantic Oceans is a robust feature. As discussed by [5], there is an asymmetry of decaying and growing of turbulence dissipation at approximately 20 m (Figure 5). The growing rate is approximately 3 times the decay rate, a feature exactly opposite to the mixed layer shallowing and deepening rates. Figure 5 shows a deeper turbulent layer below 20 m, reaching more than 60 m and persisting until 12H Local Time (LT). This turbulent layer seems to not be directly correlated with surface turbulence. Near the surface, the maximum vertical shear of the zonal current velocity (Figure 6(a)) occurs around 10H LT, which is probably related to surface wind stress, which is higher at 10H LT (data not shown). This deep turbulent layer is also not directly associated with static stability or buoyancy pro- duction since, at this depth, the buoyancy frequency shows higher values compared to the surface (Figure 6(b)), pointing to the idea that stability acts to inhibit turbulence production. The 6-hour diurnal evolution of the k-equation terms (Eq.1), displayed in Figure 7, shows that the main bal- ance throughout the first 70 m of depth is between shear production (P) and the dissipation rate (ε). The buoyancy dissipation (-B) is not negligible in the 20-70-m layer be- tween midnight and noontime. The vertical diffusion, al- though small, is important at nighttime when turbulence activity is enhanced, redistributing k from where it is be- ing generated to higher depths. As expected, because the model is based on the steady-state assumption for turbu- lence [17], local variation values of k are always around zero, and the vertical profile of ε is predomi- nantly in balance with k production. During the afternoon, from 12H-18H LT (Figure 7(a)), the buoyancy term (B) is not negligible at the first 15 m of depth, and it acts to dissipate turbulent kinetic energy. Between 35 m and 65 m, there is a small shear produc- tion of k. During the evening and the first part of the night, from 18H-00H LT (Figure 7(b)), the buoyancy production of k and the propagation of the mechanical production (D) from the surface to deeper layers, which 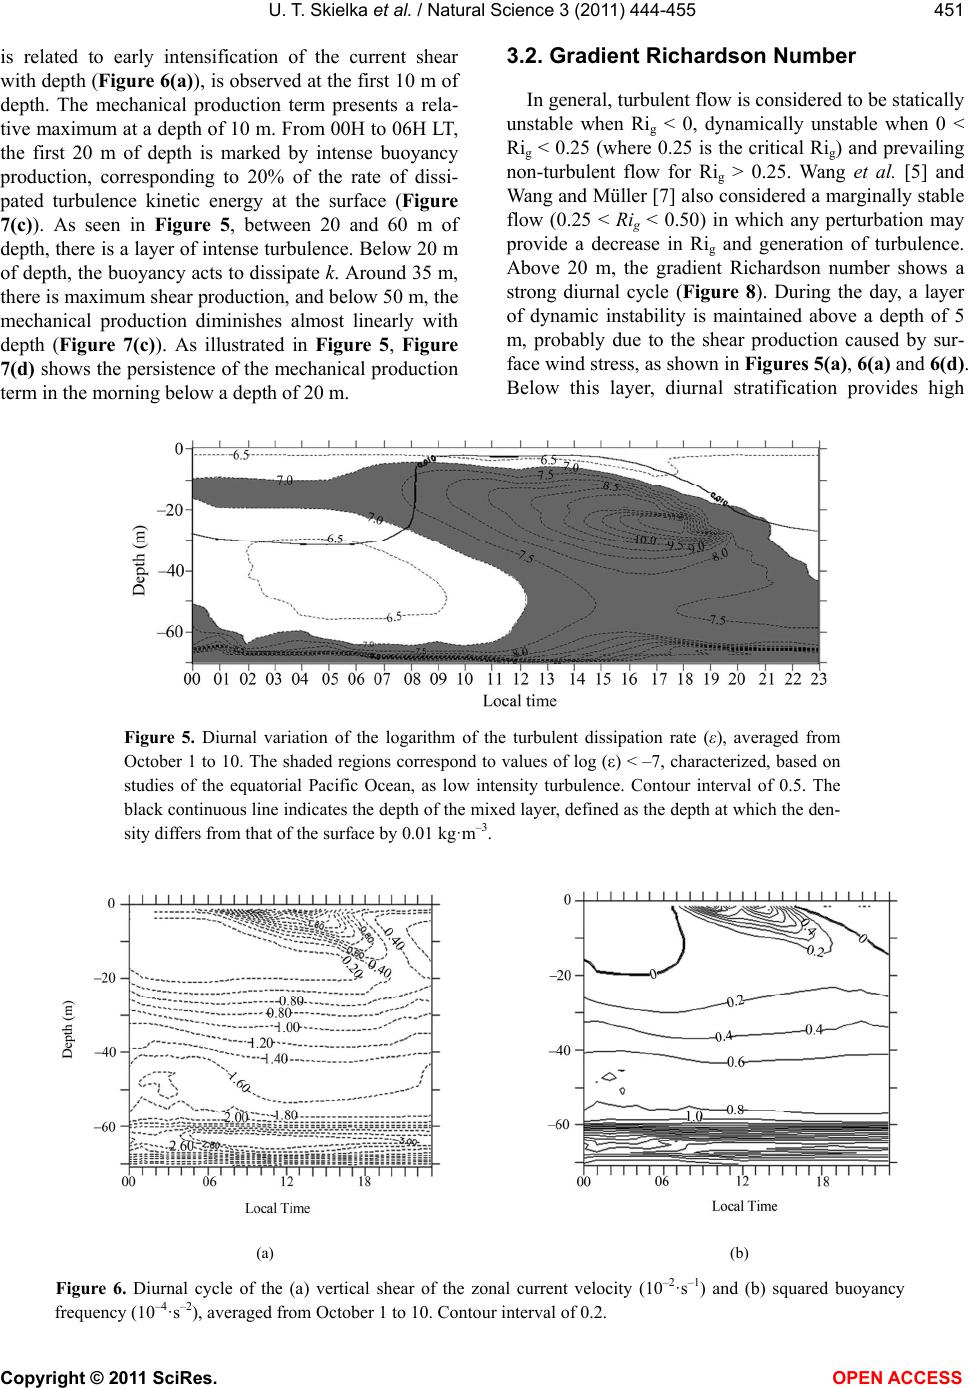 U. T. Skielka et al. / Natural Science 3 (2011) 444-455 Copyright © 2011 SciRes. OPEN ACCESS 451 is related to early intensification of the current shear with depth (Figure 6(a)), is observed at the first 10 m of depth. The mechanical production term presents a rela- tive maximum at a depth of 10 m. From 00H to 06H LT, the first 20 m of depth is marked by intense buoyancy production, corresponding to 20% of the rate of dissi- pated turbulence kinetic energy at the surface (Figure 7(c)). As seen in Figure 5, between 20 and 60 m of depth, there is a layer of intense turbulence. Below 20 m of depth, the buoyancy acts to dissipate k. Around 35 m, there is maximum shear production, and below 50 m, the mechanical production diminishes almost linearly with depth (Figure 7(c)). As illustrated in Figure 5, Figure 7(d) shows the persistence of the mechanical production term in the morning below a depth of 20 m. 3.2. Gradient Richardson Number In general, turbulent flow is considered to be statically unstable when Rig < 0, dynamically unstable when 0 < Rig < 0.25 (where 0.25 is the critical Rig) and prevailing non-turbulent flow for Rig > 0.25. Wang et al. [5] and Wang and Müller [7] also considered a marginally stable flow (0.25 < Rig < 0.50) in which any perturbation may provide a decrease in Rig and generation of turbulence. Above 20 m, the gradient Richardson number shows a strong diurnal cycle (Figure 8). During the day, a layer of dynamic instability is maintained above a depth of 5 m, probably due to the shear production caused by sur- face wind stress, as shown in Figures 5(a), 6(a) and 6(d). Below this layer, diurnal stratification provides high Figure 5. Diurnal variation of the logarithm of the turbulent dissipation rate (ε), averaged from October 1 to 10. The shaded regions correspond to values of log (ε) < –7, characterized, based on studies of the equatorial Pacific Ocean, as low intensity turbulence. Contour interval of 0.5. The black continuous line indicates the depth of the mixed layer, defined as the depth at which the den- sity differs from that of the surface by 0.01 kg·m–3. (a) (b) Figure 6. Diurnal cycle of the (a) vertical shear of the zonal current velocity (10–2·s–1) and (b) squared buoyancy frequency (10–4·s–2), averaged from October 1 to 10. Contour interval of 0.2. 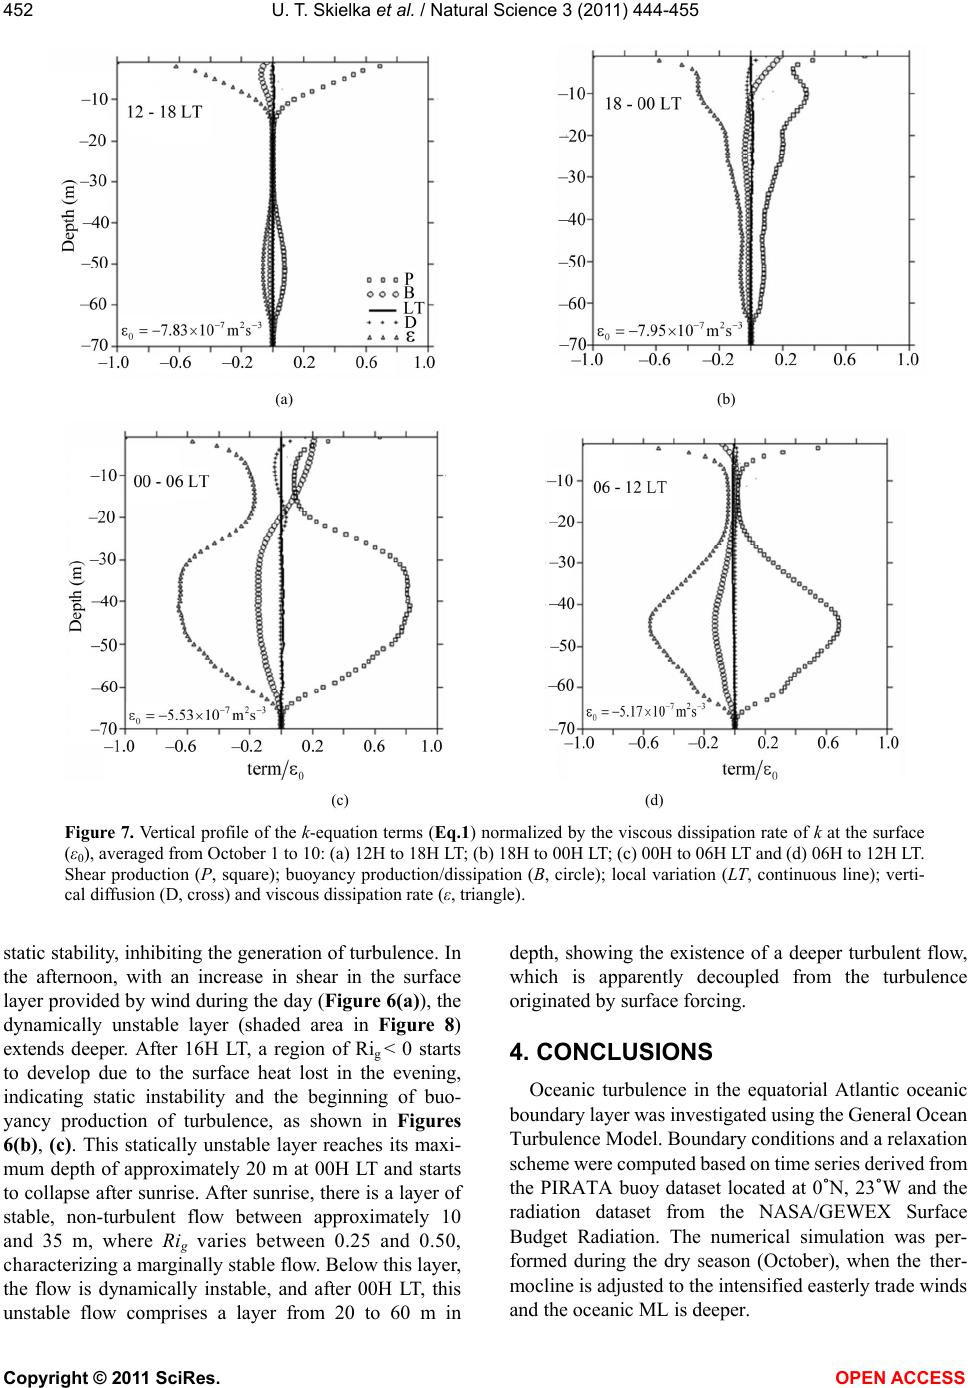 U. T. Skielka et al. / Natural Science 3 (2011) 444-455 Copyright © 2011 SciRes. OPEN ACCESS 452 (a) (b) (c) (d) Figure 7. Vertical profile of the k-equation terms (Eq.1) normalized by the viscous dissipation rate of k at the surface (ε0), averaged from October 1 to 10: (a) 12H to 18H LT; (b) 18H to 00H LT; (c) 00H to 06H LT and (d) 06H to 12H LT. Shear production (P, square); buoyancy production/dissipation (B, circle); local variation (LT, continuous line); verti- cal diffusion (D, cross) and viscous dissipation rate (ε, triangle). static stability, inhibiting the generation of turbulence. In the afternoon, with an increase in shear in the surface layer provided by wind during the day (Figure 6(a)), the dynamically unstable layer (shaded area in Figure 8) extends deeper. After 16H LT, a region of Rig < 0 starts to develop due to the surface heat lost in the evening, indicating static instability and the beginning of buo- yancy production of turbulence, as shown in Figures 6(b), (c). This statically unstable layer reaches its maxi- mum depth of approximately 20 m at 00H LT and starts to collapse after sunrise. After sunrise, there is a layer of stable, non-turbulent flow between approximately 10 and 35 m, where Rig varies between 0.25 and 0.50, characterizing a marginally stable flow. Below this layer, the flow is dynamically instable, and after 00H LT, this unstable flow comprises a layer from 20 to 60 m in depth, showing the existence of a deeper turbulent flow, which is apparently decoupled from the turbulence originated by surface forcing. 4. CONCLUSIONS Oceanic turbulence in the equatorial Atlantic oceanic boundary layer was investigated using the General Ocean Turbulence Model. Boundary conditions and a relaxation scheme were computed based on time series derived from the PIRATA buoy dataset located at 0˚N, 23˚W and the radiation dataset from the NASA/GEWEX Surface Budget Radiation. The numerical simulation was per- formed during the dry season (October), when the ther- mocline is adjusted to the intensified easterly trade winds and the oceanic ML is deeper.  U. T. Skielka et al. / Natural Science 3 (2011) 444-455 Copyright © 2011 SciRes. OPEN ACCESS 453 Figure 8. Diurnal variation of the gradient Richardson number, averaged from October 1 to 10. The shaded area corresponds to a dynamically unstable flow (0.00 < Rig< 0.25). Dashed and continuous lines indicate, negative and positive values of Rig, respectively. It was found that during the day, the ML depth is restricted to less than 10 m due to buoyancy suppression caused by solar radiation. In this case, turbulence is maintained by the shear provided by wind stress. At night, the entrain- ment rate is positive due to the static instability provided by the surface heat lost at night, when buoyancy con- tributes to turbulent kinetic energy production until an approximate depth of 20 m. Surface turbulence dimin- ishes after 00H LT due to the diurnal decrease in wind stress. After sunset, re-stratification of this surface layer occurs. At night, the model results indicated the existence of a deeper turbulence. According to laboratory [28] and modeling [7] studies, this deeper turbulence is generated by the breaking of internal waves in the statically stable region combined with intense shear due to the presence of the equatorial undercurrent. Linden [28] showed that over oceanic regions, the energy provided by wind to the mixed layer may radiate energy to higher depths beyond the generation of internal waves. In the equatorial ocean, these waves break when they reach the intense shear deeper layer, above the equatorial undercurrent core, inducing dynamical instability of the flow, a feature that was modeled by [7] using LES. The turbulent closure scheme used in this work was able to reproduce this deeper turbulence, based on the mean field provided by the observed vertical profiles, which appears from depths of 20 m to more than 60 m. At this layer, the model identified an enhancement of shear production and a buoyancy contribution to the dissipation of turbulent kinetic energy. The gradient Richardson number also indicated the presence of a strong diurnal cycle, above 20 m. During the day, a layer of dynamic instability is maintained above a depth of 5 m, probably due to the shear produc- tion caused by surface wind stress. Below this layer, diurnal stratification provides high static stability, inhib- iting the generation of turbulence. In the afternoon, with an increase in shear in the surface layer provided by wind during the day, the dynamically unstable layer extends deeper. After 16H LT, a region of instability starts to develop due to the surface heat loss in the evening. This statically unstable layer reaches its maximum depth of approximately 20 m at 00H LT and starts to collapse after sunrise. After sunrise, there is a layer of stable, non- turbulent flow between approximately 10 and 35 m. Be- low this layer, the flow is dynamically instable, and after 00H LT, this unstable flow comprises a layer from 20 to 60 m in depth, showing the existence of a deeper turbu- lent flow, which is apparently decoupled from the turbu- lence originated by surface forcing. The diurnal variation and magnitude of the boundary layer estimated by the model is in quantitative agreement with studies performed in the equatorial Pacific Ocean. Considering the differences related to the applied meth- odology (using a less complex and general model in this work) and the differences about the basin scales of the two oceanic regions, resulting in different equatorial dynamics [29], the results using GOTM, with relaxation scheme to assimilate data, showed similarities with pre- vious studies performed in the Pacific Ocean. Both mechanisms of nocturnal turbulence production (deep-cycle turbulence) are captured by GOTM simula- tions. As shown in the results of this study, deep noctur- nal turbulence appears to be unrelated to surface forcing generated turbulence, as it appears rather suddenly dur- ing the night in the simulations (Figures 5 and 6). REFERENCES [1] Thorpe, S.A. (2004) Recent development in the study of ocean turbulence. Annual Review of Earth and Planetary Sciences, 32, 91-109. doi:10.1146/annurev.earth.32.071603.152635 [2] Moum, J.N. and Caldwell, D.R. (1985) Local influences on the shear-flow turbulence in the equatorial ocean. Science, 230, 315-316. doi:10.1126/science.230.4723.315  U. T. Skielka et al. / Natural Science 3 (2011) 444-455 Copyright © 2011 SciRes. OPEN ACCESS 454 [3] Gregg, M.C., Peters, H., Wesson, J.C., Oakey, N.S and Shay, T.J. (1985) Intensive measurements of turbulence and shear in the equatorial undercurrent. Nature, 318, 140-144. doi:10.1038/318140a0 [4] Wang, D., Large, W.G. and McWilliams, J.C. (1996) Large-eddy simulation of the equatorial ocean boundary layer: Diurnal cycle, eddy viscosity and horizontal rotation. Journal of Geophysical Research, 101, 3649- 3662. doi:10.1029/95JC03441 [5] Wang, D., Large, W.G. and McWilliams, J.C. (1998) Large-eddy simulation of the diurnal cycle of deep equatorial turbulence. Journal of Physical Oceanography, 28, 129-148. doi:10.1175/1520-0485(1998)028<0129:LESOTD>2.0.C O;2 [6] Skyllingstad, E.D., Smyth, W.D., Moum J.N. and Wijesekera, H. (1999) Upper-ocean turbulence during a westerly wind burst: A comparison of large-eddy simu- lation results and microstructure measurements. Journal of Physical Oceanography, 29, 5-28. doi:10.1175/1520-0485(1999)029<0005:UOTDAW>2.0. CO;2 [7] Wang, D. and Müller, P. (2002) Effects of equatorial undercurrent shear on upper-ocean mixing and internal waves. Journal of Physical Oceanography, 32, 1041-1057. doi:10.1175/1520-0485(2002)032<1041:EOEUSO>2.0.C O;2 [8] Lien, R.-C., Caldwell, D.R., Gregg, M.C. and Moum, J.N. (1995) Turbulence variability at the equator in the central Pacific at the beginning of the 1991-1993 El Niño. Journal of Geophysical Research, 100, 6881-6898. doi:10.1029/94JC03312 [9] McPhaden, M.J. and Peters, H. (1992) Diurnal cycle of internal wave variability in the equatorial Pacific Ocean: Results from moored observations. Journal of Physical Oceanography, 22, 1317-1329. doi:10.1175/1520-0485(1992)022<1317:DCOIWV>2.0. CO;2 [10] Weingartner, T.J. and Weisberg, R.H. (1991) On the annual cycle of equatorial upwelling in the Central Atlantic Ocean. Journal of Physical Oceanography, 21, 68-82. doi:10.1175/1520-0485(1991)021<0068:OTACOE>2.0. CO;2 [11] Weingartner, T.J. and Weisberg, R.H. (1991) A descrip- tion of the annual cycle in sea surface temperature and upper ocean heat in the Equatorial Atlantic. Journal of Physical Oceanography, 21, 83-96. doi:10.1175/1520-0485(1991)021<0083:ADOTAC>2.0. CO;2 [12] Weisberg, T.J. and Tang, T.Y. (1987) Further studies on the response of the equatorial thermocline in the Atlantic Ocean to the seasonal varying trade winds. Journal of Geophysical Research, 92, 3709-3728. doi:10.1029/JC092iC04p03709 [13] Grodsky, S.A., Carton, J.A., Provost C., Servain, J., Lorenzetti, J.A. and McPhaden, M.J. (2005) Tropical instability waves at 0˚N, 23˚W in the Atlantic: A case study using PIRATA mooring data. Journal of Geo- physical Research, 110, C08010. doi:10.1029/2005JC002941 [14] Burchard, H., Bolding, K. and Villarreal, M. (1999) GOTM—a general ocean turbulence model. theory, ap- plications and test cases. European Commission Report EUR, European Commission. [15] Burchard, H. and Bolding, K. (2001) Comparative analy- sis of four second-moment turbulence closure models for the oceanic mixed layer. Journal of Physical Oceano- graphy, 31, 1943-1968. doi:10.1175/1520-0485(2001)031<1943:CAOFSM>2.0. CO;2 [16] Bolding, K., Burchard, H., Pohlmann, T. and Stips, A. (2002) Turbulent mixing in the Northern North Sea: A numerical model study. Continental Shelf Research, 22, 2707-2724. doi:10.1016/S0278-4343(02)00122-X [17] Jefrey, C.D., Robinson, I.S., Woolf, D.K. and Donlon C.J. (2008) The response to phase-dependent wind stress and cloud fraction of the diurnal cycle of SST and air–sea CO2 exchange. Ocean Modelling, 23, 33-48. [18] Steiner, N. and Denman, K. (2008) Parameter sensitivities in a 1-D model for DMS and sulphur cycling in the upper ocean. Deep-Sea Research, 55, 847-865. doi:10.1016/j.dsr.2008.02.010 [19] Canuto, V.M., Howard, A., Cheng Y. and Dubovikov M.S. (2001) Ocean turbulence. Part I: One point closure model, momentum and heat vertical diffusivities. Journal of Phy- sical Oceanography, 31, 1413-1426. doi:10.1175/1520-0485(2001)031<1413:OTPIOP>2.0.C O;2 [20] Fofonoff, N.P. and Millard, R.C. (1983) Algorithms for computation of fundamental properties of seawater. Unesco Technical Papers in Marine Science, 44, 53 pp. [21] Servain, J., Busalacchi, A.J., McPhaden, M.J, Moura A.D., Reverdin, G., Vianna, M. and Zebiak, S.E. (1998) A pilot research moored array in the Tropical Atlantic (PIRATA). Bulletin of the American Meteorological Society, 79, 2019-2031. doi:10.1175/1520-0477(1998)079<2019:APRMAI>2.0.C O;2 [22] Bourlès, B., Lumpkin, R., McPhaden, M.J., Hernandez, F., Nobre, P., Campos, E., Yu, L., Planton, S., Busalacchi A., Moura, A.D., Servain, J. and Trotte, J., (2001) The PIRATA program: History, accomplishments, and future directions. Bulletin of the American Meteorological Society, 89, 1111-1125. [23] Peres, J.R. (2008) Estudo do balanço de radiação sobre o oceano Atlântico Tropical na região do Arquipélago de São Pedro e São Paulo (in portuguese), IAG. USP. 35 pp. http://www.iag.usp.br/meteo/labmicro/publicacoes/relato rios_tecnicos/Jean_2008-Estudo_do_balanco_de_radiaca o_sobre_o_oceano_Atlantico_tropical_na_regiao_do_AS PSP.pdf [24] Fairall, C.W., Bradley, E.F., Hare, J.E., Grachev, A.A. and Edson, J.B. (2003) Bulk parameterization of air-sea fluxes: updates and verification for the coare algorithm. Journal of Climate, 16, 571-591. doi:10.1175/1520-0442(2003)016<0571:BPOASF>2.0.C O;2 [25] Bolton, D. (1980) The computation of equivalent potential temperature. Monthly Weather Review, 108, 1046-1053. doi:10.1175/1520-0493(1980)108<1046:TCOEPT>2.0.C O;2  U. T. Skielka et al. / Natural Science 3 (2011) 444-455 Copyright © 2011 SciRes. OPEN ACCESS 455 [26] Fairall, C.W., Bradley, E.F., Rogers, D.P., Edson, J.B. and Young G.S. (1996) Bulk parameterization of air-sea fluxes for the tropical ocean-global atmosphere coupled- ocean atmospheric response experiment. Journal of Geo- physical Research, 101, 3747-3764. doi:10.1029/95JC03205 [27] Jerlov, N.G. (1968) Optical oceanography. American Elsevier Publ. Co. Inc., New York. [28] Linden, P.F. (1975) The deepening of a mixed layer in a stratified fluid. The Journal of Fluid Mechanics, 71, 385- 405. doi:10.1017/S0022112075002637 [29] Philander, S.G. (1990) El Nino, La Nina and the Southern Oscillation. Academic Press, San Diego.
|