 Int’l J. of Communications, Network and System Sciences, 2011, 4, 364-371 doi:10.4236/ijcns.2011.46042 Published Online June 2011 (http://www.SciRP.org/journal/ijcns) Copyright © 2011 SciRes. IJCNS Multi-Resolution Fourier Analysis Part I: Fundamentals Nourédine Yahya Bey Faculté des Sciences et Techniques, Département de physique, Université Franço is Rabelais, Tours, France E-mail: nouredine.yahyabey@phys.univ-tours.fr Received September 2, 2010; revised September 25, 2010; accepted November 5, 2010 Abstract In the first paper of this series, we propose a multi-resolution theory of Fourier spectral estimates of finite duration signals. It is shown that multi-resolution capability, achieved without further observation, is ob- tained by constructing multi-resolution signals from the only observed finite duration signal. Achieved reso- lutions meet bounds of the uncertainty principle (Heisenberg inequality). In the forthcoming parts of this se- ries, multi-resolution Fourier performances are observed, applied to short signals and extended to time-fre- quency analysis. Keywords: Multi-Resolution, Spectral Analysis, Fourier Analysis, Resolution, Frequency Resolution 1. Introduction Analyzing single realization of noisy short-time signals (short data records), multi-resolution and space-frequen- cy or time-frequency approaches, estimating frequencies of multiple signals in noise, reduction of noise variance, recovery of missing parts of signals and so on, are im- portant topics in many areas of sciences and industries (radar and sonar data processing, communications, geo- physical and seismic exploration, biomedical engineer- ing, non destructive testing, and so on). In pertinent lit- erature, multi-resolution analysis is now considered as a standard tool by researchers in image and signal proc- essing. One finds, for example, that resolving sinusoidal signals in noise with nearby frequencies is of special interest [1-5]. An other example of this importance is the well known development of various parametric spec- tral estimation methods [6,7] and wavelet theories [8-10]. In real-world applications, one acquires only finite duration signals. These signals can be viewed as being obtained by windowing infinite signals with boxcar functions. Obtained signals are therefore assumed to vanish outside the observation interval. Many problems of the Fourier spectral estimation are traced to this as- sumption made about the data outside the observation interval. The overall transform includes a convolution of the desired transform with that representing the window function. The main lobe width between 3-dB levels of the window transform, approximately the inverse of the time interval T, determines the frequency resolution. Al- though important works proposed solutions that limit the impact of time windowing effects [11,12] and others that provide minimum-error band-limited approximation of non band-limited signals [13], performance limitations and their consequences as poor frequency and amplitude estimations remain non-recoverable. Moreover, the im- portant frequency extent (multiple of the reciprocal of the observation interval) of spectral leakage perturbs amplitude estimation and masks weak components. Skillful selection of windows reduces only its amplitudes with no effect on its spectral extent. Parameter identification approach (autoregressive (AR), moving average (MA), ARMA) was used to avoid deficiencies of Fourier spectral estimation since unrealis- tic assumption about the nature of the signal (zero or cyclic) outside the observation interval is eliminated. Important improvements over Fourier spectral estimation is reported by pertinent literature especially for short finite duration signals (higher resolution and lack of side-lobes). However, well known drawbacks of this approach are excessive sensitivity to observation noise (resolution varies as a function of the signal-to-noise ratio), important computation times with respect to FFT analysis, computational complexity [14-16], multiplicity of algorithms estimating model parameters and the ne- cessity of subjective judgement in the selection of the order [17]. Contamination of parametric spectra by spu-  N. YAHYA BEY 365 rious peaks is an inherent problem to parametric model- ing. In [18], we proposed AR modeling of signal defined for low signal-to-noise ratios with an adapted model or- der selection. We have shown that sensitivity to observa- tion noise of AR modeling is drastically reduced whereas computation times remain important. Pisarenko harmonic decomposition, extended Prony’s method and Prony spectral line decomposition [19-21] depict analysis modelings similar to those of the pa- rameter identification approach (ARMA or AR proc- esses). Performances are dependent on the order, usually unknown, and remain sensitive to high level of observa- tion noise. Deficiencies, mentioned above, are therefore encountered by these methods. On the other hand, the algorithm “MUSIC” for “Multiple Signal Classification” [22] detects frequencies in a signal by performing an eigen decomposition on the covariance matrix of a data vector of samples obtained from the samples of a con- sidered signal. MUSIC assumes known the number of samples and the number of frequencies. This algorithm is attractive provided the available signal-to-noise (SNR) is high to resolve two distinct peaks in the estimated spec- trum. One finds, however, that devised various methods [23] to overcome drawbacks such as weak robustness to both modeling errors and the presence of a strong back- ground noise add to computational complexity and re- quires high enough SNRs. An alternative non parametric approach for the resolu- tion of mentioned problems is developed by wavelets. It is well known that wavelet transforms have remarkable resolution properties but trail some drawbacks: 1) wave- lets capture only few oscillations and therefore act as local magnifiers independently of the nature of the signal under analysis (stationary, quasi-stationary or not); 2) the necessity of skillful selection of appropriate wavelets to the signal under analysis; 3) the problem of interpretation of wavelets spectra is made quite difficult since the Fou- rier spectrum of a wavelet is in itself a complex one. Let us note that Fourier coefficients are not only concepts but have physical evidence; 4) information on frequency is only approximative since a wavelet does not have a pure frequency as a sine wave. Characterization of a precise frequency content is therefore not suitable by means of wavelets; 5) when treating extraction of signals from noise [24] we have shown in [25] that wavelet denoising, fail or yield notably perturbed results when spectral den- sities of colored noise (Gaussian or not) and the signal overlap. In this work, we propose multi-resolution theory of Fourier spectral estimates. The key idea is based on the fact that observed signals carry information on their un- observed or missing parts and the difficulty of the task is to let these signals reveal this hidden information by us- ing the simplest possible theory. Our main effort, de- scribed here, is to construct signals from the only ob- served one able to reveal in the frequency domain re- sulting transforms whose main lobe-widths between 3-dB levels, and therefore resolutions, decrease as lengths of constructed signals increase. The number of resolution levels is defined as a function of the length of the corresponding multi-resolution signal in order to de- pict detailed or global views. Multi-resolution signals can be viewed as wavelets composed of versions of the signal itself analyzed by means of FFT spectral estima- tion. Advantages of the proposed approach are: 1) Resolution at any desired level is applied simulta- neously to all corresponding points of the frequency axis. The whole frequency axis is magnified. 2) Contraction of spectral leakage and improvement of frequency estimation proportionally to levels of multi- resolution signals (second part of this series). 3) Easier and efficient implementation since the popu- lar FFT algorithm remains used for all computations. Important reduction of computation times are expected when compared to those required by parametric or wavelet approaches. 4) Reduction of the spectral variance of resolved noisy spectral estimates as a function of the applied resolution level. This helps simple and efficient denoising of a sin- gle noisy realization of a short signal (third part of this series). 5) Unlike models based on estimation of correlation lags, here, phase information is not destroyed. Inverse transformation recovers missing parts of observed sig- nals (second part of this series). 6) Performances of the denoising tools [24-27] based on FFT algorithm can be used for extraction of buried resolved spectral estimates (third part of this work). 7) Extension of obtained results to a novel time-fre- quency analysis is proposed in the fourth part of this work. 8) Extraction of buried time-varying spectra in noise is treated in the fifth part of this work. 9) One can also apply the theory to a novel image processing. It is crucial to notice that our main focus of attention in the first part of this work is to derive expressions of multi-resolution signals. In section III, we precise basics of multi-resolution Fourier analysis by constructing dou- ble resolution signals and generalizing the theory to higher frequency resolution levels. Resolution properties, contraction of spectral leakage, improvement of fre- quency estimation and recovering of missing parts of short signals are discussed and observed in the forth- coming parts of this series. Copyright © 2011 SciRes. IJCNS 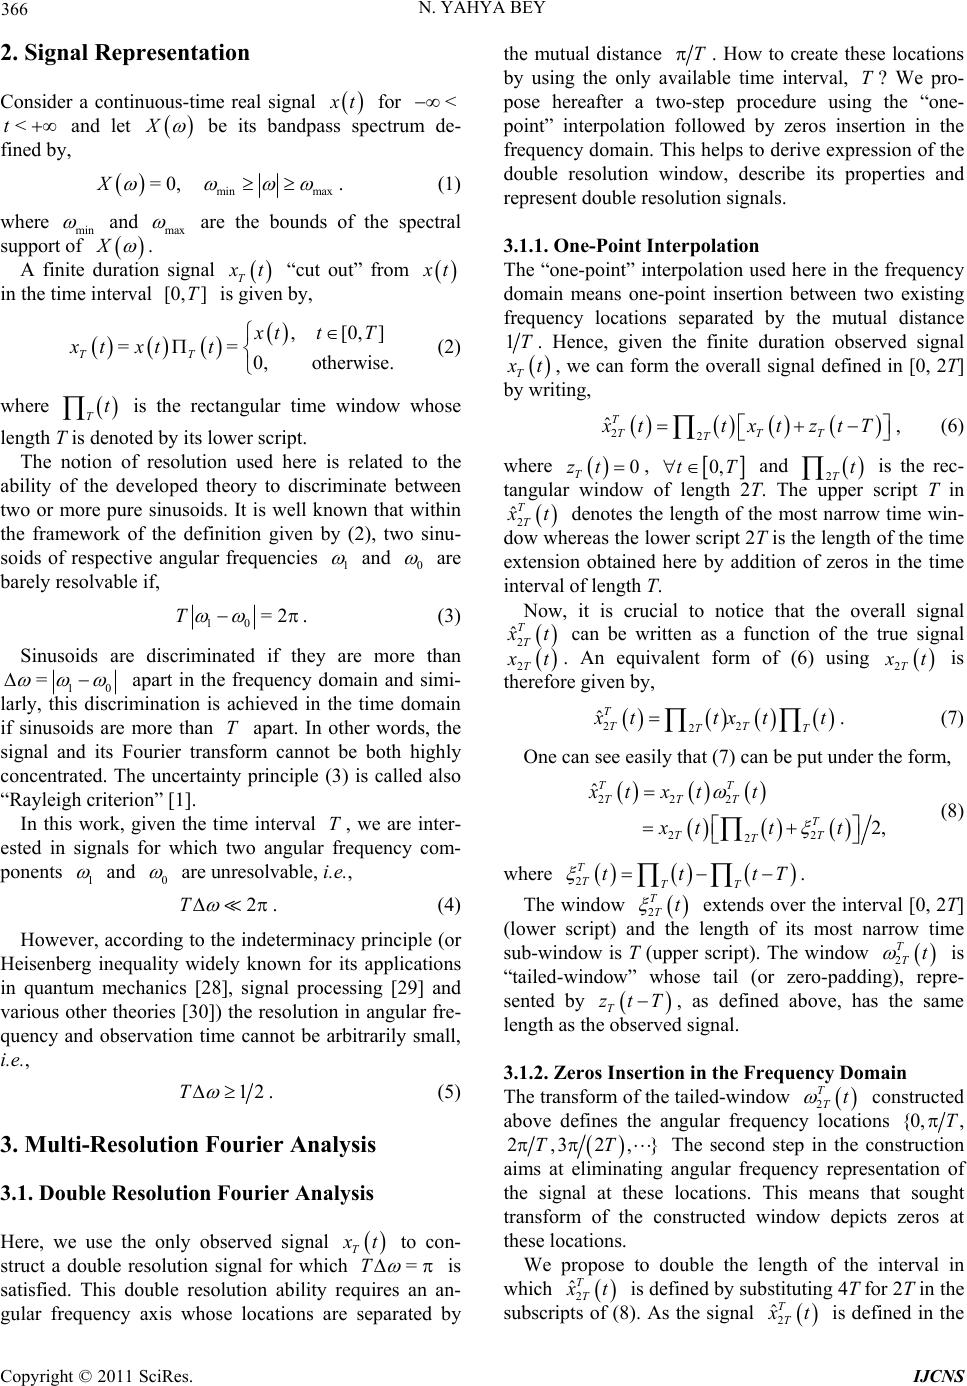 366 N. YAHYA BEY 2. Signal Representation Consider a continuous-time real signal t for < and let <t X be its bandpass spectrum de- fined by, min max =0,X . (1) where min and max are the bounds of the spectral support of X . A finite duration signal T t “cut out” from t in the time interval is given by, [0, ]T ,[0, == 0, otherwise. TT ] tt T xt xtt (2) where is the rectangular time window whose Tt length T is denoted by its lower script. The notion of resolution used here is related to the ability of the developed theory to discriminate between two or more pure sinusoids. It is well known that within the framework of the definition given by (2), two sinu- soids of respective angular frequencies 1 and 0 are barely resolvable if, 10 =2T . (3) Sinusoids are discriminated if they are more than 10 = apart in the frequency domain and simi- larly, this discrimination is achieved in the time domain if sinusoids are more than apart. In other words, the signal and its Fourier transform cannot be both highly concentrated. The uncertainty principle (3) is called also “Rayleigh criterion” [1]. T In this work, given the time interval , we are inter- ested in signals for which two angular frequency com- ponents T 1 and 0 are unresolvable, i.e., 2T . (4) However, according to the indeterminacy principle (or Heisenberg inequality widely known for its applications in quantum mechanics [28], signal processing [29] and various other theories [30]) the resolution in angular fre- quency and observation time cannot be arbitrarily small, i.e., 12T . (5) 3. Multi-Resolution Fourier Analysis 3.1. Double Resolution Fourier Analysis Here, we use the only observed signal T t T to con- struct a double resolution signal for which = is satisfied. This double resolution ability requires an an- gular frequency axis whose locations are separated by the mutual distance T . How to create these locations by using the only available time interval, ? We pro- pose hereafter a two-step procedure using the “one- point” interpolation followed by zeros insertion in the frequency domain. This helps to derive expression of the double resolution window, describe its properties and represent double resolution signals. T 3.1.1. One-Point Interpolat ion The “one-point” interpolation used here in the frequency domain means one-point insertion between two existing frequency locations separated by the mutual distance T . Hence, given the finite duration observed signal T t, we can form the overall signal defined in [0, 2T] by writing, 22 ˆTTTT T ttxtz t T, (6) where 0 T zt , 0,tT and 2T is the rec- tangular window of length 2T. The upper script T in t 2 ˆTT t denotes the length of the most narrow time win- dow whereas the lower script 2T is the length of the time extension obtained here by addition of zeros in the time interval of length T. Now, it is crucial to notice that the overall signal 2 ˆTT t can be written as a function of the true signal 2T t. An equivalent form of (6) using 2T t is therefore given by, 22 2 ˆTTT T T ttxt t. (7) One can see easily that (7) can be put under the form, 222 22 2 ˆ 2, TT TTT T TT T xt xtt xtt t (8) where 2 T TTT ttt T . The window 2t T T extends over the interval [0, 2T] (lower script) and the length of its most narrow time sub-window is T (upper script). The window 2 TTt is “tailed-window” whose tail (or zero-padding), repre- sented by T T zt , as defined above, has the same length as the observed signal. 3.1.2. Zeros Insertion in the Frequency Domain The transform of the tailed-window constructed above defines the angular frequency locations 2 TTt {0, T , ,2,TT} The second step in the construction aims at eliminating angular frequency representation of the signal at these locations. This means that sought transform of the constructed window depicts zeros at these locations. We propose to double the length of the interval in which 2 ˆTT t is defined by substituting 4T for 2T in the subscripts of (8). As the signal 2 ˆTT t is defined in the Copyright © 2011 SciRes. IJCNS 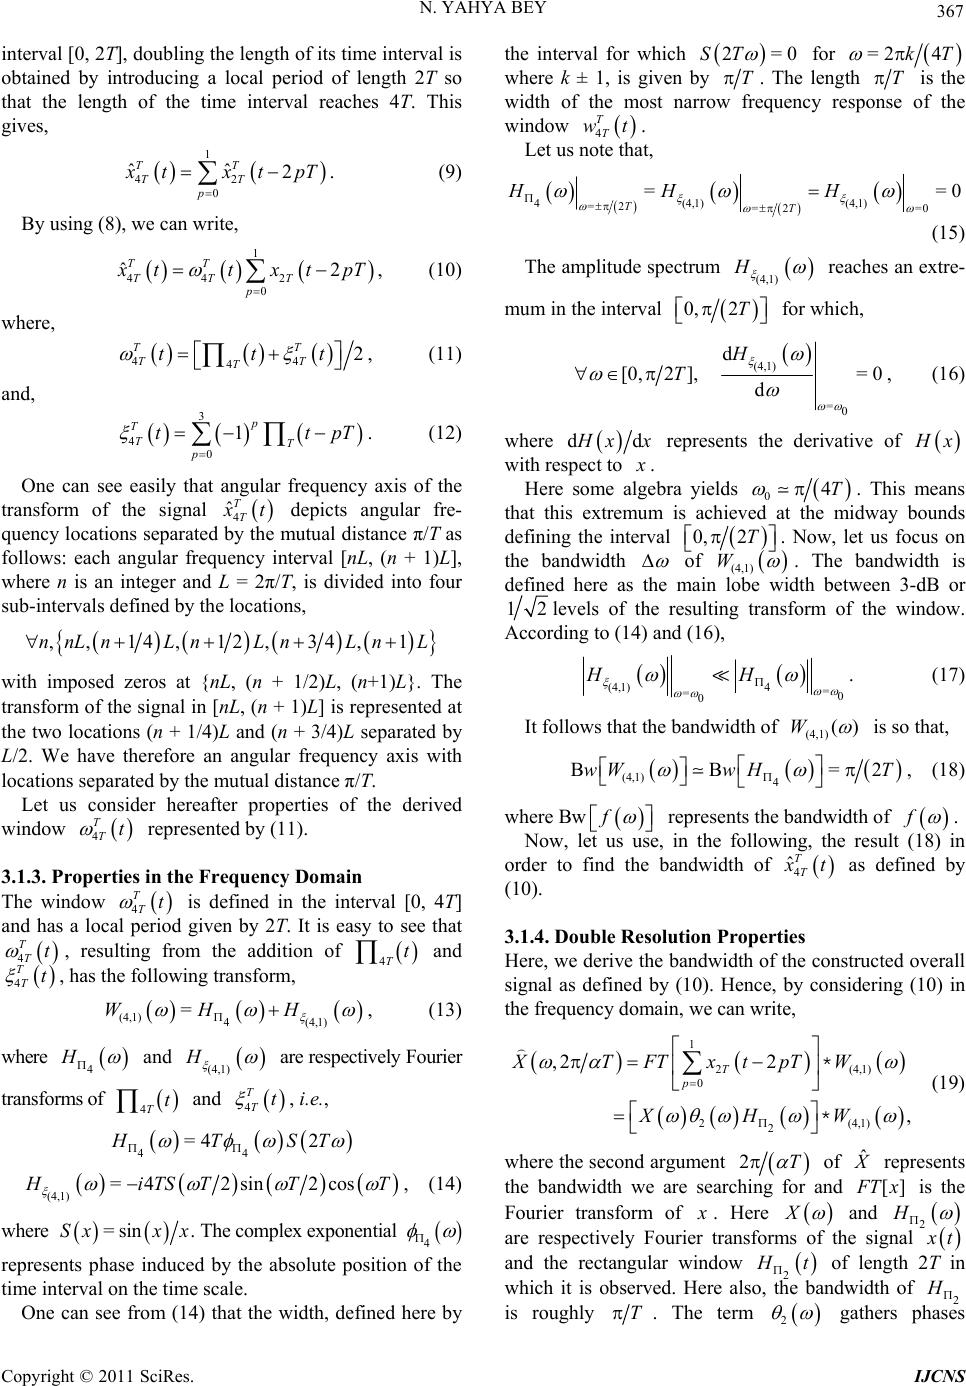 N. YAHYA BEY 367 interval [0, 2T], doubling the length of its time interval is obtained by introducing a local period of length 2T so that the length of the time interval reaches 4T. This gives, 1 42 0 ˆˆ 2 TT TT p txtp T. (9) By using (8), we can write, 1 44 2 0 ˆ2 TT TT T p ttxtp T, (10) where, 44 42 T T T ttt T T tpT , (11) and, 3 4 0 1p T TT p t . (12) One can see easily that angular frequency axis of the transform of the signal 4 ˆTT t depicts angular fre- quency locations separated by the mutual distance π/T as follows: each angular frequency interval [nL, (n + 1)L], where n is an integer and L = 2π/T, is divided into four sub-intervals defined by the locations, ,, 14, 12,34, 1nnLnLnLnLn L with imposed zeros at {nL, (n + 1/2)L, (n+1)L}. The transform of the signal in [nL, (n + 1)L] is represented at the two locations (n + 1/4)L and (n + 3/4)L separated by L/2. We have therefore an angular frequency axis with locations separated by the mutual distance π/T. Let us consider hereafter properties of the derived window represented by (11). 4 TTt 3.1.3. Properties in the Frequency Domain The window is defined in the interval [0, 4T] and has a local period given by 2T. It is easy to see that , resulting from the addition of 4 TTt 4 TTt 4Tt and , has the following transform, 4 T Tt (4,1) 4 (4,1) =WHH , (13) where 4 H and (4,1) H are respectively Fourier transforms of and , i.e., 4Tt 4 T Tt 44 =4 2 TST (4,1) =42sin 2cos iTS TTT , (14) where =sinSxx x. The complex exponential 4 represents phase induced by the absolute position of the time interval on the time scale. One can see from (14) that the width, defined here by the interval for which 2=ST 0 for =2 4kT where k ± 1, is given by T . The length T is the width of the most narrow frequency response of the window 4 TT wt. Let us note that, 4(4,1) (4,1) =2 =2 =0 == TT HH H 0 (15) The amplitude spectrum (4,1) H reaches an extre- mum in the interval 0, 2T for which, (4,1) =0 d [0,2],= 0 d H T , (16) where dd xx represents the derivative of x with respect to . Here some algebra yields 0. This means that this extremum is achieved at the midway bounds defining the interval 4T 0, 2T . Now, let us focus on the bandwidth of (4,1) W . The bandwidth is defined here as the main lobe width between 3-dB or 12levels of the resulting transform of the window. According to (14) and (16), (4,1)4 = =0 0 HH . (17) It follows that the bandwidth of )( (4,1) W is so that, (4,1) 4 BB=wW wHT 2, (18) where Bw f represents the bandwidth of f . Now, let us use, in the following, the result (18) in order to find the bandwidth of 4 ˆTT t as defined by (10). 3.1.4. Doubl e Res ol ution Proper ties Here, we derive the bandwidth of the constructed overall signal as defined by (10). Hence, by considering (10) in the frequency domain, we can write, 1 2 (4,1) 0 2 (4,1) 2 ,2 2 , T p XTFTxtpTW XHW * * (19) where the second argument 2T of ˆ represents the bandwidth we are searching for and [] Tx is the Fourier transform of . Here X and 2 H are respectively Fourier transforms of the signal t and the rectangular window 2 t of length 2T in which it is observed. Here also, the bandwidth of 2 is roughly T . The term 2 gathers phases Copyright © 2011 SciRes. IJCNS  368 N. YAHYA BEY resulting from time translation. The convolution between the windows H2 and (4,1) W yields a window with the broadest of the two bandwidths. According to (18), this gives, 2 (4,1) 2 ,=HTH W *, (20) where the bandwidth of , T is given by its second argument T. By using (20), (19) becomes, ˆ,, XH *T, (21) only if, =2 . This defines the frequency resolution, =T . It is crucial to notice that the true spectrum , T can be extracted from ˆ, T as shown in the second part of this series. 3.1.5. Expression of Double Resolution Signals Expression of a double resolution signal as a function of the only observed finite duration signal T t is obtained by considering (10). One can see easily that, 1 44 2 0 1 40 ˆ2 2. TT TT T p T Tp ttxtp txtpT T (22) Components of the overall signal (22) are T t and its translated version 2 T tT. Notice that for resolv- ing potential ambiguities [6] or smoothing the appearance of the spectral estimates, one can apply zero-padding to the double resolution signal as defined by (22) and not to the signal depicted by (7) (see the second part of this series). 3.2. Fourfold Frequency Resolution 3.2.1. Quadruple Resolution Window It can be seen immediately that the quadruple resolution window can be obtained from the double resolution one (13) by substituting 8T for 4T in the lower scripts and 2T for T in upper scripts. The expression corresponding overall signal of length is given by, T8 1 22 88 4 0 ˆ4 TT TT T p ttxtp T, (23) where, 2 88 82 T T T ttt 2T T . (24) Conclusions in the frequency domain for this quadruple resolution window are therefore straight- forward and one finds easily that the frequency reso- lution is given by, =2T . The main concern hereafter is to find the expression in the time domain of the quadruple resolution signal as a function of the only observed one T t. 3.2.2. The Overall Signal The half-period restriction (in the interval [0 ) of (24) yields, , 4]T 2 44 4 =2 T T T wtt t 2T T . (25) As the window 2 4 T T t ]T t 4T imposes zeros in the interval [2, then, the overall signal , 4T 2 4 ˆT T t (in the interval ) is given by, [0, 4]T 2 42 ˆ2 T TTT T txtqtTztT, (26) where 2=0 T zt in the interval [0 and , 2]T T qt is an unknown signal. 3.2.3. Sign al I denti fi cation Now, the difficulty of the task depicted by (26) is the identification of the unknown signal T qt by using the only known signal T t. The half-period restriction of (23), yields, 22 4444 2 ˆTT TTTT T txtwtxt t . (27) By using (26), (27) becomes, 22 2 = =. TTT T TTT xtqtTx tt tt tT (28) Since 2= T T T ttxt , then the unknown signal T qt is specified by, =, TT qt xt , (29) where represents an unknown phase that characterizes the signal 2TT ttT “cut-out” from 2T t 2Tt with respect to T t. In the following, we identify the expression of the signal T qt by using its amplitude and phase spectra together with the sign of its angular frequency. 3.2.4. Ampl i tude Spectrum The spectrum of T qt , as defined by (29), is given by, () =e i TT QX . (30) According to (30), = TT QX . 3.2.5. Ph ase Spe ctru m Let us consider the amplitude spectrum of the sum of T tand T qt. By assuming that = TT XX () ei and using (30), we have, Copyright © 2011 SciRes. IJCNS 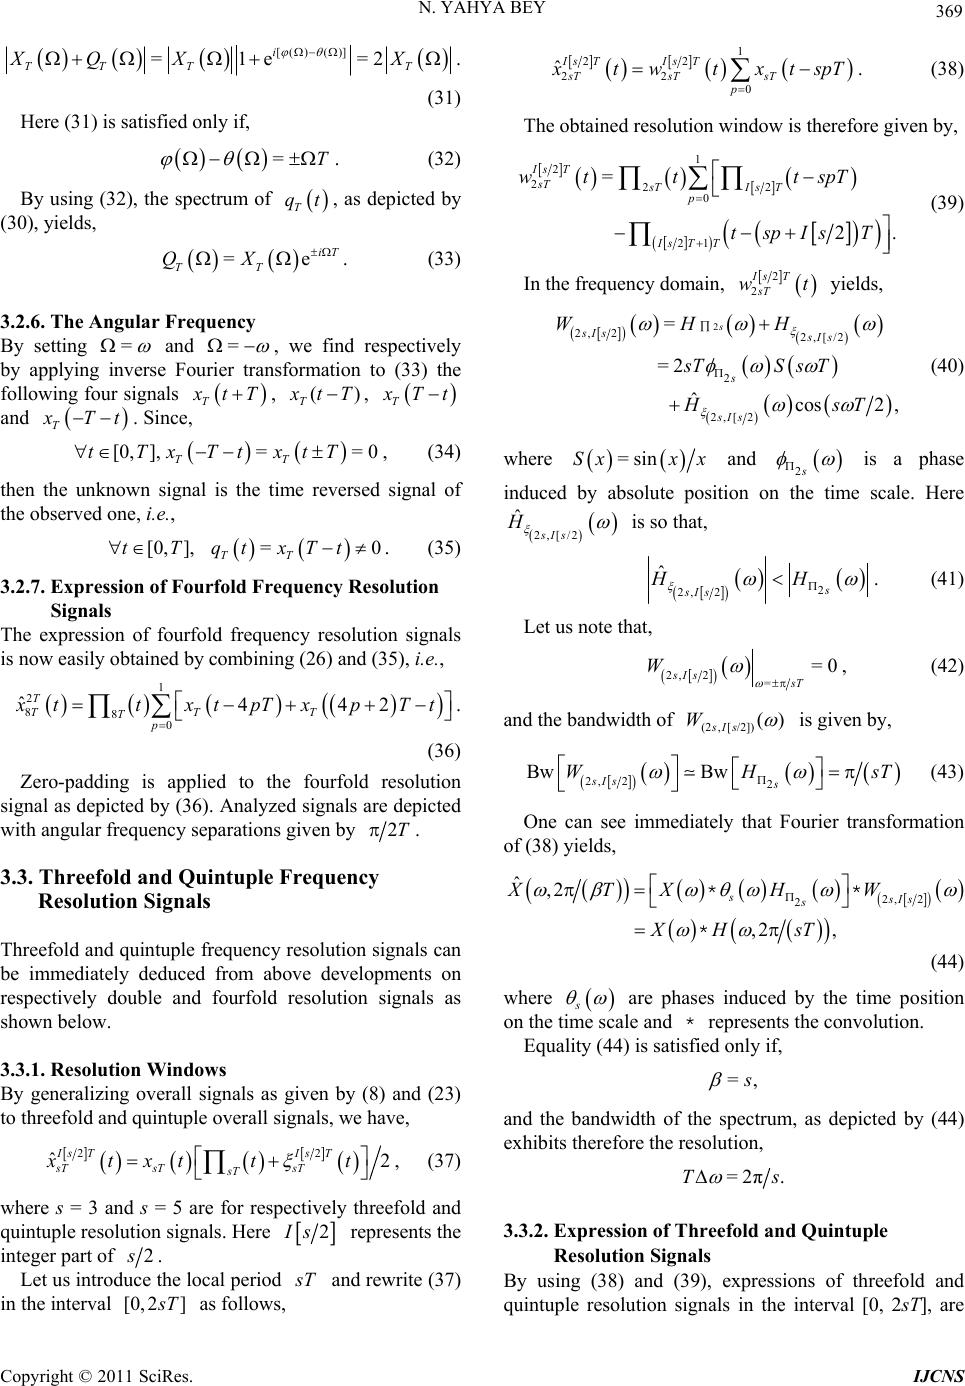 N. YAHYA BEY 369 [( )( )] =1e=2 i TT TT XQ XX . (31) Here (31) is satisfied only if, =T . (32) By using (32), the spectrum of T qt , as depicted by (30), yields, =e iT TT QX . (33) 3.2.6. The Angular Frequency By setting = and = T , we find respectively by applying inverse Fourier transformation to (33) the following four signals tT, , )( TtxT T Tt and T Tt . Since, [0,],== 0 TT tTxTtxtT , (34) then the unknown signal is the time reversed signal of the observed one, i.e., [0, ],=0 TT tTqtxTt . (35) 3.2.7. Expression of Fourfold Frequency Resolution Signals The expression of fourfold frequency resolution signals is now easily obtained by combining (26) and (35), i.e., 1 2 880 ˆ442 T TTT Tp ttxtpTxpT t . (36) Zero-padding is applied to the fourfold resolution signal as depicted by (36). Analyzed signals are depicted with angular frequency separations given by 2T. 3.3. Threefold and Quintuple Frequency Resolution Signals Threefold and quintuple frequency resolution signals can be immediately deduced from above developments on respectively double and fourfold resolution signals as shown below. 3.3.1. Resolu tion Windows By generalizing overall signals as given by (8) and (23) to threefold and quintuple overall signals, we have, 2 ˆ2 Is TIs T sT sTsT sT xtxt tt 2 , (37) where s = 3 and s = 5 are for respectively threefold and quintuple resolution signals. Here 2 s represents the integer part of 2 . Let us introduce the local period T and rewrite (37) in the interval [0, 2] T as follows, 1 22 22 0 ˆIs TIs T sTsT sT p twtxtspT . (38) The obtained resolution window is therefore given by, 1 2 222 0 21 = 2. Is T sT sTI sT p Is TT wt ttspT tspIs T (39) In the frequency domain, 2 2 Is T sT wt yields, 2 2, 22,[/2 2 2,[ 2 = =2 ˆcos2, s sIs sIs s sIs WHH sTS s T Hs T (40) where =sinSxx x and 2s is a phase induced by absolute position on the time scale. Here 2,[ /2 ˆsIs H is so that, 2 2, 2 ˆs sIs HH . (41) Let us note that, 2, 2= =0 sIs sT W , (42) and the bandwidth of )( /2])[,(2 sIs W is given by, 2, 22 Bw Bw sIs s WH sT (43) One can see immediately that Fourier transformation of (38) yields, 2,2 2 ˆ,2 ,2 , ssIs s XTXHW XH sT ** * (44) where s are phases induced by the time position on the time scale and represents the convolution. * Equality (44) is satisfied only if, ,= s and the bandwidth of the spectrum, as depicted by (44) exhibits therefore the resolution, =2π.Ts 3.3.2. Expression of Threefold and Quintuple Resolution Signals By using (38) and (39), expressions of threefold and quintuple resolution signals in the interval [0, 2sT], are Copyright © 2011 SciRes. IJCNS 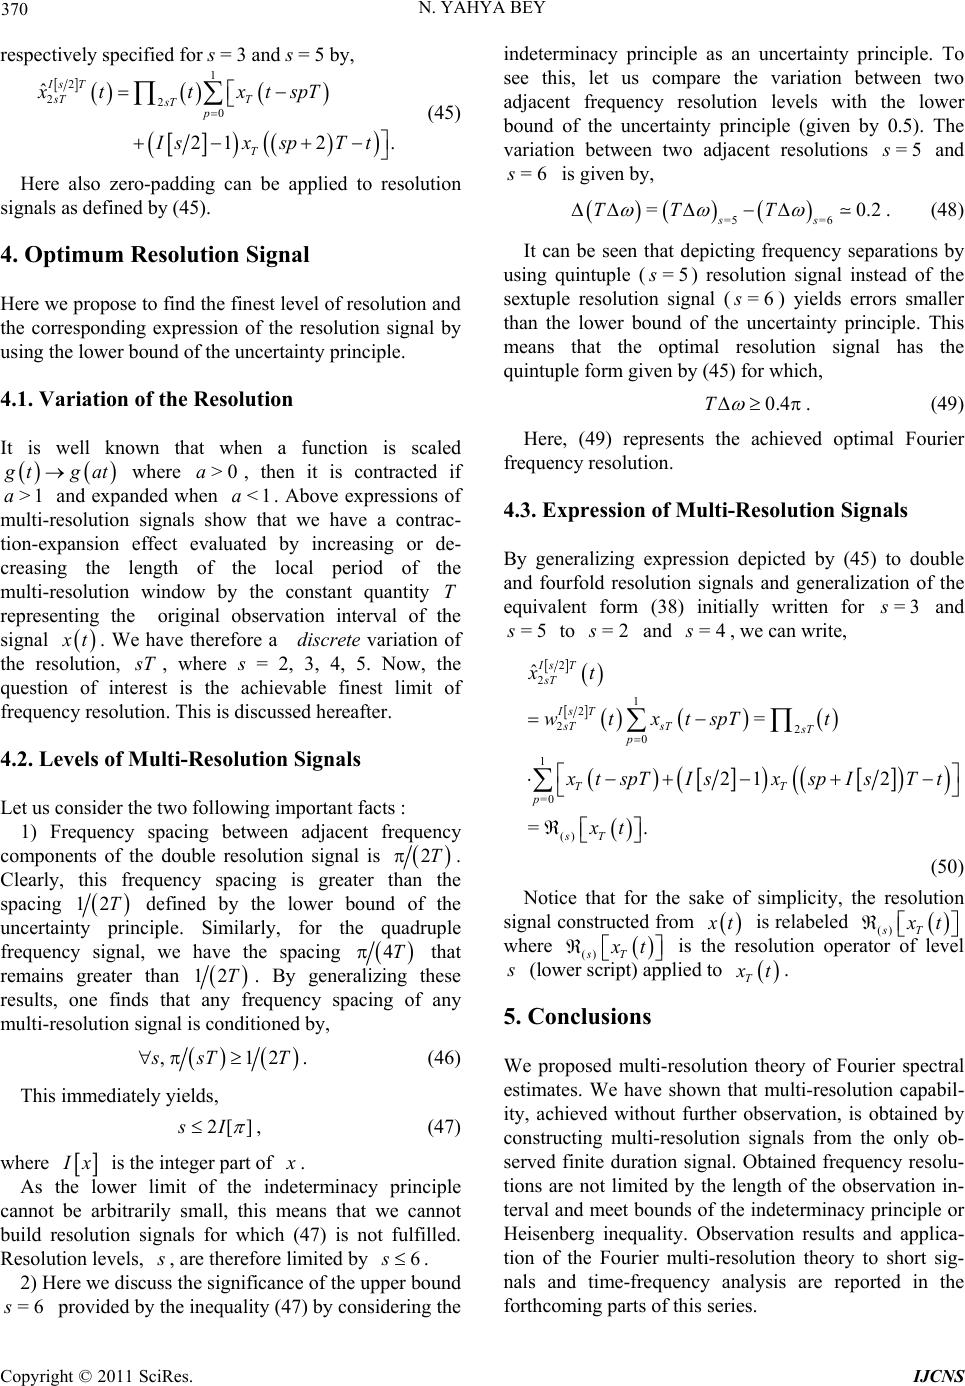 370 N. YAHYA BEY respectively specified for s = 3 and s = 5 by, 1 2 220 ˆ 21 2 Is T sT T sT p T xt txtspT . sxspTt (45) Here also zero-padding can be applied to resolution signals as defined by (45). 4. Optimum Resolution Signal Here we propose to find the finest level of resolution and the corresponding expression of the resolution signal by using the lower bound of the uncertainty principle. 4.1. Variation of the Resolution It is well known that when a function is scaled tgat >1a where , then it is contracted if and expanded when . Above expressions of multi-resolution signals show that we have a contrac- tion-expansion effect evaluated by increasing or de- creasing the length of the local period of the multi-resolution window by the constant quantity >0aa<1 representing the original observation interval of the signal t. We have therefore a discrete variation of the resolution, T, where s = 2, 3, 4, 5. Now, the question of interest is the achievable finest limit of frequency resolution. This is discussed hereafter. 4.2. Levels of Multi-Resolution Signals Let us consider the two following important facts : 1) Frequency spacing between adjacent frequency components of the double resolution signal is 2T. Clearly, this frequency spacing is greater than the spacing 12T defined by the lower bound of the uncertainty principle. Similarly, for the quadruple frequency signal, we have the spacing 4T that remains greater than 12T. By generalizing these results, one finds that any frequency spacing of any multi-resolution signal is conditioned by, ,12 sT T . (46) This immediately yields, 2[] I , (47) where x is the integer part of . As the lower limit of the indeterminacy principle cannot be arbitrarily small, this means that we cannot build resolution signals for which (47) is not fulfilled. Resolution levels, , are therefore limited by 6s . 2) Here we discuss the significance of the upper bound provided by the inequality (47) by considering the indeterminacy principle as an uncertainty principle. To see this, let us compare the variation between two adjacent frequency resolution levels with the lower bound of the uncertainty principle (given by 0.5). The variation between two adjacent resolutions and is given by, 6=s 5=s 6=s =5 =6 =0 ss TT T .2. (48) It can be seen that depicting frequency separations by using quintuple () resolution signal instead of the sextuple resolution signal () yields errors smaller than the lower bound of the uncertainty principle. This means that the optimal resolution signal has the quintuple form given by (45) for which, 5=s 6=s 0.4T . (49) Here, (49) represents the achieved optimal Fourier frequency resolution. 4.3. Expression of Multi-Resolution Signals By generalizing expression depicted by (45) to double and fourfold resolution signals and generalization of the equivalent form (38) initially written for and to and , we can write, 3=s 5=s2=s4=s 2 1 2 22 0 () = 21 2 =. T Is T sT sTsT p TT sT xt wtxtspT t 2 1 =0 ˆIs sT p tspTIsx spIsTt xt (50) Notice that for the sake of simplicity, the resolution signal constructed from t is relabeled ()sT t where ()sT t is the resolution operator of level (lower script) applied to T t. 5. Conclusions We proposed multi-resolution theory of Fourier spectral estimates. We have shown that multi-resolution capabil- ity, achieved without further observation, is obtained by constructing multi-resolution signals from the only ob- served finite duration signal. Obtained frequency resolu- tions are not limited by the length of the observation in- terval and meet bounds of the indeterminacy principle or Heisenberg inequality. Observation results and applica- tion of the Fourier multi-resolution theory to short sig- nals and time-frequency analysis are reported in the forthcoming parts of this series. Copyright © 2011 SciRes. IJCNS  N. YAHYA BEY Copyright © 2011 SciRes. IJCNS 371 6. References [1] M. Shahram and P. Milanfar, “On the Resolvability of Sinuoids with Nearby Frequencies in the Presence of Noise,” IEEE Transactions on Signal Processing, Vol. 53, No. 7, 2005, pp. 2579-2588. doi:10.1109/TSP.2005.845492 [2] D. V. Anderson, “Speech Analysis and Coding Using a Multi-Resolution Sinusoidal Transform,” 1996 IEEE In- ternational Conference on Acoustics, Speech, and Signal, Atlanta, 7-10 May 1996, pp. 1037-1040. doi:10.1161/01.CIR.82.4.118 [3] R. Haberl, H. F. Schels, P. Steinbigler, G. Jilge and G. Steinbeck, “Top-Resolution Frequency Analysis of Elec- trocardiogram with Adaptive Frequency Determination. Identification of Late Potentials in Patients with Coronary Artery Disease,” Circulation, Vol. 82, 1990, pp. 1183- 1192. doi: 10.1109/ICASSP.1996.543301 [4] L. Marple, “Resolution of Conventional Fourier, Autore- gressive, and Special ARMA Methods of Spectrum Analysis,” IEEE International Conference on Acoustics, Speech, and Signal Processing, May 1977, pp. 74-77. doi:10.1109/ICASSP.1977.1170219 [5] D. L. Donoho and P. H. Stark, “Uncertainty Principles and Signal Recovery,” SIAM Journal on Applied Mathe- matics, Vol. 49, 1989, pp. 906-931. doi:10.1137/0149053 [6] S. M. Kay and S. L. Marple, “Spectrum Analysis—A Modern Perspective,” Proceedings of the IEEE, Vol. 69, No. 11, 1981, pp. 1380-1419. doi:10.1109/PROC.1981.12184 [7] A. Bruckstein, T. J. Shan and T. Kailath, “The Resolution of Overlapping Echos,” IEEE Transactions on Acoustic, Speech and Signal Processing, Vol. 33, No. 6, 1985, pp. 1357-1367. [8] Y. Meyer, “Wavelets: Algorithms and Applications,” Society for Industrial and Applied Mathematics, Phila- delphia, 1993. [9] O. Rioul and M. Vitterli, “Wavelets and Signal Process- ing,” IEEE Signal Processing Magazine, Vol. 8, No. 4, 1991, pp. 14-38. doi:10.1109/79.91217 [10] I. Daubechies, “Ten Lectures on Wavelets,” Siam, Phila- daphia, 1992. [11] M. Kunt, “Traitement Numérique des Signaux,” Dunod, Paris, 1981. [12] F. J. Harris, “On the Use of Windows for Harmonic Analysis with the Discrete Fourier Transform,” Proceed- ing of the IEEE, Vol. 66, No. 1, 1978, pp. 51-83. doi:10.1109/PROC.1978.10837 [13] M. Unser, “Sampling—50 Years after Shanon,” Pro- ceedings of the IEEE, Vol. 88, No. 4, 2000, pp. 569-587. doi:10.1109/5.843002 [14] S. M. Kay, “The Effects of Noise on the Autoregressive Spectral Estimator,” IEEE Transactions on Acoustics, Speech and Signal Processing, Vol. 27, No. 5, 1979, pp. 478-485. [15] S. M. Kay, “Noise Compensation for Autoregressive Spectral Estimates,” IEEE Transactions on Acoustics, Speech and Signal Processing, Vol. 28, No. 3, 1980, pp. 292-303. [16] Q. T. Zhang, “Reduction of Asymptotic Bias of AR and Spectral Estimates by Tapering,” Journal of Time Series Analysis, Vol. 13, No. 5, 1992, pp. 451-69. doi:10.1111/j.1467-9892.1992.tb00120.x [17] k. Kaluzynski, “Order Selection in Doppler Blood Flow Signal Spectral Analysis Using Autoregressive Model- ing,” Medical and Biological Engineering and Comput- ing, Vol. 27, No. 1, 1989, pp. 89-82. doi:10.1007/BF02442176 [18] N. Y. Bey, “Recovering of Autoregressive Spectral Esti- mates of Signals Buried in Noise,” Signal, Image and Video Processing, Vol. 1, No. 4, 2007, pp. 321-331. doi:10.1007/s11760-007-0026-3 [19] V. F. Pisarenko, “On the Estimation of Spectra by Means of Non-Linear Functions of the Covariance Matrix,” Geophysical Journal of the Royal Astronomical Society, Vol. 28, No. 5, 1972, pp. 511-531. [20] V. F. Pisarenko, “The Retrieval of Harmonics from a Covariance Function,” Geophysical Journal of the Royal Astronomical Society, Vol. 33, No. 5, 1973, pp. 347-366. [21] M. L. van Blabicum and R. Mittra, “Problems and Solu- tions Associated with Prony’s Method for Processing Transient Data”, IEEE Transactions on Electromagnetic Compatibility, EMC-20, No. 1, 1978, pp. 174-182. doi:10.1109/TEMC.1978.303708 [22] M. Kaveh and A. Barabell, “The Statistical Performance of the MUSIC and the Minimum Norm Algorithms in Resolving Plane Waves in Noise,” IEEE Transactions on Acoustic, Speech and Signal Processing, Vol. 34, No. 2, 1986, pp. 331-341. doi:10.1109/TASSP.1986.1164815 [23] A. Barabell, “Improving the Resolution Performance of Eigenstructure-Based Direction-Finding Algorithms,” IEEE International Conference on Acoustics, Speech, and Signal Processing, Vol. 8, 1983, pp. 336-339. [24] N. Yahya Bey, “Extraction of Signals Buried in Noise, Part I: Fundamentals,” Signal Processing, Vol. 86, No. 9, 2006, pp. 2464-2478. doi:10.1016/j.sigpro.2005.11.014 [25] N. Yahya Bey, “Extraction of Signals Buried in Noise, Part II: Experimental Results,” Signal Processing, Vol. 86, No. 10, 2006, pp.2 994-3011. doi:10.1016/j.sigpro.2005.11.018 [26] N. Yahya Bey, “Extraction of Signals Buried in Noise: Correlated Processes,” International Journal of Communi- cations, Network and System Sciences, Vol. 3, No. 11, 2010, pp. 855-862. doi:10.4236/ijcns.2011.311116 [27] N. Yahya Bey, “Extraction of Signals Buried in Noise : Non-Ergodic Processes,” International Journal of Com- munications, Network and Syste m Sciences, Vol. 3, No. 12, 2010, pp. 907-915. doi:10.4236/ijcns.2010.312124 [28] W. Heisenberg, “The Physical Principles of Quantum Theory,” University of Chicago Press, Chicago, 1930. [29] D. Gabor, “Theory of Communication,” Journal of Insti- tution of Electrical Engineers, Vol. 93, No. 26, 1946, pp. 429-441. doi:10.1049/ji-3-2.1946.0074 [30] C. L. Fefferman, “The Uncertainty Principle,” Bulletin of the American Mathematical Society, Vol. 9, No. 2, 1983, pp. 129-206.
|