Journal of Geoscience and Environment Protection, 2014, 2, 1-7
Published Online December 2014 in SciRes. http://www.scirp.org/journal/gep
http://dx.doi.org/10.4236/gep.2014.25001
How to cite this paper: Talchabhadel, R., & Sharma, R. (2014). Real Time Data Analysis of West Rapti River Basin of Nepal.
Journal of Geoscience and Environment Protection, 2, 1-7. http://dx.doi.org/10.4236/gep.2014.25001
Real Time Data Analysis of West Rapti River
Basin of Nepal
Rocky Talchabhadel, Rajendra Sharma
Department of Hydrology and Meteorology, PO Box 406, Babarmahal, Kathmandu, Nepal
Email: rocky.i oe@gmail .com, ra jendra_706 @hotmail.co m
Received Ju ly 2014
Abstract
Floods are the most widespread climate-related hazards in the world, and they impact more
people globally than any other type of natural disasters. It causes over one third of the total eco-
nomic loss from natural catastrophes and is responsible for two thirds of people affected by natu-
ral disasters. On the other hand, studies and analysis have shown that damage reductions due to
forecasts improvements can range from a few percentage points to as much as 35% of annual
flood damages. About 300 people lose their lives each year due to floods and landslides in Nepal
with property damage exceeding 626 million NPR on average. The West Rapti River basin is one of
the most flood prone river basins in Nepal. The real-time flood early warning system together with
the development of water management and flood protection schemes plays a crucial role in re-
ducing the loss of lives and properties and in overall development of the basin. The non-structural
mitigating measure places people away from flood. This method is designed to reduce the impact
of flooding to society and economy. This paper presents an overview of flood problems in the West
Rapti River basin, causes and consequences of recent floods and the applicability and effectiveness
of the real time data to flood early warning in Nepal.
Keywords
Floods, Monitoring, Real-Time Data, Warning Level, Danger Lev el
1. Introduction
Flood is a natural phenomenon that occurs when the volume of water flowing in system exceeds its total water
holding capacity. United states define flood as excess flowing water or overflowing water especially over land
which is not normally submerged (ESCAP, UN, 1997). Due to the global climate change and the rapid urbaniza-
tion in the floodplains, the frequency of devastating floods tends to be higher and the loss of human lives and
property show no sign of decreasing (Chen, 2007). About 300 people lose their life each year due to floods and
landslides in Nepal with property damage exceeding 626 million NPR on average (DWIDP, 2007). Each year
many people are killed and made homeless by floods. Private and public properties as well as expensive and of-
ten vital infrastructure are damaged. As a consequence, the overall development of the country has been severe-
ly affected by repeated flooding (Khanal et al., 2007).
R. Talchabhadel, R. Sharma
2
The West Rapti River of Nepal is one of the most flood-prone rivers. Several villages in the lower part of
West Rapti River near the Nepal-India border get inundated each year due to floods during the monsoon season.
The Department of Hydrology and Meteorology (DHM) has been maintaining several hydrological and meteo-
rological stations in the basin, some of which are dedicated for flood forecasting and warning. Until 2009, there
was no systematic flood forecasting and warning system for the West Rapti River. In 2009, the Department of
Hydrology and Meteorology assessed the flood warning level and danger level (DHM, 2009). A web based
telemetry system for real time data acquisition was established in 2010. This paper presents an overview of the
real time data acquisition system and its applicability and effectiveness in saving lives and safeguarding valuable
assets of the communities.
2. Study Area
The West Rapti River inside Nepalese territory is selected as the study area. The West Rapti River basin is lo-
cated in the mid-western region of Nepal (Figure 1). Geographically the study area extends from 27˚56'50'' to
28˚02'30'' North latitudes and 81˚45'00'' to 81˚40'00'' East longitudes. The length of main stream channel is 257
km. The river originates from the middle mountains of Nepal, then enters the lowlands and finally drains to the
Ghagra (Karnali) River, a tributary of the Ganges River. It has several tributaries. Major tributaries are Jhimruk
River, Mari River, Arun River, Lungri River, Sit River, Dunduwa River, Sotiya and Gandheli rivulets. Down-
stream of the confluence of the Jhimruk and Mari Rivers, the river is named the West Rapti River.The average
slope of the basin is 16.8%. The source of runoff is due to the monsoon rainfall and groundwater. The drainage
network of the river basin and telemetry stations are shown in Figure 1.
The real-time stations in the West Rapti river basin are listed in Table 1. There are four hydrological stations.
The catchment area of the basins of Nayagaon, Cherneta, Bagasoti and Kusum gauging stations are 1980 km2,
644 km2, 3380 km2 and 5200 km2 respectively.
While the upper West Rapti River basin has a temperate climate, the lower basin including the Banke district
Figure 1. Location of West Rapti river Basin.
R. Talchabhadel, R. Sharma
3
Table 1. Real-time hydro-meteorological stations in the West Rapti River Basin (Source: www.hydrology.gov.np).
Real Time Meteorological station
SN St. No. Station Name Longitude Latitude Rema rks
1 530 Swargadwari 82˚37'59'' 28˚07'59'' Rainfall
2 527 Sulichour 82˚30'00'' 28˚10'59'' Rainfall
3 504 Libang gaun 82˚37'59'' 28˚18'00'' Rainfall + Temperature
4 505 Bijuwartar 82˚51'06'' 28˚06'11'' Rainfall + Temperature
5 537 Lamahi 82˚32'12'' 27˚52'14'' Rainfall
6 438 Dhakeri 81˚45'56'' 28˚09'24'' Rainfall
7 420 Nepalgunj 81˚40'05'' 28˚06'01'' All parameters
Real Time Hydrological station
SN St. No. Station Name Longitude Latitude Rema rks
1 339.3 Jhimruk at Cherneta 82˚49'05'' 28˚04'50'' Water Level
2 330 Mari at nayagaon 82˚47'56'' 28˚04'36'' Rainfall + Water Level
3 350 West rapti at Bagasoti 82˚48'11'' 27˚52'35'' Rainfall
4 365 West Rapti at Kusum 82˚05'38'' 28˚00'27'' Rainfall + Water Level
has a tropical to subtropical climate. The period from March to May is hot and dry, June to August is hot and
humid, September to October is pleasant, and November to February is cool and foggy with occasional rainfall
due to westerly winds. The temperature reaches 46˚C in summer in the lower part of the basin and falls below
2˚C during winter in the upper part of the basin. The study area receives summer monsoon rainfall extending
from June to September, accounting about 80% of the total annual. The average rainfall for West Rapti River
Basin is about 1500 mm. The relative humidity goes as low as about 60% in May to above 90% in January
(Talchabhadel, 2012).
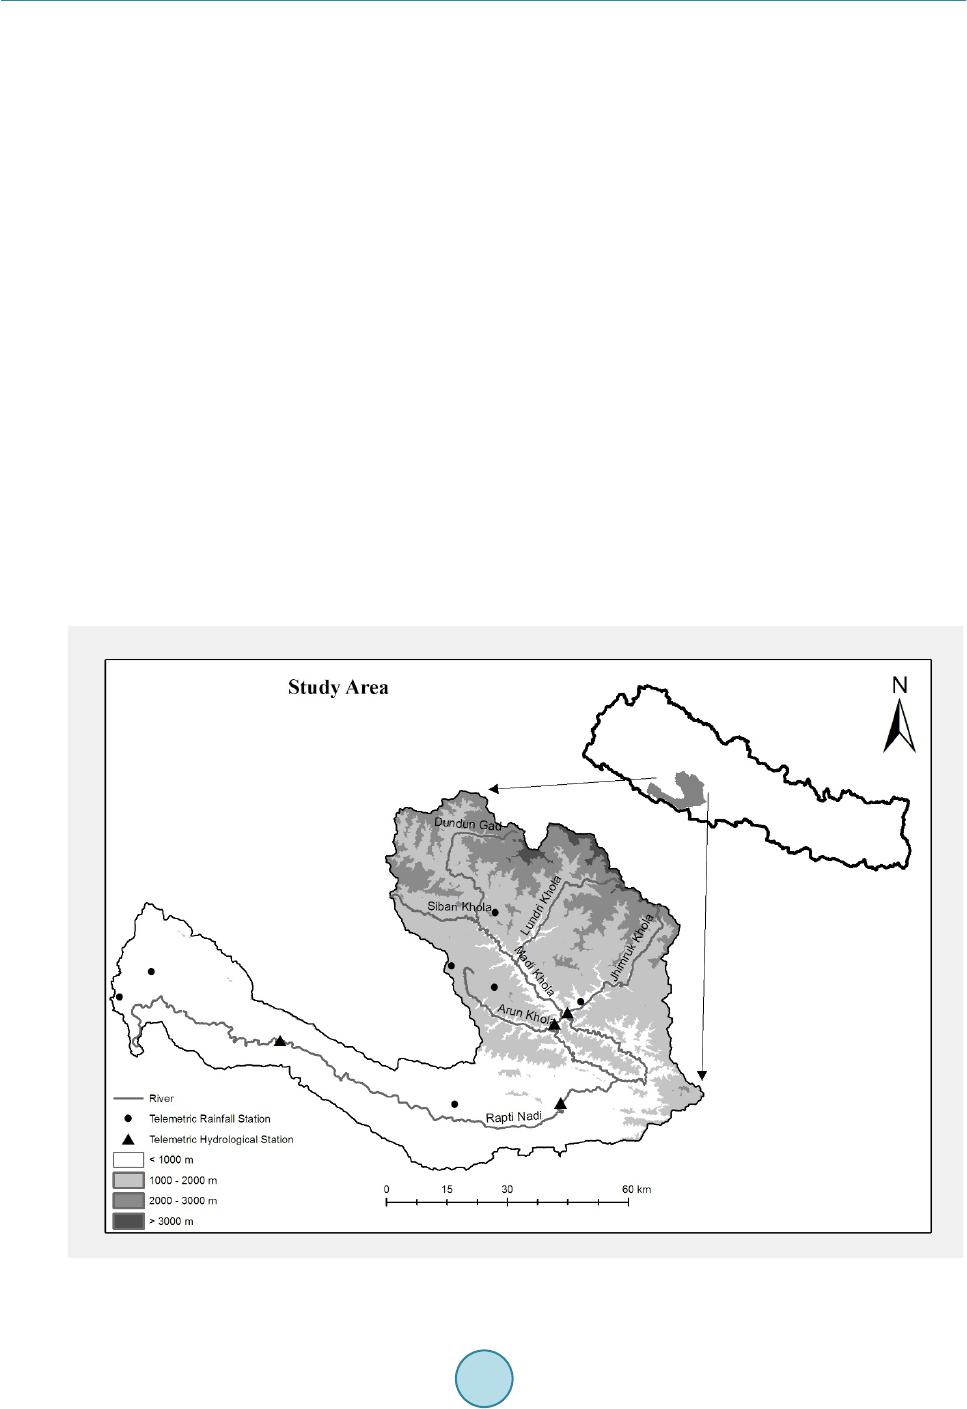
3. Flooding Problems
Floods are most common and widespread in Terai and Valley regions. The study area is located in Terai region
downstream of Sikta dam to the Nepal-India border of Banke district, in which flood is one of the natural ha-
zards. Due to the pressure of population growth and comparatively more availability of economic opportunities
during non-flood period, people are migrating and settling in the flood plains of rivers. In addition, unplanned
development activities make the people more vulnerable to flood. Flooding has been a serious problem for the
communities of the West Rapti River basin for years. It has been more devastating to the villages bordering In-
dia. The most affected villages are Betahani, Holiya, Binauna and Phatepur of Banke District. The deposition of
sediments in the farmland by the torrents originated from the Chure/Siwalik range, inundation due to flooding,
and bank cutting at various locations due to rapid geomorphological changes are the major problems affecting
lives and livelihoods of the people living on the lower West Rapti River basin. The Nepalgunj municipality and
the other villages have been suffering from drainage congestion and inundation problems due to unplanned
growth, faulty design of the drainage system and poor waste disposal practices (ICHARM, 2008).
The major causes of flooding in the West Rapti River basin are natural causes like. high rainfall ,soil erosion,
flat topography, debris flows and sedimentation, river channel migration, anthropogenic causeslike blockage of
drainage system, deforestation, poor planning, design and construction practices of roads, massive increase of
settlements along East-West highway, institutional causes like lack of participatory approach in disaster man-
age ment , lack of long-term comprehensive flood management plan covering whole flood prone areas and socio-
political causeslike lack of public sensitivity and awareness, attitude of people and culture of neglect (Gautam &
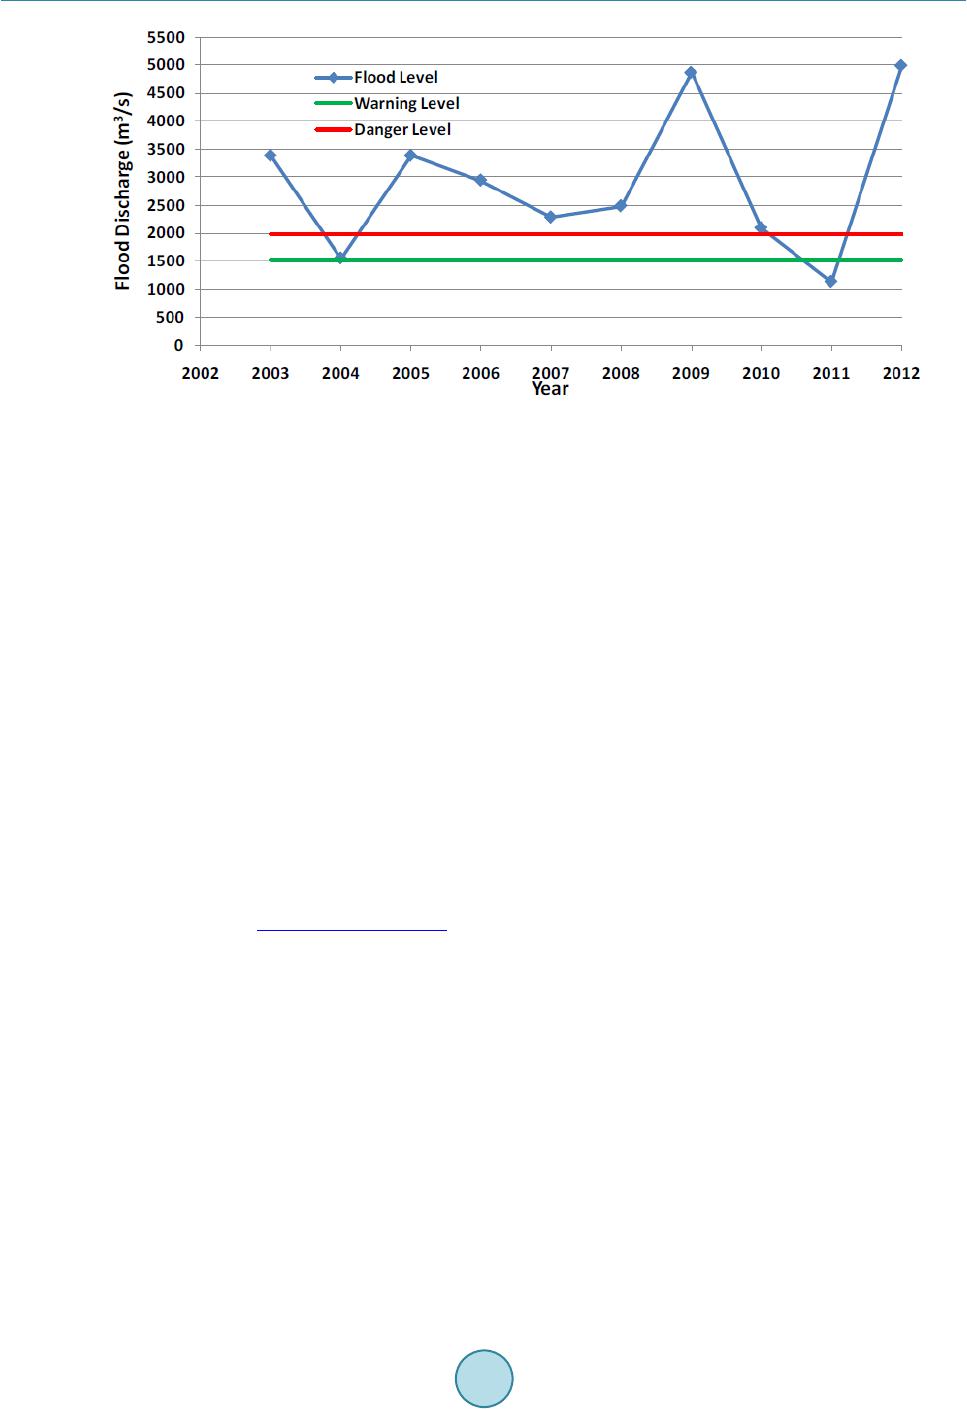
Phai j u, 2013). Figure 2 shows the flood discharge at Kusum from 2003 to 2012. Except in 2004 and 2011, the
flood discharge is higher than the danger level discharge of 2000 m3/s.
R. Talchabhadel, R. Sharma
4
Figure 2. Flood discharge at Kusum station (Source: Gau ta m & Phaiju, 2013).
4. Methodology
Installation of Monitoring Instruments for water level and rainfall was also done by DHM as shown in Table 1.
There are four hydrological stations on West Rapti basin for flood forecasting purpose. These are at Kusum,
Bagasoti, Nayagaon and Cherneta. The water levels were recorded three times per day manually and transmitted
through VHF wireless set. In 2010, DHM upgraded three sites with CDMA/GPRS cellular web-based telemetry
system under Irrigation and Water Resources Management Project supported by World Bank and one site is
equipped with VHF wireless set and mobile phone for data transmission. Similarly there are ten rainfall moni-
toring stations at Nepalgunj, Dhakeri, Kusum, Lamahi, Bagasoti, Nayagaon, Bijuwartar, Libang Gaon, Suli-
chour and Swargadwari. These stations were recording 24-hour rainfall with ordinary rain gauges. In 2010,
DHM upgraded these stations with tipping bucket rain gauge and CDMA/GPRS cellular telemetry system for
real time data transmission with the support from World Bank under Irrigation and Water Resources Manage-
ment Project. The data have been stored in the data logger and transmitted to the web server at a frequency of
five minute. This provided hourly rainfall data which is very useful for flood warning and developing a rain-
fall -runoff model (Gautam & Phaiju, 2013).
The Flood Forecasting Project of the Department of Hydrology and Meteorology conducted cross-section
surveys, flood hazard mapping and assessment of warning and danger level using a HEC-RAS model and GIS
tools. The study recommended the warning level and danger level at Kusum forecasting station as 5.00 m (1500
m3/s) and 5.40 m (2000 m3/s) respectively (Gautam & Dulal 2013). Hourly and daily data from all these data
were downloaded from www.hydrology.gov.np maintained by DHM and were analyzed, particularly the water
level crossing warning level and danger level.
5. Results
After installation of telemetric stations the water level did not cross the warning level and danger level in 2011.
The no. of days with water level crossing the warning level and danger level at least one time or more for 2012
and 2013 is shown in Figure 3. Similarly the cumulative hours of water level crossing the warning level and
danger level for 2012 and 2013 is shown in Figure 4. The maximum no. of hours crossing warning level and
danger level continuously for 2012 and 2013 is shown in Table 2.
On Aug 03-04 2012 and July 22-23 2013 water level remained above danger level for about 20 hours. The
effectiveness and success of the community based approach was observed during floods in 2012 (Gaut a m &
Phaiju, 2013). The rainfall patterns in entire country for these days from the real time telemetric stations are
sho wn in Figure 5 and Figure 6.
Relevant national and district stakeholders (National Emergency Operation CenterMinistry of Home Affairs,
District Emergency Operation Centre, District Disaster Relief Committees NGOs, INGOs etc.), Community
R. Talchabhadel, R. Sharma
5
Table 2. No. of hours of water level crossing WL and DL continuously (Source: www.hydrology.gov.np).
Date Max No. of Hours crossing WL continuously Max No. of Hours crossing DL continuously
2012 August 03-04 22 19
2013 July 22-23 21 18
Figure 3. Real time data analysis for determining no. of days with water level
crossing WL and DL (Source: www.hydrology.gov.np).
Figure 4. Real time data analysis for determining cumulative hrs of water
level crossing WL and DL (Source: www.hydrology.gov.np).
Based Organizations and communities were well informed ahead and the early warning system worked well.
Despite the huge flood that occurred time and again, there were no human casualties and the CDO was able to
communicate with the Indian counterpart to open gates of Laxmanpur Barrage downstream of west rapti well
ahead of the flood. This prevented the worsening of the flood situation and saved valuable properties.
6. Conclusion
The West Rapti River basin is one of the most flood prone river basins in Nepal. The real-time flood early
warning system together with the development of water management and flood protection schemes play a cru-
cial role in reducing the loss of lives and properties and in overall development of the basin. The non-structural
R. Talchabhadel, R. Sharma
6
Figure 5. Cumulative rainfall of August 03-04 2012 (Source:
www.hydrology.gov.np).
Figure 6. Cumulative rainfall of July 22-23 2013 (Source:
www.hydrology.gov.np).
mitigating measure places people away from flood. This method is designed to reduce the impact of flooding to
society and economy. On Aug 03-04 2012 and July 22-23 2013 water level remained above danger level for
about 20 hours. The effectiveness and success of the real time data acquisition and dissemination was observed
after establishment of telemetric system in west Rapti basin. Despite the huge flood that occurred time and again,
there were no human casualties.
References
Chen, P. (20 07) . Flood Impact Assessment using Hydrodynamic Modelling in Bangkok. The Netherlands: Thailand Interna-
tional Institute for Geo-Information Science and Earth Observation (ITC).
DHM (2009). Determination of Flood Danger Level in Flood Forecasting Stations. Kathmandu, Nepal: Department of Hy-
drology and Meteorology.
DWIDP (2007). Disaster Review, 2006, Series XIV. Kathmandu, Nepal: Department of Water Induced Disaster Prevention.
ES C AP, UN (19 97) . Manual and Guidelines for Comprehensive Flood Loss Revention and Management.
R. Talchabhadel, R. Sharma
7
Gautam, D. K., & Dulal, K. (2013). Determination of Threshold Runoff for Flood Warning in Nepalese Rivers. Journal of
Integrated Disaster Risk Management, 3,125-136. http://dx.doi.org/10.5595/idrim.2013.0061
Gaut am, D. K., & Phaiju, A. G. (2013). Community Based Approach to Flood Early Warning in West Rapti River Basin of
Nepal. Journal of Integrated Disaster Risk Management, 3, 155-169. http://dx.doi.org/10.5595/idrim.2013.0060
ICHARM (2008) A Feasibility Study on Integrated Community Based Flood Disaster Management of Banke District, Nepal.
International Centre for Water Hazard and Risk Management (ICHARM), ISSN 0386-5878, Technical Note of PWRI No.
4122.
Khanal, M., & Shr est ha, N.R. (2007). Preparing for Flood Disaster Mapping and Assessing Hazard in the Ratu Watershed,
Nepal. Kathmandu: ICIMOD.
Talchabh adel, R. (2012). Master Thesis on Rainfall Runoff Modeling for Flood Forecasting: A Case Study on West Rapti
Watersh ed. MSc Library IOE Pulchowk Campus.
www.hydrology.gov.np