 Technology and Investment, 2011, 2, 142-153 doi:10.4236/ti.2011.22015 Published Online May 2011 (http://www.SciRP.org/journal/ti) Copyright © 2011 SciRes. TI An Integrated Approach for Selecting Information Systems: A Case Study Konstantinos Viglas1, Panos Fitsilis2, Achille s Kameas1 1Hellenic Open University, Patras , Greece 2Technological Educational Institute of Larissa, Larissa, Greece E-mail: kviglas@yahoo.com; fitsilis@teilar.gr; kameas@eap.gr Received March 22, 2011; revised April 28, 2011; accepted May 4, 2011 Abstract There is agreement within the academia and practitioners that IT investments should be evaluated in order to be in agreement with the overall strategic objectives of an organization. Moving toward to this direction, the aim of this paper is to present a model that combines Balanced ScoreCard (BSC) methodology and a deci- sion support method such as Analytic Network Process (ANP) for assisting the selection of an IT system. The proposed model provides a simple, flexible and easy to use approach that can be applied by organiza- tions to support their investment decisions. The proposed approach is presented through a case study for se- lecting a Quality Management Information System for a large Greek retailer. Keywords: Multi-Criteria Decision making, Balanced Scorecard, Analytic Network Process 1. Introduction Information system selection plays an important role in all modern organizations since their smooth and efficient op- eration depends heavily on Information Systems (IS). Fur- thermore, large software systems are built by using com- ponents developed by others (commercial or open source), therefore an inc reasing need ap pears to se lect the righ t sys- tem, the appropriate components in a systematic, factual, objective, and cost efficient manner. The selection process is far from being trivial since it has to combine many, complex and in many cases contradict- ing factors such as: business strategy, numerous functional and non-functional requirements, operating priorities, availability of resources etc. [1,2]. Traditional approaches and methods for selecting infor- mation systems focus on well-known financial measures, such as the Return On Investment (ROI) [3], Net Present Value (NPV), the Internal Rate of Return (IRR), Cost/ Benefit Analysis (CBA) and the payback period [4,5]. However, these methods cannot offer the analytical power needed for today’s complex decisions, since they fail in quantifying intangible criteria. Multi-criteria decision making (MCDM) can be quite useful to support an IT system selection process. Although there is no generic methodology that can be adopted for selecting a soft ware packag e o f any type, liter atur e reviews on evaluating software products suggest that users and de- cision makers can receive a lot of support, if they decide to adopt an MCDM method [6]. In particular, the findings of review studies [6,7] present that the Analytic Hierarchy Process (AHP) has been widely and successfully used in evaluating several types of software packages (e.g., MRP/ERP systems, simulation software, CAD/CASE sys- tems, Knowledge Management systems etc.). The AHP method was introduced by Saaty [8] and its primary objec- tive is to classify a number of alternatives (e.g., a set of candidate software packages) b y considering a given set of qualitative and/or quantitative criteria, according to pair wise comparisons/judgments provided by the decision makers. AHP r esults in a hierarch ical lev eling of the se lec- tion criteria, where the upper hierarchy level is the goal of the decision process, the next level defines the selection criteria which can be further subdivided into subcriteria at lower hierarchy levels and, finally, the bottom level pre- sents the alternative decisi ons to be evaluat ed. A newer version of AHP is Analytic Network Process (ANP) and is considered as a generic form of AHP. The main difference between AHP and ANP is th at AHP struc- tures a decision problem into levels forming a hierarchy, while the ANP is using a network approach. ANP allows both interaction and feedback within clusters of elements (inner dependence) and between clusters (outer depend- ence). Such feedback capture s the co mplex effec ts of inter-  K. VIGLAS ET AL.143 play in co mplex situat ions in a better wa y, esp ecially when risk and uncertainty are involved [9,10]. Nevertheless, the overall decision process should be fil- tered in the context of business strategy. This can be ac- complished with the application of Balanced Scorecard Method (BSC). Not only being a methodology, BSC is considered a performance measurement framework that provides an integrated look at the business performance of an organization by a set of both financial and non-financial objectives. Obviously, the selection of the appropriate information system can offer strategically, tactical and operational ad- vantages to an organization. However, this selection is a complex process that should be in line with the overall strategy, take into account financial aspects and at the same time be analytical. In our paper, through the case study under investigation, we present a model that starts at the high level with the strategic objectives of an organization, as they have been described by the use of BSC, and ends wi th the application of ANP method, which quantifies and balances the low level criteria. The application of this model can greatly assist both the high and mid level management in approaching the deci- sion process from a different perspective, while at the same time this decision is factual, consistent and well docu- mented. The structure of the paper is as follows, Section 2 pre- sents the relevant literature background and an overview of the employed methodologies. Section 3 presented the pro- posed approach. In Section 4 we demonstrate the proposed approach though the presentation of a case study. The case study is focusing on the selection of a Quality Management System (QMS) for a multinational food retail organization. Conclusions and extensions of the research work are ad- dressed in chapter 5. 2. Background 2.1. Financial Methodologies for IS Selection Traditionally, investment appraisal was based on finan- cial accounting methodologies, such as return on invest- ment and payback period. Their application has been criticized as biased [11], since they tend to overlook market status, human capital and process improvement, growth opportunities etc. As such, they cannot measure objectively past performance and forecast future out- comes. However, financial indices are always considered important since they measure the monetary value of the IT investment. Net Present Value (NPV) is defined as the total Pre- sent Value (PV) of a time series of cash flows. It is a standard method for using the time value of money to appraise long-term projects [12]. It is defined with the formula 011 ttt C NPV Cr (1) where C0 defines the initial investment, Ct is the valua- tion of the current cash flow and r is the discount rate. Intuitively, NPV defines what would cost today a cash flow that will take place in the future. In practical terms, if NPV is positive then the investment adds value to the business, the project is profitable and therefore the IT system should be developed or purchased. Similar to NPV’s measure is IRR (Internal Rate of Re- turn), which is defined with the formula 010 1 ttt C CIRR (2) Semantically, IRR is the calculation of the rate that nullifies NPV [13]. In case of selection between mutually exclusive alternatives and especially when the initial co st is different, incremental analysis shall be applied in o rder to evaluate the IRR of the difference between two alter- natives with the smaller cost [14]. The reason behind the application of incremental analysis lies to the fact that IRR is measuring one single alternative. Return of Investment (ROI), is a popular accounting method for evaluating investments. ROI defines how much an organization gets from the spent amount of money. Therefore, ROI helps an organization to decide on different investment alternatives. ROI is defined as cos investment profit ROI investment t (3) and provides a comparison of the investment result ver- sus the investment cost [13]. Investment profit is defined as the ex pec ted inco me min us the inve stmen t cos t, whe re the investment cost is the initial cost plu s the cost during the life-cycle of the project. Finally, Payback Period (PP) is used to evaluate in- vestments where the payback period of the investment (the period needed to replenish the initial cost) is com- pared to a predefined time period, the so-called cut-off period. It is calculated by deducting the initial cost of an investment from the financial benefits of the investment throughout the def ined periods (months, years, etc.). E.g. if the payback period is three years and the result of the above mentioned operation on the third year (or earlier) is bigger than zero, the investment must take place, oth- erwise it must not. 2.2. Multi-Criteria Decision Making with Analytic al Pro cesses An MCDM method (like AHP and ANP) overcomes the Copyright © 2011 SciRes. TI 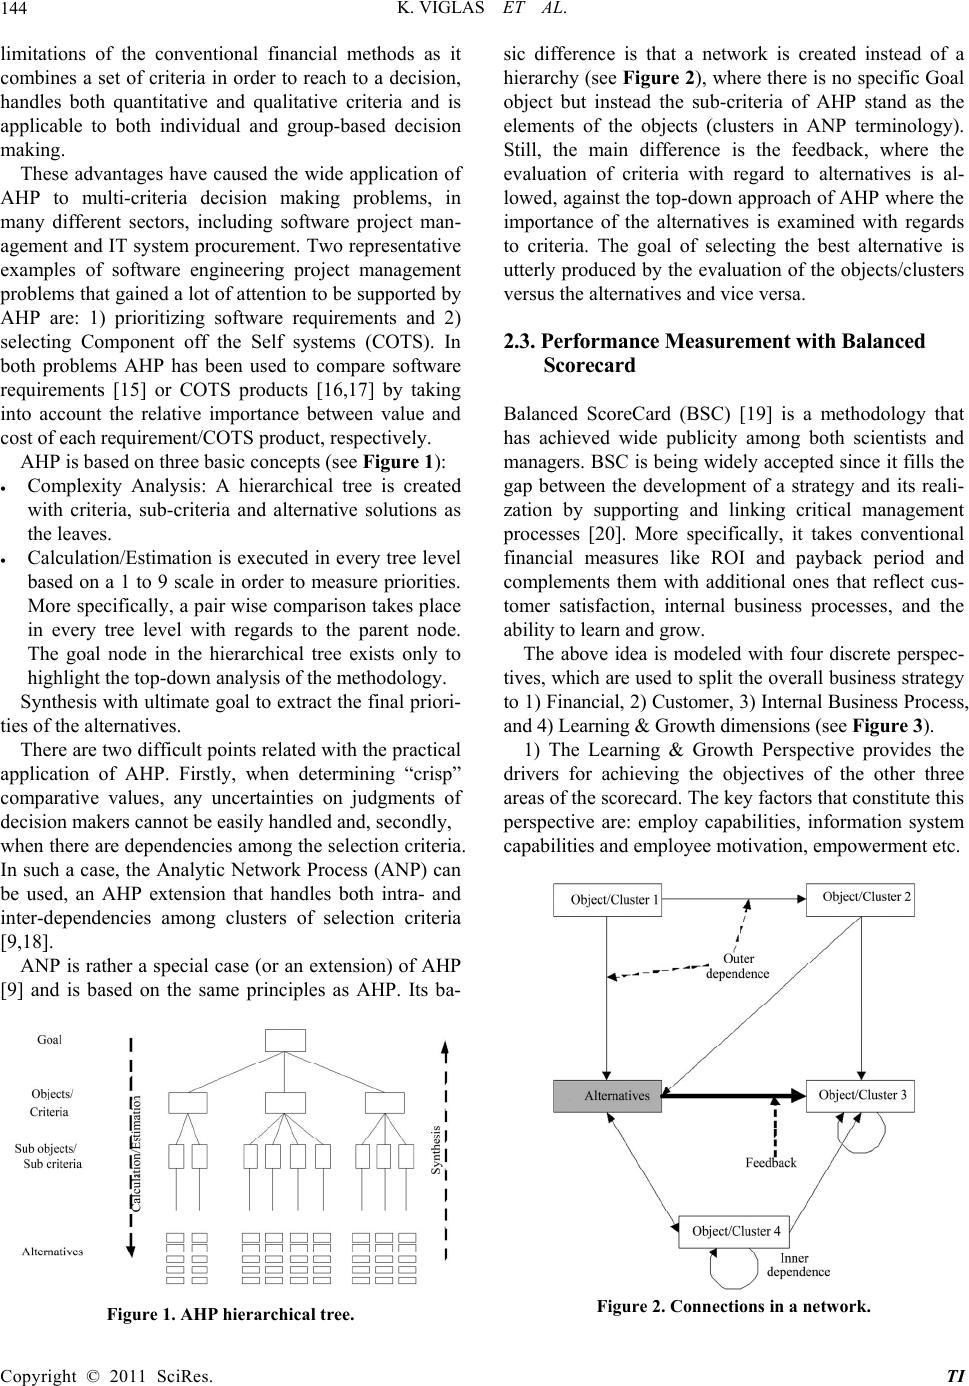 K. VIGLAS ET AL. Copyright © 2011 SciRes. TI 144 vantages have caused the wide application of A Estimation is executed in every tree level tie lt points related with the practical ap rather a special case (or an extension) of AHP [9 limitations of the conventional financial methods as it combines a set of criteria in order to reach to a decision, handles both quantitative and qualitative criteria and is applicable to both individual and group-based decision making. These ad HP to multi-criteria decision making problems, in many different sectors, including software project man- agement and IT system procurement. Two representative examples of software engineering project management problems that gained a lot of attention to be suppo rted by AHP are: 1) prioritizing software requirements and 2) selecting Component off the Self systems (COTS). In both problems AHP has been used to compare software requirements [15] or COTS products [16,17] by taking into account the relative importance between value and cost of each requirement/COTS product, respectively. AHP is based on three basic conce pts (see Figure 1): Complexity Analysis: A hierarchical tree is created with criteria, sub-criteria and alternative solutions as the leaves. Calculation/ based on a 1 to 9 scale in order to measure priorities. More specifically, a pair wise comparison takes place in every tree level with regards to the parent node. The goal node in the hierarchical tree exists only to highlight the top-down analysis of the methodology. Synthesis with ultimate goal to extract the fin al priori- s of the alternatives. There are two difficu plication of AHP. Firstly, when determining “crisp” comparative values, any uncertainties on judgments of decision makers cannot be easily handled and, secondly, when there are dependencies among the selection criteria. In such a case, the Analytic Network Process (ANP) can be used, an AHP extension that handles both intra- and inter-dependencies among clusters of selection criteria [9,18]. ANP is ] and is based on the same principles as AHP. Its ba- Figure 1. AHP hierarchical tree. sic differencnstead of a 2.3. Performance Measurement with Balanced alanced ScoreCard (BSC) [19] is a methodology that d with four discrete perspec- tiv he dri e is that a network is created i hierarchy (see Figure 2), where there is no specific Goal object but instead the sub-criteria of AHP stand as the elements of the objects (clusters in ANP terminology). Still, the main difference is the feedback, where the evaluation of criteria with regard to alternatives is al- lowed, against the top -down approach of AHP where the importance of the alternatives is examined with regards to criteria. The goal of selecting the best alternative is utterly produced by the evaluation of the objects/clusters versus the alternatives and vice versa. Scorecard B has achieved wide publicity among both scientists and managers. BSC is being widely accepted since it fills the gap between the development of a strategy and its reali- zation by supporting and linking critical management processes [20]. More specifically, it takes conventional financial measures like ROI and payback period and complements them with additional ones that reflect cus- tomer satisfaction, internal business processes, and the ability to learn and grow. The above idea is modele es, which are used to sp lit the overall business strategy to 1) Financial, 2) Customer, 3) Internal Business Process, and 4) Learning & Growth dimensi ons (see Figure 3). 1) The Learning & Growth Perspective provides t vers for achieving the objectives of the other three areas of the scorecard. The key factors that constitute this perspective are: employ capabilities, information system capabilities and employee motivation, empowerment etc. Figure 2. Connec tions in a network. 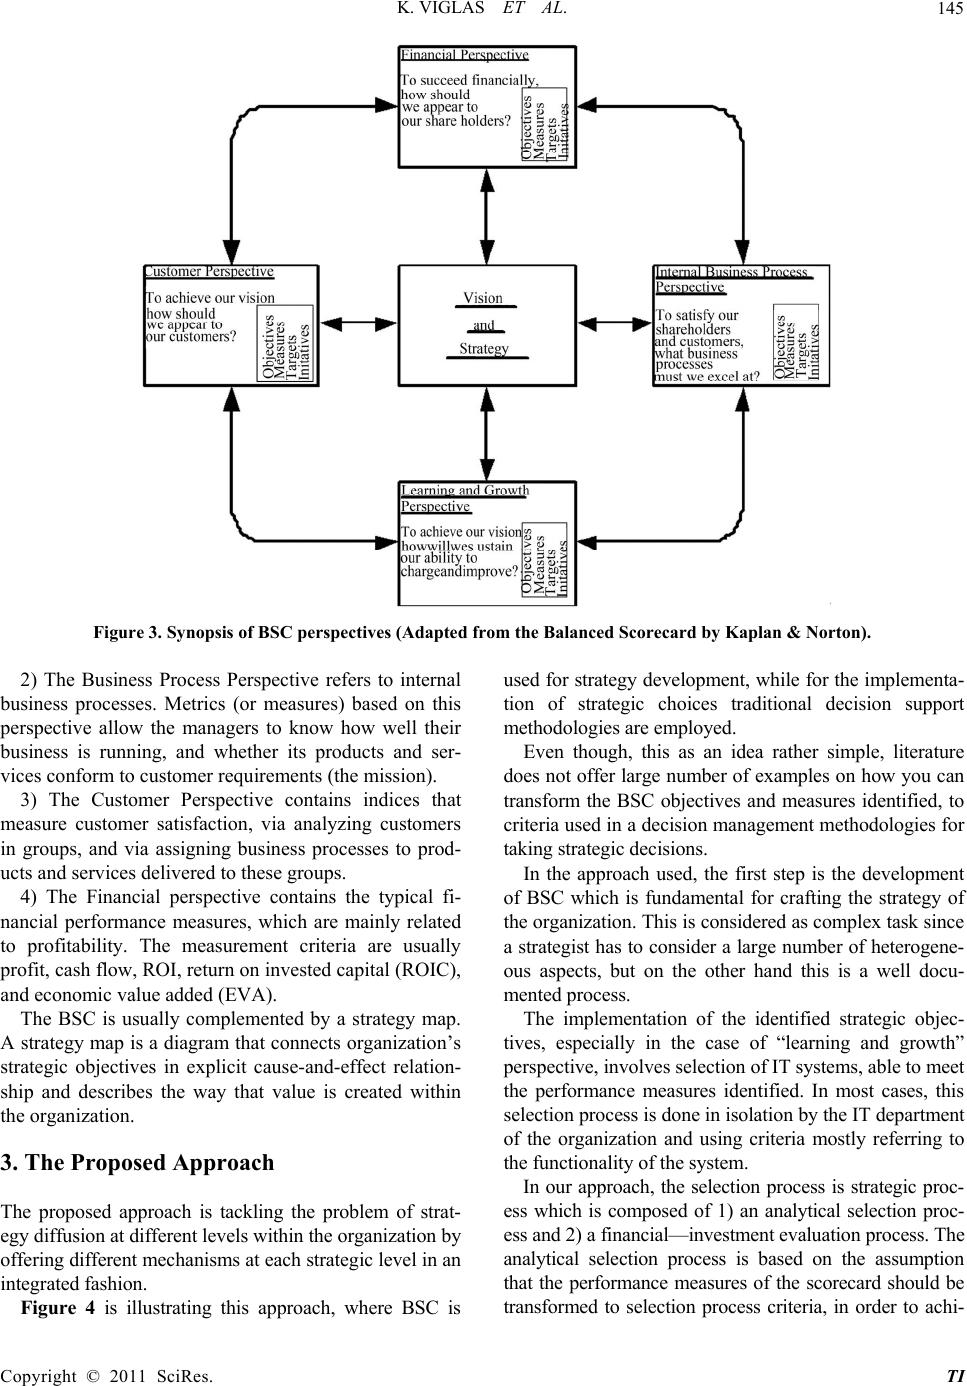 K. VIGLAS ET AL.145 Figure 3. Synopsis of BSC perspe c t ive s (Adapte d from the Balanced Scorecard by Kaplan & Norton). 2) The Business Process Perspective refers to internal bu at m typical fi- na ed by a strategy map. A . The Proposed Approach he proposed approach is tackling the problem of strat- g this approach, where BSC is used for strategy development, while for the i mplementa- tio ples on how you can tra l for crafting the strategy of th in the case of “learning and growth” pe nalytical selection proc- es siness processes. Metrics (or measures) based on this perspective allow the managers to know how well their business is running, and whether its products and ser- vices conform to customer requirements (the mission). 3) The Customer Perspective contains indices th easure customer satisfaction, via analyzing customers in groups, and via assigning business processes to prod- ucts and services delivered to these groups. 4) The Financial perspective contains the ncial performance measures, which are mainly related to profitability. The measurement criteria are usually profit, cash flow, ROI, return on invested capital (ROIC), and economic value added (EVA). The BSC is usually complement strategy map is a diagram that connects organization’s strategic objectives in explicit cause-and-effect relation- ship and describes the way that value is created within the organization. 3 T egy diffusion at di fferent l e vel s wi t hi n the or gani zat i on by offering different mechanisms at each strategic level in an integrated fashion. Figure 4 is illustratin n of strategic choices traditional decision support methodologi es are empl oyed. Even though, this as an idea rather simple, literature does not offer large number of exam nsform the BSC objectives and measures identified, to criteria used in a decision management methodologies for taking strategic deci si ons. In the approach used, the first step is the development of BSC which is fundamenta e organization. This is considered as complex task since a strategist has to consider a large number of heterogene- ous aspects, but on the other hand this is a well docu- mented process. The implementation of the identified strategic objec- tives, especially rspective, involves select i on of IT sy st ems, able to meet the performance measures identified. In most cases, this selection process is done in isolation by the IT department of the organization and using criteria mostly referring to the functionality of the system. In our approach, the selection process is strategic proc- ess which is composed of 1) an a s and 2) a financial—investme nt evaluation process. The analytical selection process is based on the assumption that the performance measures of the scorecard should be transformed to selection process criteria, in order to achi- Copyright © 2011 SciRes. TI 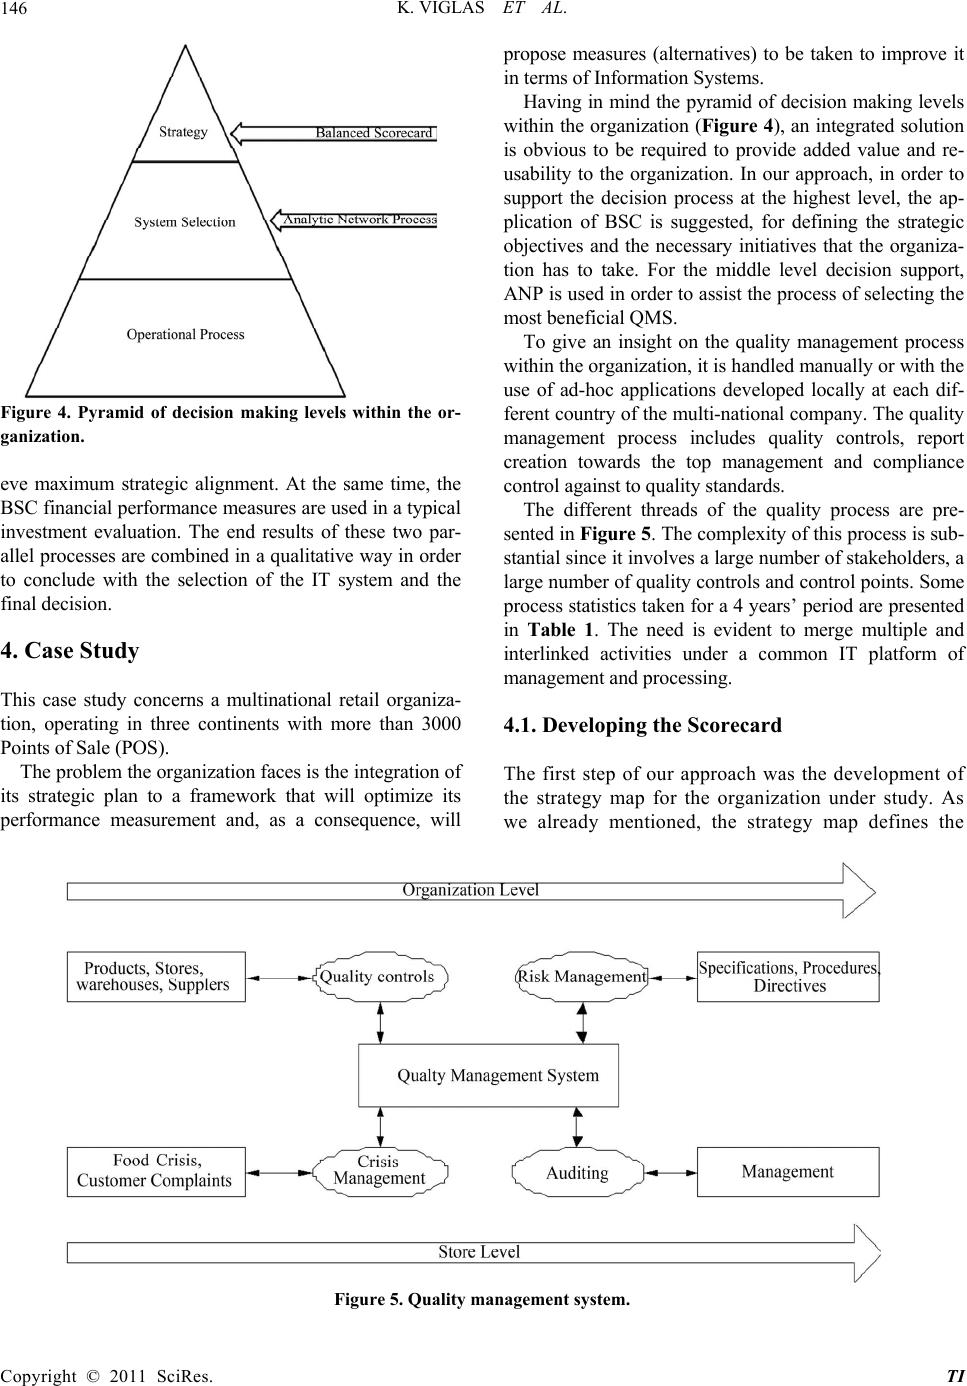 K. VIGLAS ET AL. 146 Figure 4. Pyramid of decision making levels within the or- ganization. m strategic alignment. At the same time, the SC financial performance measures are used in a typical y ncerns a multinational retail organiza- on, operating in three continents with more than 3000 framework that will optimize its pe eve maximu B investment evaluation. The end results of these two par- allel processes are combined in a qu alitative way in order to conclude with the selection of the IT system and the final decision. 4. Case Stud This case study co ti Points of Sale (POS). The problem the organization faces is the integration of its strategic plan to a rformance measurement and, as a consequence, will propose measures (alternatives) to be taken to improve it in terms of Information Systems. Having in mind the pyramid of decision making levels within the org anization (Figure 4), an integrated solution is obvious to be required to provide added value and re- usability to the organization. In our approach, in order to support the decision process at the highest level, the ap- plication of BSC is suggested, for defining the strategic objectives and the necessary initiatives that the organiza- tion has to take. For the middle level decision support, ANP is used in order to assist the process of selecting the most beneficial QM S. To give an insight on the quality management process within the org anizatio n, it is h an d led manu all y or with th e use of ad-hoc applications developed locally at each dif- ferent country of the multi-n ational company. The qu ality management process includes quality controls, report creation towards the top management and compliance control against to quality standards. The different threads of the quality process are pre- sented in Figure 5. The complexity of this p rocess is sub- stantial since it involves a large number of stakeholders, a large number of quality controls and control points. Some process statistics taken fo r a 4 years’ period are presented in Table 1. The need is evident to merge multiple and interlinked activities under a common IT platform of managem ent and processing. 4.1. Developing the Scorecard The first step of our approach was the development of the strategy map for the organization under study. As we already mentioned, the strategy map defines the Figure 5. Quality management system. Copyright © 2011 SciRes. TI  K. VIGLAS ET AL.147 Table 1. Quality control in the organization. No Activity Volume for a Period of 4 Years 1 Qu a lity C o nt r o l o f P r o d u c t s ( L a b Te s t s ) 9700 2 Quality Control at the Level of Stores 850 3 Supplier Control (Providers) 150 4 Supplier Control (Agriculture Products) 60 5 Production of Reports 1300 6 Customer Complaints 4500 7 Crisis Management 200 strategic objectives of the organization for every per- spective of the balanced scorecard and interlinks these objectives with cause-effect relations. The cause-effect relations define a finish-to-start relationship between objectives. Figure 6 presents the strategic map for the organization. The arrow connections imply cause- effect relation, e.g. Process Quality Assu ess Stauality Improvement or that Service Quality A a prerisite for Custtisfaction. The second step of our method is the detefini- tion e strategic objec- tive will sed to measure the performance related with the objective, its scope, the measurement frequency (yearly, monthly), etc. Additionally, in order to b e able to compare and quan- titatively evaluate each objective, we need to assign a weight to each goal within the perspective. A snapshot of the detailed definition of some of the strategic ob jectives is presented in Table 2. As it appears in the table, the implementation of a QMS is the proposed strategic ini- tiative for some objectives (CP2, CP3). In order to calculate the priorities of the organiza- tion’s strategy regarding the initiatives to take, we add the products of the weights of every strategic objective with the weight of the hosting perspective [21]. E.g. Process standardization, Process Quality Assurance and Service Quality Assurance suggest QMS as the preferred initiative to be undertaken. After doing these calculations, we end up to a score of 39% for QMS as the suggested strategic initiative. For all calculons, Figure 7, we have used the tool Bal- bu rance and Proc-as presented in ndardization are prerequisites for Product Q ssurance is ailed d equomer Sa ofach strategic objective. For each weneed to define the metrics that be u ati anced Scorecard Designer (http://www.strategy2act.com). Balanced Scorecard Designer is a tool that helps in ilding balance scorecards. Having decided that the correct strategic initiative to be undertaken is the development of QMS, the next step is to proceed with the evaluation of alternative Figure 6. Strategic map of the organization. Copyright © 2011 SciRes. TI  K. VIGLAS ET AL. 148 Table 2. Snapshot of the analysis of Strategic goals and performance measures. Strategic objectives Objective description Performance measures TargetFrequency Weight Strategic Ini- tiatives Product quality improvement (CP2) The target is to improve product quality and its maintenance to high level, allowing the organi- zation to be considered as “best in class” Minimization of the ratio of defective items versus total items produced (per prod- uct) 0.01%Yearly 4 OMS Imple- mentation Customer Satisfaction (CP3) The target is to maintain cus- tomer satisfaction in the highest level Minimization of the com- plaints per store ratio 5% Yearly 3 OMS Imple- mentation Product adjust- ment to custom- ers’ needs (CP4) The target is to adjust products customer’ needs ,using data like cultural habits, geographical position or customer’ habits for sales maximization Ratio of special products’ gross profit per their sales 10% Yearly 1 OMS Imple- mentation QM systems. As a last comment, what must be clear for BSC is that it requires the participation of all the organization, lead by a project team or in other cases the manage- ment team, for all the steps mentioned above. 4.2. Applying Financial Measures The organization sent Request for Information (RFI) to different vendors in a form of questionnaire and received information from 10 vendors referring to 10 different QMS systems. The project team evaluated them and eliminated those with the lower perfor to three alternatives, t nted in the case stlecting th tihe succed of activity by uina th2]. itial analys d period of six yearsost oner- sh). TCO d dt related with an IT sys quince ierating cost och co w ve Table 3 presentsfor a period of preferred alternatives [21]. A short ivities of r producing the spent on each ctivity at the company level, number that came as a The calculations of the NPV, IRR and ROI for the three alternatives are presented in Table 5. Consequently, one can progress the alternative B as the most preferable solution, as it proves to have the biggest ROI, as well as NPV and ROI. Still, this result depends only on financial measures and is not taking into consideration intangible criteria, such as functionality, that are examined within the ANP framework. 4.3. Applying Analytical Network Process The next step in our approach was the application ofan for evaluation and selection. In our P due to its superior- ity in defin cri To setupasvalof thdif- oducts/vendors a set of criteria was created by g duriorksho(see Tf- s, the criteria were sorted in four major categories: Cost, Functionality, Technology and Supplier. For each themre w criter(that nd w). In thst steprithb- lem and scope definition takes place, as follows: the criteria anr conntions P an bFigure 8: Among others, it is worth to observe 3 points: 1) The element DB connectivity and the relative clus- is an element in this cluster that is co the scale presented, for defining their relative importance. mance, resulting in analytical method he systems A, B, C (this process is case, we have decided to follow AN ot presenudy). Se ssful ones in their fiele alterna- ves from t sing the prelim e decision [2 An in ry elimination increases the is of the investments was calculati quality of one for a f Ow ferent pr consultin terward ng the Total C is a financial estimate that costs ip (TCOetermines tem. It is one of belo irect and indirec te useful, si f a system whi ith the initial in t takes into account the op in the case of IT system is stment and significant. the TCO for the QMS mparable All model c six years for the three description of the process to end up to the three preferred alternatives is described in paragraph 3.3. In order to apply the financial methods we need to calculate the benefits of installing a QMS system to the organization by qualifying and valuating the act Table 1. The key metric that wa s used fo financial benefits is the averag e man-hours a feedback from the HR department of the organization [21] (see Table 4). Additionally, we calculate an increase of 10% for each year, attributed to the organization’s organic growth. ters/elements it is connected (can be seen in bold squares for clusters Alternatives and Supplier) 2) Feedback takes place between clusters Alternatives and Cost 3) Inner-dependence appears in cluster Functionality, meaning that there ing relatio the bnships between is for the e the uation teria. e three users ng a wp able 6). A , the e 1ere sub of the ANP algo ia can be fou m, the pro d theiecof the AN e seen in nnected with an element within Functionality. Like AHP, pair wise comparisons take place between elements based on the Saaty’s Fundamental Scale of Absolute Numbers [23] (see Table 7). Each element in compared to all other elements, using Copyright © 2011 SciRes. TI  K. VIGLAS ET AL.149 Table 3. TCO for QMS. Alternative Alternative T A B Alternative C Investment Cost 248,500 134,000 188,000 Operating Costs 147,125 67,000 106,500 Table 4. Financial benefit realized per activity. Activities Financial Benefit Quality control of products (lab tests) 43,650 Quality con trol at the le vel of sto res 61,200 Supp lie r co n t ro l (p ro v id ers ) 5400 Supplier control (agriculture products) 2160 Production of Reports 5850 Customer complaints 20,250 Crisis management 3600 142,110 Table 5. Application of NPV, IRR and ROI for QMS. Alternative A Alternative B Alternative C NPV 316753.90 495237.08 409694.67 IRR 45.08% 102.25% 67.42% ROI 119.30% 331.64% 194.60% Table 6. QMS Selection cr ite ria. C1: Cost C11: Implementation cost C12: License cost C13: Maintenance cost C2: Functionality C22: Flexibility C23: Product audit C24: Repor C21: Email notification ts ile C25: Store audit C26: Supplier audit C27: Security C31: Company prof C3: Supplier C32: Implementation time C33: International solution C4: Technology C41: Databases C42: DB connectivity C43: Infrastructure C44: Migration tools C45: Reporting tools C46: Web application able 7. Saaty’s Fundamental Scale of Absolute Numbers. Numerical Ratf Preferences ing Verbal Judgments o 9 Exred tremely prefer 8 ry rem Very streferred Strongly strongly Stroerred 4 Moderately to strongly 2 Equally to moderately 1 Equally pr Vestrongly to extely 7 ongly pr to very6 5 ngly pref 3 Moderately preferred eferred For example, the pair wise comparisonn Li- c and Main cost smoderately more imrtant (3 times) than Implementation cost and Mainte cost. I cost hav same i the pair wise comparmatrix, wate the priority of eac tbution to the overall goallecting the best system. This step of the process is nthe- the results are presented in Table 8. Fon) vec ri- ate positions in the supermatrix. In our case study we hav uDe(h- persionso operatonstratole ps (T ing sub-matr as colurow “nappears mentionde- ce of element C24: Reports with regards to all the ther elements of the values are zero this imp not depend to the examined elemehip appears in the rix havister Alterna- tives and as row the clhe ele- ments of Technology were compared with regards to the Alternatives (in bold tvalues for System B). Finally, total zero values in theas column the cluy anster Cost indicate that there is no connec of Cost with regards to Technology, as it cin the model (no arrow from Technology The last step of syntesis, pair wise comparisons take placelusterof the Cluster Weig [24].ing Cluster Weights Matrix is tha an ele- ment with the highest priority. That does not necessarily mean that this element has the highest priority among all other elements of the other clusters [9]. There comes the need to compare all the clusters in pairs with regards betwee ense cost, Implementation costtenance hows that License cost is po enanc mplementation and Maintenancee the mportance. After constructingison e can now calculh element in erms of its contri of se called sy sis and llowing the same process, all priority (or Eige tors are produced and are finally put in the approp esed Super cisions tool ttp://www.su -deci roces .com) t able 9). e and deme the wh Check on theix havingmn and Functio enden lity”, it athe aforeed inner p o cluster it belong s. When lies that the specific ele ments do nt. Feedback relations e clusub matng as column th uster Technology, where t he sub-matrix having ster Technologd as row the clu tion between an be also seen to Cost). h between c hts Matrixs for the creation The reason of creat t in every cluster there is Copyright © 2011 SciRes. TI 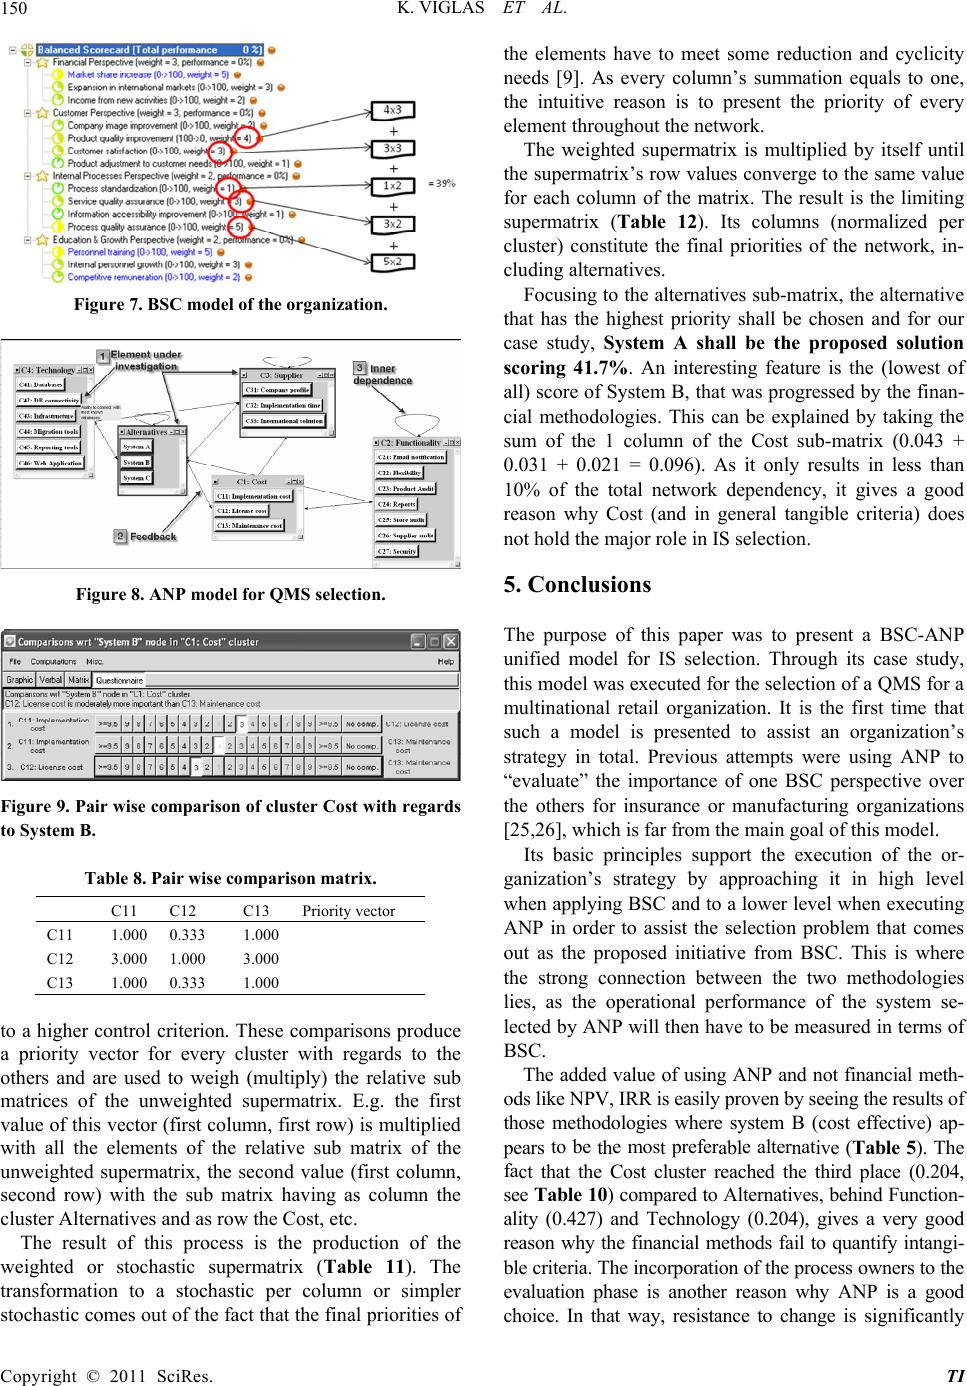 K. VIGLAS ET AL. Copyright © 2011 SciRes. TI 150 Fie 7. BSC mode gurl of the organization. Figure 8. ANP model for QMS selection. Figure 9. Pair wise comparison of cluster Cost with regards to System B. Table 8. Pair wise compar is on mat ri x. C11 C12 C13 Priority vector C11 1.000 0.333 1.000 C12 3.000 1.000 3.000 C13 1.000 0.333 1.000 to a higher control criterion. These comparisons produce a priority vector for every cluster with regards to the others and are used to weigh (multiply) the relative sub matrices of the unweighted supermatrix. E.g. the first value of this vector (first column, first row) is multiplied with all the elements of the relative sub matrix of the unweighted supermatrix, the second value (first column, second row) with the sub matrix having as column the cluster Alternatives and as row the Cost, etc. The result of this process is the production of the weighted or stochastic supermatrix (Table 11). The transformation to a stochastic per column or simpler stochastic comes out of the fact that the fina l priorities of the elements have to meet some reduction and cyclicity needs [9]. As every column’s summation equals to one, the intuitive reason is to present the priority of every element throughout the network. The weighted supermatrix is multiplied by itself until the supermatrix’s row values converge to the same value for each column of the matrix. The result is the limiting supermatrix (Table 12). Its columns (normalized per cluster) constitute the final priorities of the network, in- cluding alternatives. Focusing to the alternatives sub-matrix, the alternative that has the highest priority shall be chosen and for our case study, System A shall be the proposed solution scoring 41.7%. An interesting feature is the (lowest of all) score of System B, that was progressed by the finan- cial methodologies. This can be explained by taking th sum of t0.043 .031 + 0% of the total network dependency, it gives a good reason why Cost (and in general tangible criteria) does not hold the major role in IS selection. 5. Conclusions The purpose of this paper was to present a BSC-ANP unified model for IS selection. Through its case study, this model was ex ecuted for the selection of a QMS for a multinational retail organization. It is the first time tha such a mzation’s trategy in total. Previous attempts were using ANP to “evaluate” the importance of one BSC perspective over the others for insurance or manufacturing organizations [25,26], which is far from the main goal of this model. Its basic principles support the execution of the or- ganization’s strategy by approaching it in high level when applying BSC and to a lower level when executing NP in order to assist the selection problem that comes ut as the proposed initiative from BSC. This is where perational performance of the system se- cted by ANP will then have to b e measured in terms of BSC. Thadded og Andl meth- ods liPVis proven byeeing the results of those ods syBcost effective) ap- pears thtablnive (Table 5). The ct that the Cost cluster reached the third place (0.204, e + he 1 column of the Cost sub-matrix ( 0.021 = 0.096). As it only results in less than0 1 t odel is presented to assist an organi s A o the strong connection between the two methodologies lies, as the o le e valuef usinNP a not financia ke N, IRR easily s methologie wherestem ( to bee mos prefere alterat fa see Ta ble 10) compared to Alternatives, behind Function- ality (0.427) and Technology (0.204), gives a very good reason why the financial methods fail to quantify intangi- ble criteria. The incorporation of the process owners to the evaluation phase is another reason why ANP is a good choice. In that way, resistance to change is significantly 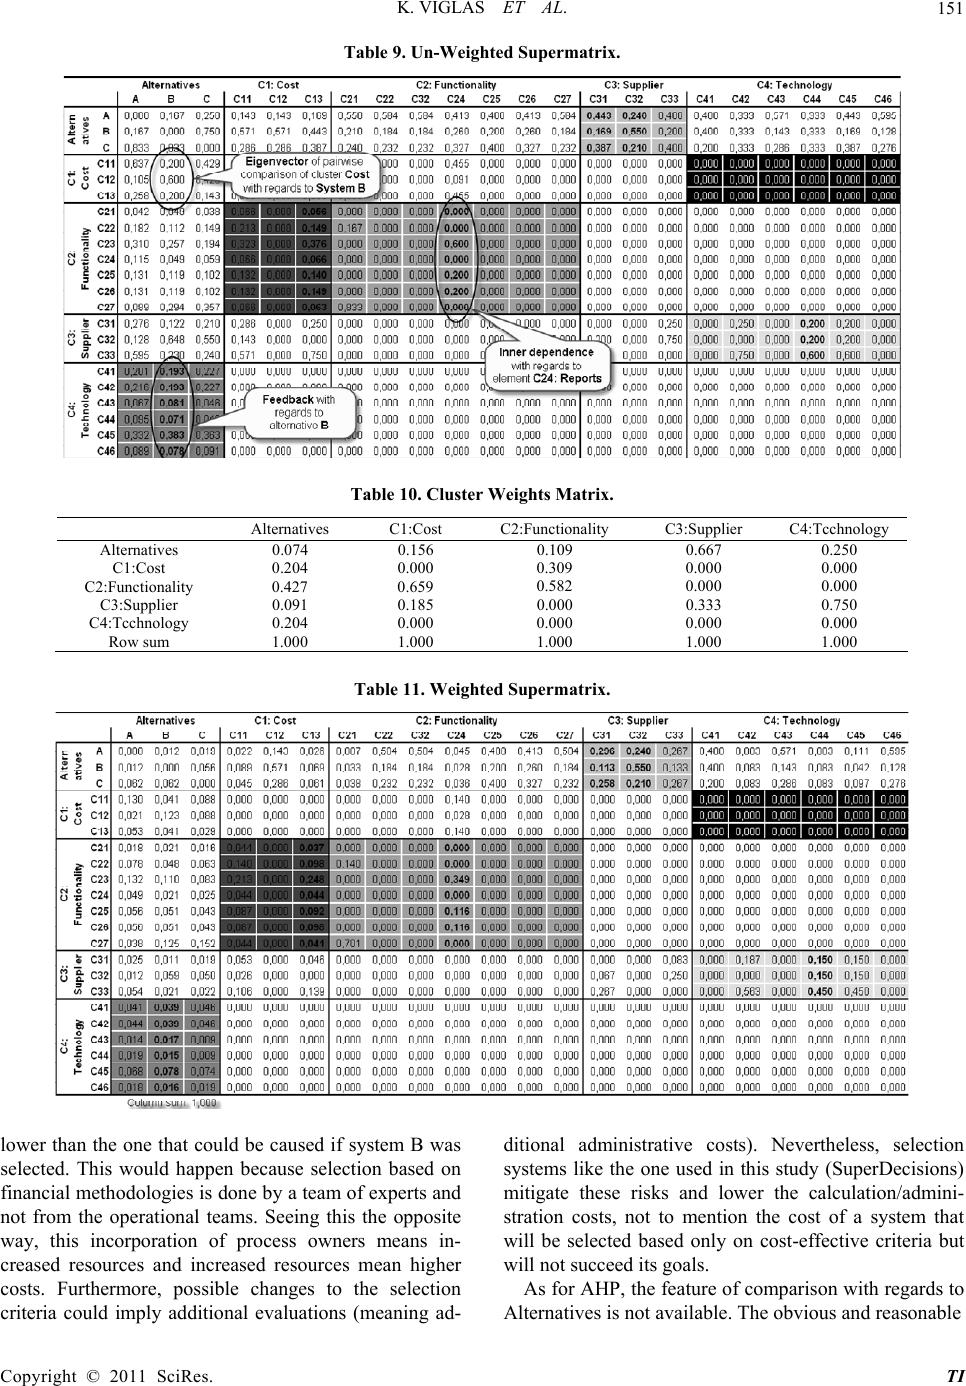 K. VIGLAS ET AL.151 hteTable 9. Un-Weigd Supermatrix. Table 10. Cluste Alternatives C1:Cost r Weights Matrix. C2:Functionality C3:Supplier C4:Tcchnology Alternatives 0.074 0.156 0.109 0.667 0.250 C1:Cost 0.204 0.000 C2:Functionality 0.427 0.659 C3:Supplier 0.091 0.185 C4:Tcchnology 0.204 0.000 Row sum 1.000 1.000 0.309 0.000 0.000 0.582 0.000 0.000 0.000 0.333 0.750 0.000 0.000 0.000 1.000 1.000 1.000 Table 11. Weighted Supermatrix. lower than the one that could be caused if system B was selected. This would happen because selection based on financial methodologies is done by a team of experts and ot from the operational teams. Seeing this the opposite way, this incorporation of process owne creased resources and increased resources mean r costs. Furthssible the n criteria coulditional evons (mead- ditional administrative costs). Nevertheless, selection systems like the one used in this study (SuperDecisions) mitigate these risks and lower the calculation/admini- stration costs, not to mention the cost of a syst that d based only on cost-effective criteria but d its , the ompgards to Altes is not ava The obvioreasonable nrs means in-will be selecte highe soermore, po ddch toangeselecti imply aaluatining a em will not succee A AHP goals. feaf cs for ture oarisoth ren wi ernativilable. us and Copyright © 2011 SciRes. TI  K. VIGLAS ET AL. 152 Tablimiting suprix. e 12. Lermat comparison e.g. of the elements of cluster Cost with re- gards to Alternatives is something that cannot happen in AHP and clearly shows the limitations of this methodol- gy. Still, its wide expansion in all kinds of problems A decision criterion that the organization co cal can be easily added while the selection problem is ongoing. In that way, due to its general directives, the use of the model can be validated for all kinds of organi- zations and IS. Enhancements can also be made in terms of monitor- ing the performance of the BSC model. As each strategic objective is monitored on a certain frequency, it would be interesting to integrate an iterative process in the model to measure the added value that came out of the implementation of the selected QMS (System A) and its “score” versus the relative strategic objectives (Figure 7). Tools like the one used in this study can easily integrate such processes through business intelligence techniques to give the chance to top management to have a real-time view on the strategy execution. ledgements 7. References [1] Z. Irani and P. Love, “Information Systems Evaluation: Past, Present and Future,” European Journal of Informa- tion Systems, Vol. 10, No. 4, 2001, pp. 183-188. 04.1293068 o through the years lik e project delivery method [27], ERP selection [28], etc. makes AHP a reference among MCDM methodologies. While we believe that the model presented provides value, there are areas for future enhancements and vali- dation. It is acknowledged that the decision levels in- volved in any selection problem can vary, depending on the organization. Indeed, this is one of the strengths of ANP: the ability to adap t its framework to custom needs. [2] Z. Irani and P. Love, “Evaluating Information Systems. Public and Private Sector,” 1st Edition, Butterworth- Heinemann, Hungary, 2008. [3] H. Erdogmus, J. Favaro and W. Strigel, “Return on In- vestment,” IEEE Software, Vol. 21, No. 3, 2004, pp. 18-22. nsiders criti- 6. Acknow The authors would like to thank Mr. Robert Elliott from AKS-Labs for his kind offer of a full-feature version of the Balanced Scorecard Designer tool. doi:10.1109/MS.20 . Westerfield and B. Jordan, “Fundamentals of Corporate Finance,” Times Mirror Professional Publish- ing, New York, 1996. [6] A. S. Jadhav and R. M. Sonar, “Evaluating and Selecting Software Packages: A Review,” Information and Soft- ware Technology, Vol. 51, No. 3, 2009, pp. 555-563. doi:10.1016/j.infsof.2008.09.003 [4] B. Boehm, “Software Engineering Economics,” Prentice Hall, Upper Saddle River, 1981. [5] S. Ross, R [7] O. S. Vaidya and S. Kumar, “Analytic Hierarchy Process: An Overview of Applications,” European Journal of Op- erational Research, Vol. 169, No. 1, 1996, pp. 1-29. doi:10.1016/j.ejor.2004.04.028 [8] T. L. Saaty, “The Analytic Hierarchy Process: Planning, Priority Setting, Resource Allocation,” McGraw-Hill, Pittsburgh, 1980. [9] T. L. Saaty, “Decision Making with Dependence and Feedback,” RWS Publications, Pittsburgh, 1996. [10] T. L. Saaty, “Theory and Applications of the Analytic Network Process: Decision Making with Benefits, Op- portunities, Costs, and Risks,” RWS Publications, Pitts- ess,” International Journal of Production Economics, Vol. burgh, 2005. [11] K. Hafeez, Y. Zhang and N. Malak, “Determining Key Capabilities of a Firm Using Analytic Hierarchy Proc- Copyright © 2011 SciRes. TI  K. VIGLAS ET AL.153 3(01)00141-4 76, No. 1, 2002, pp. 39-51. doi:10.1016/S0925-527 [1 2] R. A. Brealey and S. C. Myers, “Capital Investment and Valuation,” McGraw/Hill, New York, 2002. [13] M. Schniederjans, J. Hamaker and A. Schniederjans, “Information Technology Investment: Decision Making Technology,” World Scientific Publishing Company, Singapore, 2004. [14] L. T. Blank and A. J. Tarquin, “Engineering Economy,” 3rd Edition, McGraw-Hill, NewYork, 1989. [15] J. Karlsson and K. Ryan, “A Cost-Value Approach for Prioritizing Requirements,” IEEE Software, Vol. 14, No. 5, 1997, pp. 67-74.doi:10.1109/52.605933 [16] J. Kontio, “A Case Study in Applying a Systematic Method for COTS Selection,” Proceedings of the 18th International Conference on Software Engineering, IEEE Press, New York, 1996. doi:10.1109/ICSE.1996.493416 [17] A. Lozano-Tello and A. Gomez Perez, “BAREMO: How to Choose the Appropriate Software Component Using the Analytic Hierarchy Process,” Proceedings of the In- ternational Conference on Software Engineering and Knowledge Engineering (SEKE), Skokie, 21-23 June, 2002. [18] V. Gerogiannis, P. Fitsilis, G. Kakarotzas and A. Tzikas, “Involving Stakeholders in the Selection of a Project and Portfolio Management Tool,” 21st Greek Operation Re- 28-29 May 2009. 9] R. S. Kaplan and D. P. Norton, “The Balanced Scorecard: recard Concept: An port,” Long Range Planning, Vol. 34, No. search Conference, Athens, [1 Translating Strategy into Action,” Harvard Business Press, Massachusetts, 1996. [20] H. Ahn, “Applying the Balanced Sco Experience Re 4, 2001, pp. 441-461. doi:10.1016/S0024-6301(01)00057-7 [21] K. Viglas, “Evaluation/Selection Methodologies of Infor- Process apm.2006.10.002 mat i o n Syst e m s ,” Hell e n i c Ope n U n i v er sity, Patr a s, 2009. [22] C. Gencer and D. Gürpinar, “Analytic Network in Supplier Selection: A Case Study in an Electronic Firm,” Applied Mathematical Modelling, Vol. 31, No. 11, 2007, pp. 2475-2486. doi:10.1016/j. : An Inter- , pp. 630-649. orecard and a Manufacturing Firm,” Expert Systems [23] T. L. Saaty, “Fundamentals of the Analytic Network Process,” ISAHP, Kobe, 1999. [24] S. Percin, “Using the ANP Approach in Selecting and Benchmarking ERP Systems,” Benchmarking national Journal, Vol. 15, No. 5, 2008 [25] R. Ak and B. Oztaysi, “Performance Measurement of Insurance Companies by Using Balanced Sc ANP,” Istanbul Technical University, Istanbul, 2009. [26] I. Yuksel and M. Dagdeviren, “Using the Fuzzy Analytic Network Process (ANP) for Balanced Scorecard (BSC): A Case Study for with Applications, Vol. 37, No. 2, 2010, pp. 1270-1278. doi:10.1016/j.eswa.2009.06.002 [27] M. I. Al Khalil, “Selecting the Appropriate Project De- livery Method Using AHP,” International Journal of Project Management, Vol. 20, No. 6, 2002, pp. 469-474. doi:10.1016/S0263-7863(01)00032-1 [28] C. C. Wei, C. F. Chien and M. J. J. Wang, “An AHP-Based Approach to ERP System Selection,” Inter- national Journal of Production Economics, Vol. 96, No. 1, 2005, pp. 47-62. doi:10.1016/j.ijpe.2004.03.004 Copyright © 2011 SciRes. TI
|