American Journal of Analytical Chemistry, 2011, 2, 200-205
doi:10.4236/ajac.2011.22023 Published Online May 2011 (http://www.SciRP.org/journal/ajac)
Copyright © 2011 SciRes. AJAC
Rapid Determination of Residual Quinolones in Honey
Samples by Fast HPLC with an On-Line Sample
Pretreatment System
Wei Du2, Jian Guo Yao2, Yue Qi Li2, Yuki Hashi1
1Shimadzu Corporation, Kyoto, Japan
2Shimadz u I nt ernati onal Trad i ng (Shanghai) Co., L imited, Beijing, China
E-mail: y-hashi@shimadzu.co.jp
Received October 15, 2010; revised February 12, 2011; accepted February 14, 2011
Abstract
A method of on-line pretreatment coupled to HPL C wi th flu oresc en ce dete cti on was dev eloped and v ali dated
for the determination of nine quinolones in honey samples. This method simplified the complicated process
of sample pretreatment and reduced sample treatment time. Recovery of the quinolones was between 92% -
101% for spiked honey samples. The limit of detection was 0.22 - 3.78 ng/mL (signal/noise ratio = 3). There
was good linear correlation between HPLC peak area and concentration of the quinolones, with a linear
range of 1.0 - 100.0 ng/mL and correlation coefficients >0.9997. The method proposed was validated for de-
tecting quinolones in honey samples.
Keywords: Antibiotics, High Performance Liquid Chromatography (HPLC), Honey; On-Line Pretreat men t,
Quinolones
1. Introduction
Nowadays, food safety is one of the biggest social con-
cerns. Therefore, the monitoring of residual pesticides
and antibio tics in ag ricultural products and sea foods must
be carried out before these products are released to the
market. Recently, h igh throughpu t analysis has been con-
sidered important in the development of new analytical
methods. In particular, the sample pretreatment proce-
dure is a crucial step for high throughput determination
[1-11]. There are many kinds of sample preparation pro-
cedures in the analytical process [12]. Among several
sample preparation techniques, SPE is getting a high
priority to be used as a sample pretreatment because of
high recovery, less organic solvent usage, short time for
sample preparation, easy operation, and automation
[13,14]. Sample pretreatment must also be optimized
with the combination of various techniques, considering
the instrumentation to be used and the degree of accuracy
and precision required, whether quantitative or qualita-
tive [15].
Quinolones are a group of synthetic antibacterial
compounds for the treatment of several diseases. The use
of quinolones in animal production is getting more and
more, so, their residual presence in food processed from
animal product as a raw material can be found. The Eu-
ropean Union has defined the maximum residue limits
(MRLs) for several of these compounds in the different
food matrices of animal origin, but not for honey. There-
fore, we have developed an automated on-line sample
pretreatment system coupled with high performance liq-
uid chromatography instruments for the rapid determina-
tion of quinolones in honey samples, which enabled us
not only to minimize the sample preparation time, but
also to obtain acceptable analysis precision. According to
the guideline of Japan Ministry of Health, Labour and
Welfare (MHLW), it may take around 2-3 hours to pre-
pare honey samples. In contrast, the new system reduced
the sample preparation time to 10 minutes.
2. Experimental
2.1. Regents and Chemicals
LC-grade water was obtained by purification of
de-ionized water using a Milli-Q system (Waters, Bed-
ford, MA, USA). Acetonitrile (LC grade) was purchased
from Fisher (Fair Lawn, NJ, USA). All reagents (analyt-
W. DU ET AL.
Copyright © 2011 SciRes. AJAC
201
ical grade) and the standard quinolones were purchased
from Wako (Osaka, Japan ).
2.2. HPLC Systems
The system used in the present study consisted of three
LC-20AD pumps, a DGU-20A3 degassing unit, a SIL-
20AC auto-sampler, a CTO-20AC column oven includ-
ing FCV-12AH flow-channel selection valves and an
RF-10Axl fluorescence detector with semi-microflow
cell (Shimadzu Corporation, Kyoto, Japan). System con-
trol and data acquisition were performed using LC-Solu-
tion version 1.21 workstation software. A Shim-Pack
VP-GODS (4.6 m mI . D. × 10 mmL.; Shimadzu Corpora-
tion) guard column and a Shim-Pack XR-ODS (3 mmI.D.
× 75 mmL, 2.2 μm; Shimadzu Corporation) analytical
colum n we re u s e d.
2.3. Sample Preparation
Honey samples were diluted ten times to 0.1 mg/mL with
sodium dodecylsulfonate (SDS) aqueous solution and
then filtered by 0.45 μm of membrane filter. 100 µL of
each sample solution was injected into the system.
2.4. Chromatographic Conditions
The flow diagram of this system is shown in Figure 1.
95% of ace tonitrile and 5% of pure w ater at 0.1 mL/min
was used as the enrichment pump solvent, with 1.0
mmol/L SDS aqueous solution at 1.9 mL/min as the dilu-
tion solvent for 2 min as an enrichment time. Therefore,
the sample was diluted 20-fold.
To analyze the target quinolones, a solvent mixture of
acetonitrile (25%) and SDS solution (75%) which is 1.0
mmol/L sodium dodecylsulfonate contained 30 mmol/L
phosphate buffer (pH 2.5), at 1.0 mL/min was used as the
optimized mobile phase. The column tempe rature was set
at 40˚C. An excitation wavelength of 325 nm and emis-
sion wavelength of 365 nm were selected for oxolinic
acid, nalidixic acid and flumequine, and an excitation
wavelength of 295 nm and emission wavelength of 445
nm were selected for norfloxacin, ciprofloxacin, dano-
floxacin, enrofloxacin, orbifloxacin and difloxacin.
3. Results and Discussion
3.1. Minimization of the Carry-Over Problem
When dilution pump was not configured in this system,
several carry-over peaks appeared by injection of sample
solvent after actual honey sample analysis. The function
of washing for sample injector works but was not com-
plete. Increasing organic solvent for sample pump is one
of ways to remove carry-over peaks, but it results in poor
recovery of quinolones. Therefore, dilution pump was
added to this system in order to improve recovery with
no carry-over peaks. Comparison of chromatographs
with and without d ilution pump is shown in Figure 2.
3.2. Adoption of Fast HPLC Column
100 µL of nine types of quinolone samples was injected
in this on-line sample pretreatment system and the
Figure 1. Flow diagram of enrichment and clean-up system.
W. DU ET AL.
Copyright © 2011 SciRes. AJAC
202
chromatograms of standard quinolones ar e shown in Fig-
ure 3. Although 2.2 µm packing material wa s a dopt e d as a
fast HPLC co lumn with on-line pretreatmen t system, n ine
quinolones could be completely separated within 20 min.
In case of using conventional HPLC column (5 µm pack-
ing material) more t han 70 min is requi red for this analysis.
Figure 2. Comparison of chromatographs with / without dilution pump. (a) without using dilution pump; sample pump sol-
vent is SDS solution . (b) wit h using dilution pump; s ample pump solvent is 95% of acetonitrile and 5% of SDS solution, and
dilution pump solvent is SDS solution.
Figure 3. Chromatograms of quinolones. 1 oxolinic acid, 2 nalidixic acid, 3 flumequine, 4 norfloxacin, 5 ciprofloxacin, 6 da-
nofloxacin, 7 enrofloxacin, 8 orbifloxacin, 9 difloxacin.
W. DU ET AL.
Copyright © 2011 SciRes. AJAC
203
3.3. Analytical Performance
The linear relationship of the HPLC peak area with the
concentration of quinolones in the range 1.0 - 100.0
ng/mL is shown in Table 1.
The sample concentration and the peak area showed
an excellent linear relationship. Regression coefficients
were all greater than 0.9997. The limit of detection for
the method was determined as 3 times the signal/noise
ratio and yielded values of 0.22 - 3.78 ng/mL. Recove-
ries of the quinolones were between 92% - 101%. The
repeatability of the method was determined from five
repeated injections of all standard samples (Table 2).
The relative standard deviation for the peak areas was
less than 0.88% (n = 5).
3.4. Actual Quinolone Analysis in Honey Samples
Two brands of honey were diluted ten times with SDS
solution and filtered. 100 µL of the solutions were in-
jected into the system. The chromatogram and results are
shown in Table 3 and Figure 4. As a comparison, Japa-
nese honey association method was also used as a sample
pretreatment.
Norfloxacin in sample 2 was detected from two dif-
ferent sample pretreatments with similar concentration
values. This indicates on-line sample pretreatment sys-
tem works as good as conventional sample pretreatment
method.
4. Conclusions
A method of on-line pretreatment coupled to HPLC w ith
fluorescence detection was developed and validated for
the determination of nine quinolones in honey samples.
This method simplified the complicated process of sam-
ple pretreatment, and reduced sample treatment time.
The method was validated in terms of recovery,
Table 1. Linearity, LOD and recovery for the Quinolones (1.0 - 100.0 ng/mL).
Compound Regression equation Regression coefficient (r2) LOD (ng/ml) Recovery (%)
oxolonic acid y = 1.408e–4x 0.1116 0.9999 0.44 94.5
nalidixic acid y = 2.754e–4x 0.1689 0.9999 3.78 98.9
flumequine y = 7.833e–5x 0.3249 0.9999 0.22 101.0
norfloxacin y = 7.553e–5x + 0.4179 0.9999 2.10 92.2
ciprofloxacin y = 8.249e–5x + 0.4014 0.9999 1.59 95.8
danofloxacin y = 9.314e–6x + 0.1414 0.9999 0.41 95.5
enrofloxacin y = 3.724e–5x+0.3418 0.9999 1.73 93.1
orbifloxacin y = 2.712e–5x + 0.2200 0.9999 1.05 99.3
diflfloxacin y = 6.653e–5x + 0.9672 0.9999 1.91 96.7
Table 2. repeatability for the Quinolones (100 ng/mL, n = 5).
Compound RSD (%)
Retention time Peak area
oxolonic acid 0.128 0.254
nalidixic acid 0.125 0.316
flumequine 0.132 0.188
norfloxacin 0.083 0.665
ciprofloxacin 0.253 0.293
danofloxacin 0.143 0.539
enrofloxacin 0.094 0.877
orbifloxacin 0.129 0.465
diflfloxacin 0.194 0.229
W. DU ET AL.
Copyright © 2011 SciRes. AJAC
204
Table 3. Concentration of quinolones in the two brands of
honey.
Concentrati on (ng/g)
Sample 1 Sample 2
norfloxacin - 23.1/21.9*
*Guideline of Japan MHLW.
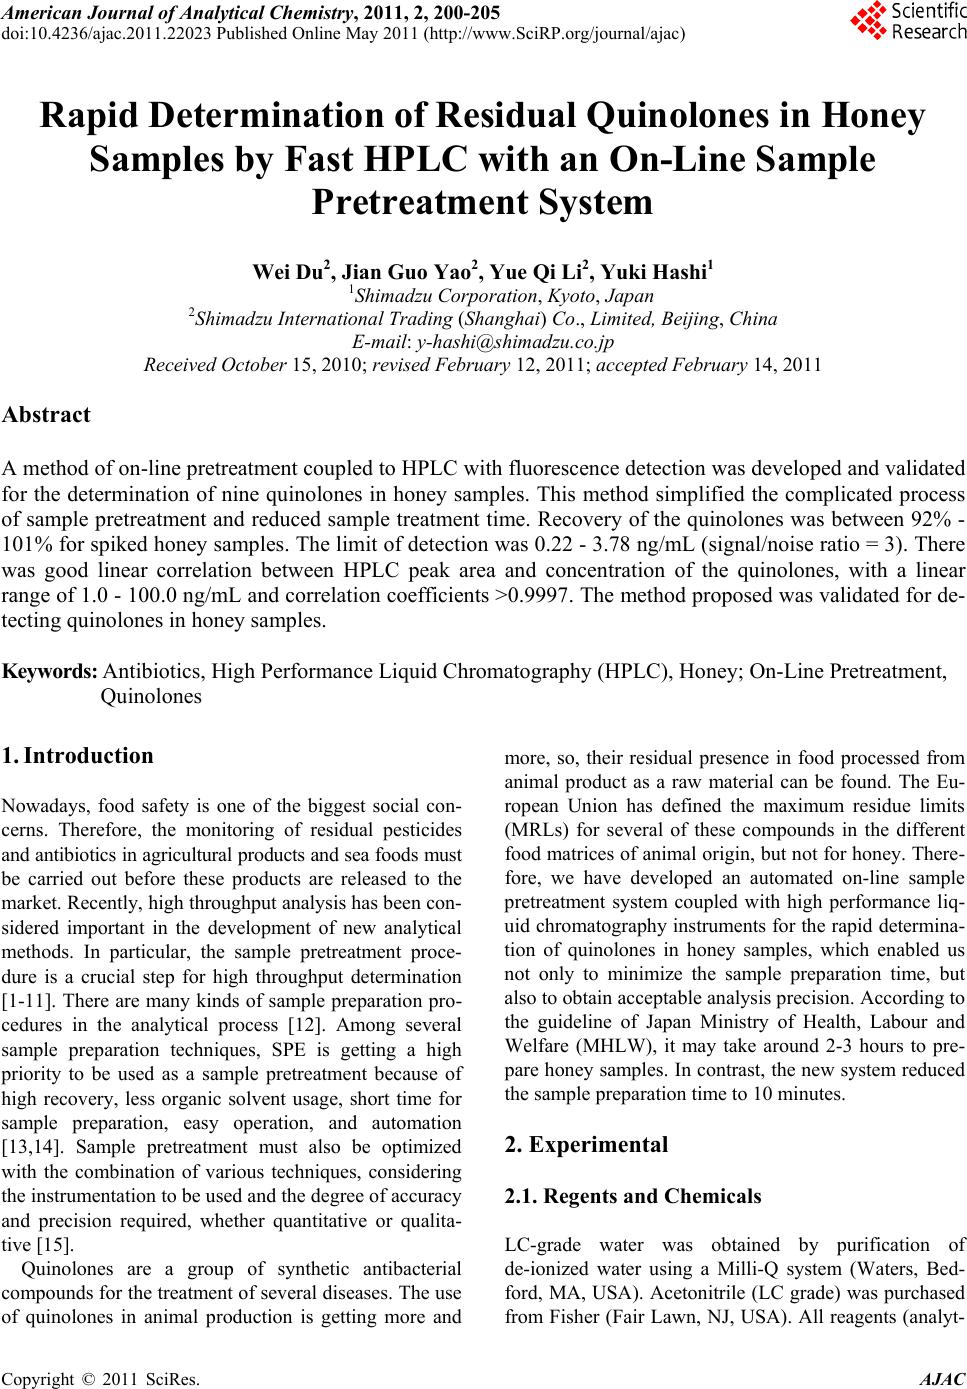
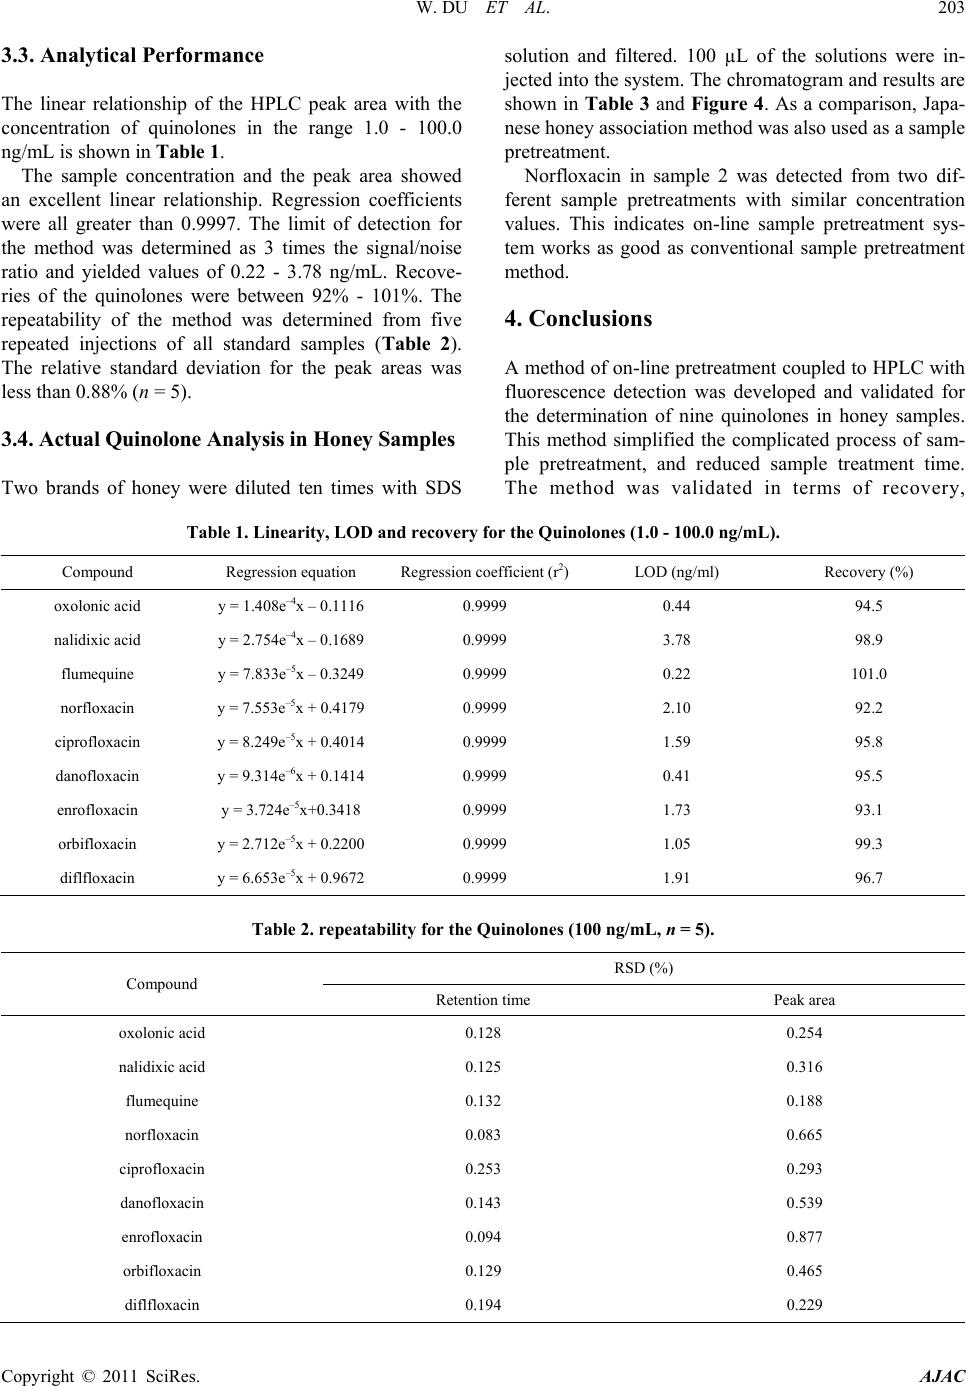
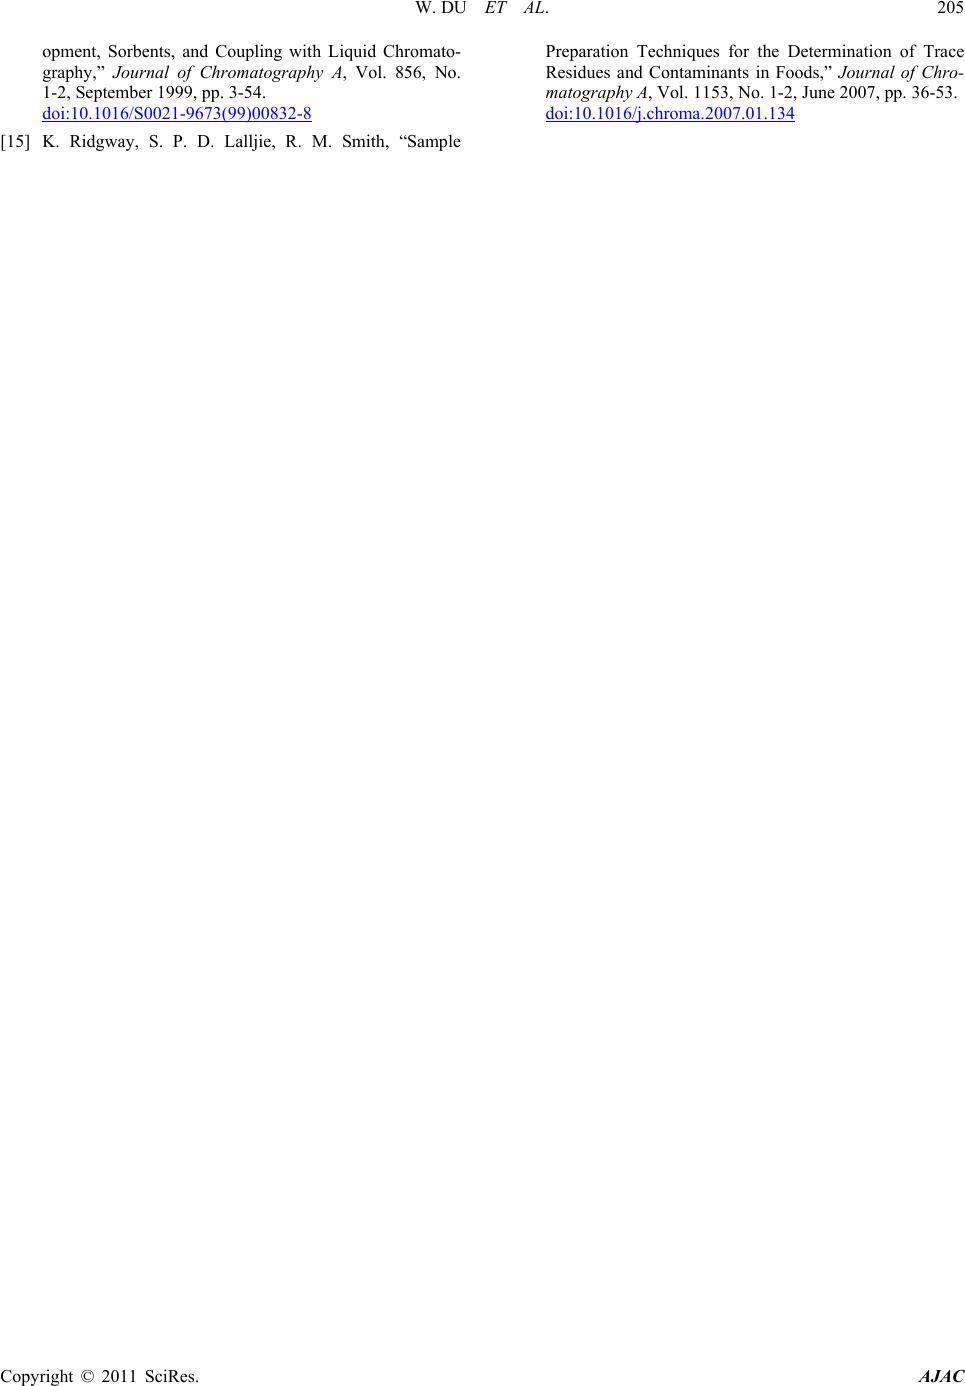
Figure 4. Chromatogram of two brands of honey obtained
by on-line sample pret reatment system.
repeatability and linearity and allowed rapid determina-
tion of quinolones in honey samples.
5. Acknowledgements
The authors wish to thank S. Itoh of Kato Brothers Ho-
ney Co., Ltd for the technical support in the experiment.
6. References
[1] C. F. Li, J. W. C. Wong, C. W. Huiea and M. M. F. Choia,
On-Line Flow Injection-Cloud Point Preconcentration of
Polycyclic Aromatic Hydrocarbons Coupled with High-
Performance Liquid Chromatography,” Journal of Chro-
matography A, Vol. 1214, No. 1-2, December 2008, pp.
11-16. doi:10.1016/j.chroma.2008.10.062
[2] P. Tsytsik, J. Czech and R. Carleer, “Thermal Extraction
coupled with Gas Chromatography-Mass Spectrometry as
a Tool for Analysing Dioxin Surrogates and Precursors in
Fly Ash,” Journal of Chromatogr. A, Vol. 1210, No. 2,
November 2008, pp. 212-221.
doi:10.1016/j.chroma.2008.09.071
[3] L. W. Lim, Y. K. Okouchi and T. Takeuchi, “On-Line
Preconcentration of Trace Carcinogenic Polycyclic Aro-
matic Hydrocarbons (PAHs) in Microcolumn Liquid
Chromatography via Large Volume Injection,” Talanta,
Vol. 72, No. 5, July 2007, pp. 1600-1608.
doi:10.1016/j.talanta.2007.02.033
[4] A. T. K. Tran, R. V. Hyne and P. D oble, “Determination of
Commonly Used Polar Herbicides in Agricultural Drai-
nage Waters in Australia by HPLC,” Chemosphere, Vol.
67, No. 5, March 2007, pp. 944-953.
doi:10.1016/j.chemosphere.2006.11.002
[5] Y. T. Li, J. E. G eorge, C. L . McCarty and S . C. Wendelk en,
“Development and Application of a Method for the
Analysis of N-Acylhomoserine Lactones by Solid-Phase
Extraction and Ultra High Pressure Liquid Chromatogra-
phy,” Journal of Chromatography A, Vol. 1134, No. 1-2,
November 2006, pp. 170-176.
doi:10.1016/j.chroma.2006.09.047
[6] R. M. Almeida and Y. Mauricio, “Gas Chromatograph-
ic-Mass Spectrometric Method for the Determination of
the Herbicides Paraquat and Diquat in Plasma and Urine
Samples,” Journal of Chromatography B, Vol. 853, No.
1-2, June 2007, pp. 260-264.
doi:10.1016/j.jchromb.2007.03.026
[7] M. R. Boleda, M. T. Galceran and F. T. Ventura, “Trace
Determination of Cannabinoids and Opiates in Wastewa-
ter and Surface Waters by Ultra-Performance Liquid
Chromatography-Tandem Mass Spectrometry,” Journal
of Chromatography A, Vol. 1175, No. 1, December 2007,
pp. 38-48. doi:10.1016/j.chroma.2007.10.029
[8] Y. Song, S. Zhao, P. Tchounwou and Y. L. Min, “A Na-
noparticle-Based Solid-Phase Extraction Method for Liq-
uid Chromatography-Electrospray Ionization-Tandem
Mass Spectrometric Analysis,” Journal of Chromatogra-
phy A, Vol. 1166, No. 1-2, September 2007, pp.79-84.
doi:10.1016/j.chroma.2007.07.074
[9] W. D. Wang, Y. M. Huang, W. Q. Shu and J. Cao, “Mul-
tiwalled Carbon Nanotubes as Adsorbents of Sol i d -Phase
Extraction for Determination of Polycy clic Aromatic Hy-
drocarbons in Environmental Waters Coupled with High-
Performance Liquid Chromatography,” Journal of
Chromatography A, Vol. 1173, No. 1-2, November 2007,
pp.27-36. doi:10.1016/j.chroma.2007.10.027
[10] J. B. Baugros, B. Giroud, G. Dessalces, M. F. G. Lousta-
lot and C. C. Olive, “Multiresidue Analytical Methods for
the Ultra-Trace Quantification of 33 Priority Substances
Present in the List of REACH in Real Water Samples,”
Analytica Chimica Acta, Vol. 607, No. 2, January 2008,
pp. 191-203. doi:10.1016/j.aca.2007.11.036
[11] J. J. B. Nevado, C. G. Cabanillas, M. J. V. Llerena and V.
R. Robledo, “Sensitive SPE GC-MS-SIM Screening of
Endocrine-Disrupting Herbicides and Related Degrada-
tion Products in Natural Surface Waters and Robustness
Study,” Microchemical Journal, Vol. 87, No. 1, October
2007, pp. 62-71 doi:10.1016/j.microc.2007.05.004
[12] D. M. Pavlovic, S. Babic, A. J. M. Horvat and M. K.
Macan, “Sample Preparation in Analysis of Pharmaceut-
icals,” TrAC Trends in Analytical Chemistry, Vol. 26, No.
11, December 2007, pp. 1062-1075.
doi:10.1016/j.trac.2007.09.010
[13] M. C. Hennion, C. C. D. Coumes and V. Pichon, “Trace
Analysis of Polar Organic Pollutants in Aqueous Sam-
ples: Tools for the Rapid Prediction and Optimisation of
the Solid-Phase Extraction Parameters,” Journal of
Chromatography A, Vol. 823, No. 1-2, October1998, pp.
147- 161. doi:10.1016/S0021-9673(98)00479-8
[14] M. C. Hennion, “Solid-Phase Extraction: Method Devel-
W. DU ET AL.
Copyright © 2011 SciRes. AJAC
205
opment, Sorbents, and Coupling with Liquid Chromato-
graphy,” Journal of Chromatography A, Vol. 856, No.
1-2, September 1999, pp. 3-54.
doi:10.1016/S0021-9673(99)00832-8
[15] K. Ridgway, S. P. D. Lalljie, R. M. Smith, “Sample
Preparation Techniques for the Determination of Trace
Residues and Contaminants in Foods,” Journal of Chro-
matography A, Vol. 1153, No. 1-2, June 2007, pp. 36-53.
doi:10.1016/j.chroma.2007.01.134