Paper Menu >>
Journal Menu >>
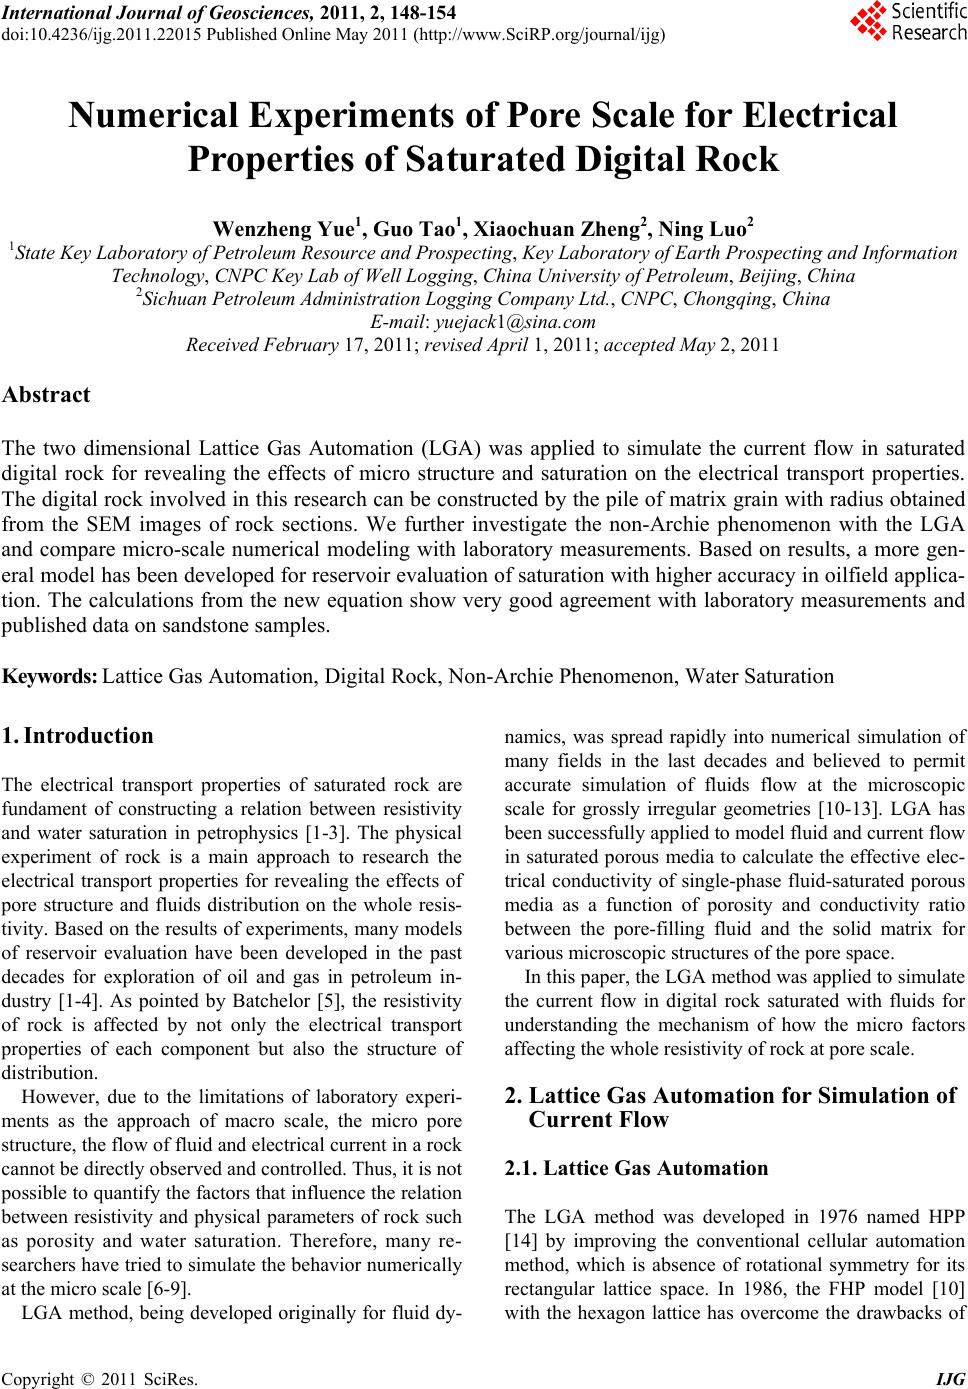 International Journal of Geosciences, 2011, 2, 148-154 doi:10.4236/ijg.2011.22015 Published Online May 2011 (http://www.SciRP.org/journal/ijg) Copyright © 2011 SciRes. IJG Numerical Experiments of Pore Scale for Electrical Properties of Saturated Digital Rock Wenzheng Yue1, Guo Tao1, Xiaochuan Zh en g2, Ning Luo2 1State Key Laboratory of Petroleum Resource and Prospecting, Key Laboratory of Earth Prospecting and Information Technology, CNPC Key Lab of Well Logging, China University of Petroleum, Beijing, China 2Sichuan Petroleum Administration Logging Company Ltd., CNPC, Chongqing, China E-mail: yuejack1@sina.com Received February 17, 2011; revised April 1, 2011; accepted May 2, 2011 Abstract The two dimensional Lattice Gas Automation (LGA) was applied to simulate the current flow in saturated digital rock for revealing the effects of micro structure and saturation on the electrical transport properties. The digital rock involved in this research can be constructed by the pile of matrix grain with radius obtained from the SEM images of rock sections. We further investigate the non-Archie phenomenon with the LGA and compare micro-scale numerical modeling with laboratory measurements. Based on results, a more gen- eral model has been developed for reservoir evaluation of saturation with higher accuracy in oilfield applica- tion. The calculations from the new equation show very good agreement with laboratory measurements and published data on sandstone samples. Keywords: Lattice Gas Automation, Digital Rock, Non-Archie Phenomenon, Water Saturation 1. Introduction The electrical transport properties of saturated rock are fundament of constructing a relation between resistivity and water saturation in petrophysics [1-3]. The physical experiment of rock is a main approach to research the electrical transport properties for revealing the effects of pore structure and fluids distribution on the whole resis- tivity. Based on the results of experiments, many models of reservoir evaluation have been developed in the past decades for exploration of oil and gas in petroleum in- dustry [1-4]. As pointed by Batchelor [5], the resistivity of rock is affected by not only the electrical transport properties of each component but also the structure of distribution. However, due to the limitations of laboratory experi- ments as the approach of macro scale, the micro pore structure, the flow of fluid and electrical current in a rock cannot be directly observed and controlled. Thus, it is not possible to quantify the factors that influence the relation between resistivity and physical parameters of rock such as porosity and water saturation. Therefore, many re- searchers have tried to simulate the behavior numerically at the micro scale [6-9]. LGA method, being developed originally for fluid dy- namics, was spread rapidly into numerical simulation of many fields in the last decades and believed to permit accurate simulation of fluids flow at the microscopic scale for grossly irregular geometries [10-13]. LGA has been successfully applied to model fluid and current flow in saturated porous media to calculate the effective elec- trical conductivity of single-phase fluid-saturated porous media as a function of porosity and conductivity ratio between the pore-filling fluid and the solid matrix for various microscopic structures of the pore space. In this paper, the LGA method was applied to simulate the current flow in digital rock saturated with fluids for understanding the mechanism of how the micro factors affecting the whole resistivity of rock at pore scale. 2. Lattice Gas Automation for Simulation of Current Flow 2.1. Lattice Gas Automation The LGA method was developed in 1976 named HPP [14] by improving the conventional cellular automation method, which is absence of rotational symmetry for its rectangular lattice space. In 1986, the FHP model [10] with the hexagon lattice has overcome the drawbacks of 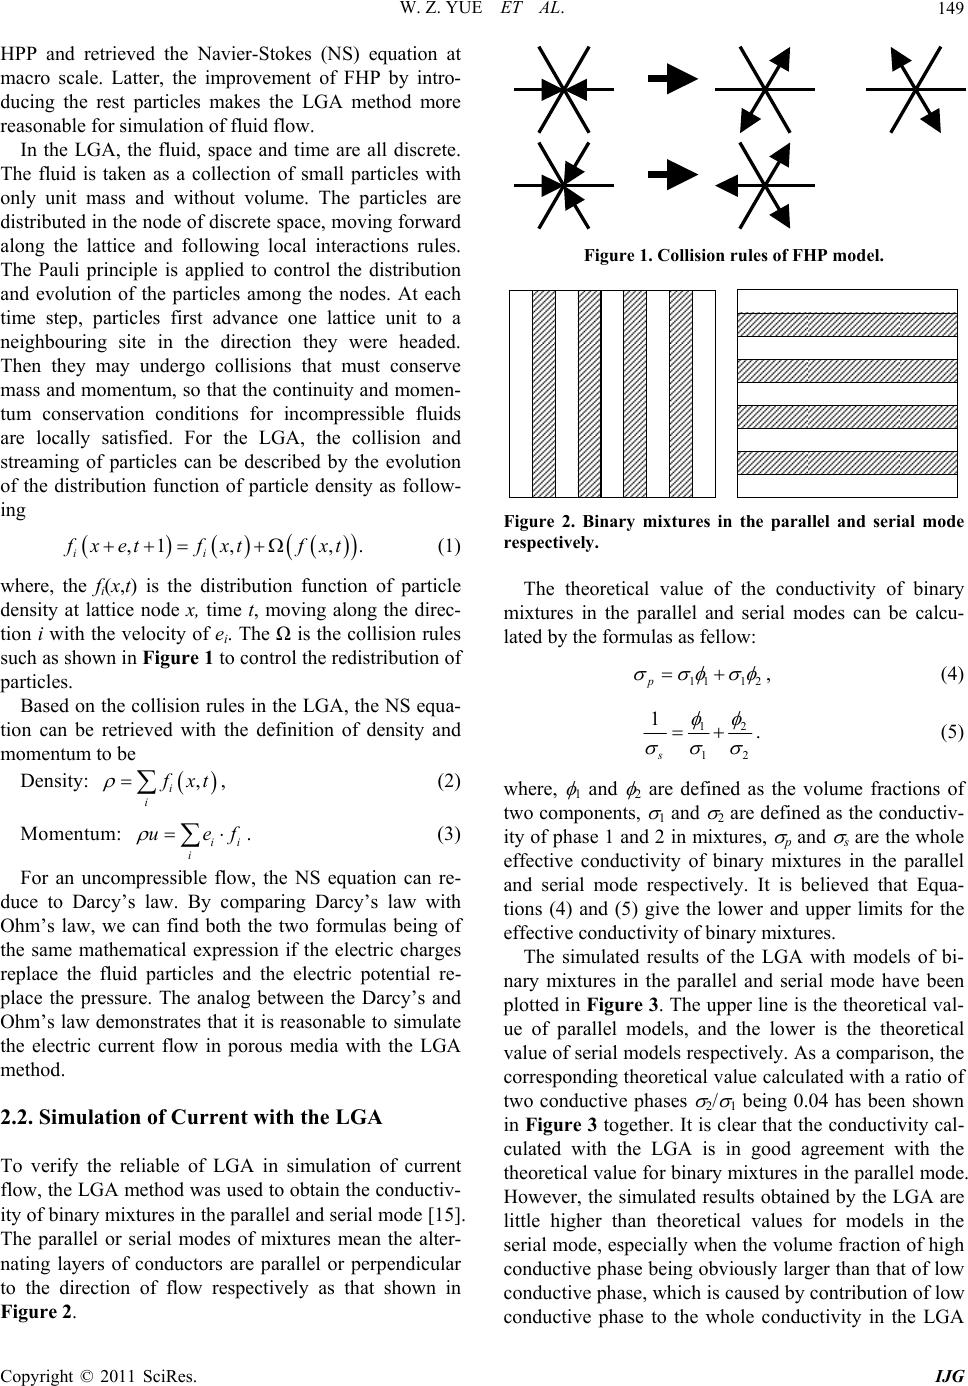 W. Z. YUE ET AL. Copyright © 2011 SciRes. IJG 149 HPP and retrieved the Navier-Stokes (NS) equation at macro scale. Latter, the improvement of FHP by intro- ducing the rest particles makes the LGA method more reasonable for simulation of fluid flow. In the LGA, the fluid, space and time are all discrete. The fluid is taken as a collection of small particles with only unit mass and without volume. The particles are distributed in the node of discrete space, moving forward along the lattice and following local interactions rules. The Pauli principle is applied to control the distribution and evolution of the particles among the nodes. At each time step, particles first advance one lattice unit to a neighbouring site in the direction they were headed. Then they may undergo collisions that must conserve mass and momentum, so that the continuity and momen- tum conservation conditions for incompressible fluids are locally satisfied. For the LGA, the collision and streaming of particles can be described by the evolution of the distribution function of particle density as follow- ing ,1 ,,. ii f xetfxt fxt (1) where, the fi(x,t) is the distribution function of particle density at lattice node x, time t, moving along the direc- tion i with the velocity of ei. The Ω is the collision rules such as shown in Figure 1 to control the redistribution of particles. Based on the collision rules in the LGA, the NS equa- tion can be retrieved with the definition of density and momentum to be Density: , i i f xt , (2) Momentum: ii i uef . (3) For an uncompressible flow, the NS equation can re- duce to Darcy’s law. By comparing Darcy’s law with Ohm’s law, we can find both the two formulas being of the same mathematical expression if the electric charges replace the fluid particles and the electric potential re- place the pressure. The analog between the Darcy’s and Ohm’s law demonstrates that it is reasonable to simulate the electric current flow in porous media with the LGA method. 2.2. Simulation of Current with the LGA To verify the reliable of LGA in simulation of current flow, the LGA method was used to obtain the conductiv- ity of binary mixtures in the parallel and serial mode [15]. The parallel or serial modes of mixtures mean the alter- nating layers of conductors are parallel or perpendicular to the direction of flow respectively as that shown in Figure 2. Figure 1. Collision rules of FHP model. Figure 2. Binary mixtures in the parallel and serial mode respectively. The theoretical value of the conductivity of binary mixtures in the parallel and serial modes can be calcu- lated by the formulas as fellow: 11 12p , (4) 12 12 1 s . (5) where, 1 and 2 are defined as the volume fractions of two components, 1 and 2 are defined as the conductiv- ity of phase 1 and 2 in mixtures, p and s are the whole effective conductivity of binary mixtures in the parallel and serial mode respectively. It is believed that Equa- tions (4) and (5) give the lower and upper limits for the effective conductivity of binary mixtures. The simulated results of the LGA with models of bi- nary mixtures in the parallel and serial mode have been plotted in Figure 3. The upper line is the theoretical val- ue of parallel models, and the lower is the theoretical value of serial models respectively. As a comparison, the corresponding theoretical value calculated with a ratio of two conductive phases 2/ 1 being 0.04 has been shown in Figure 3 together. It is clear that the conductivity cal- culated with the LGA is in good agreement with the theoretical value for binary mixtures in the parallel mode. However, the simulated results obtained by the LGA are little higher than theoretical values for models in the serial mode, especially when the volume fraction of high conductive phase being obviously larger than that of low conductive phase, which is caused by contribution of low conductive phase to the whole conductivity in the LGA 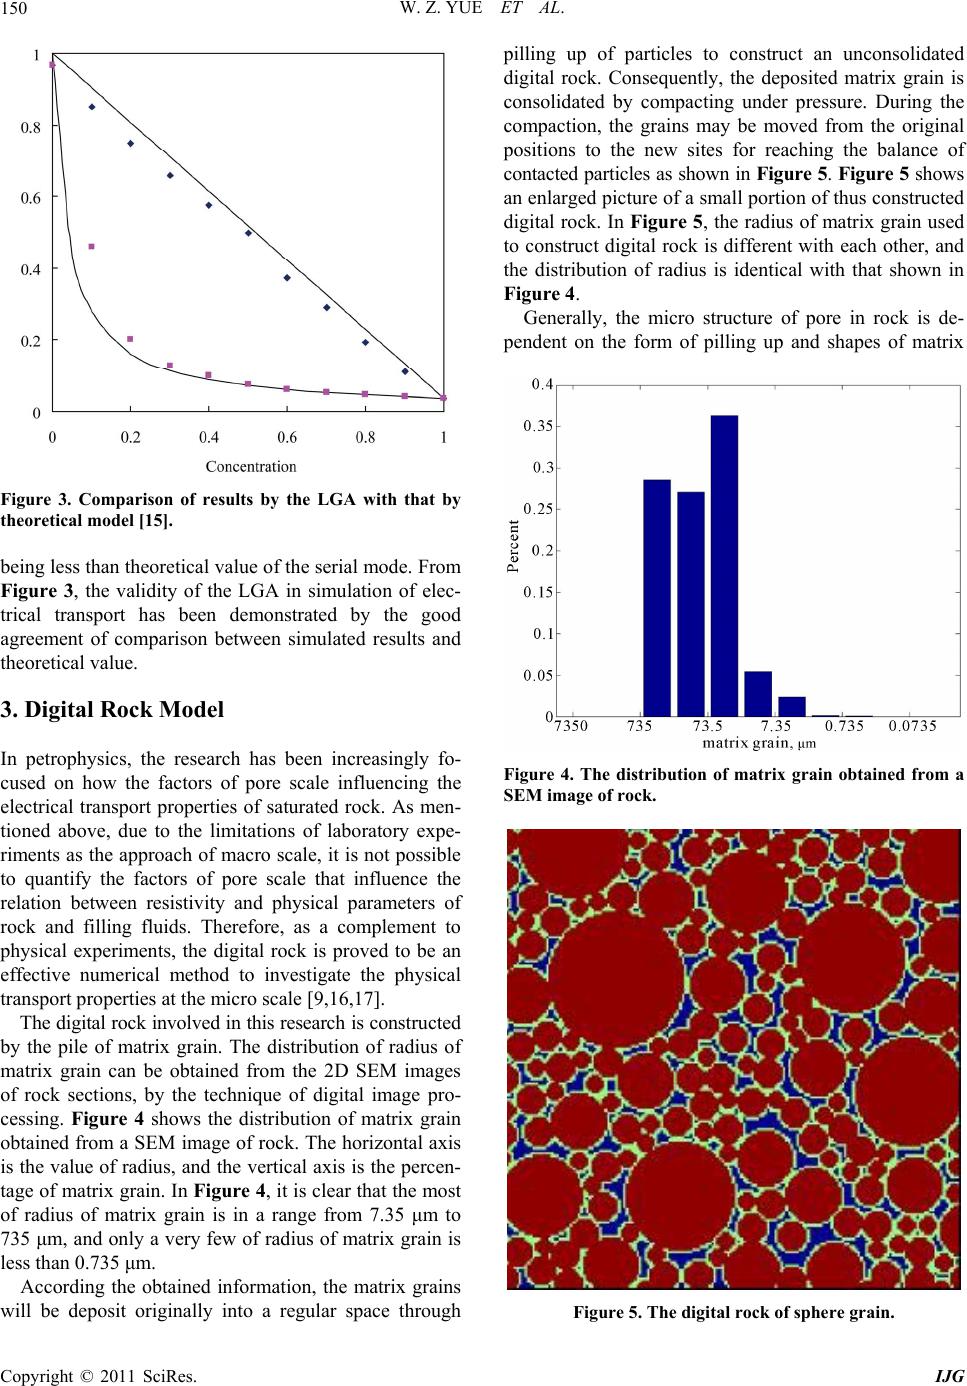 W. Z. YUE ET AL. Copyright © 2011 SciRes. IJG 150 Figure 3. Comparison of results by the LGA with that by theoretical model [15]. being less than theoretical value of the serial mode. From Figure 3, the validity of the LGA in simulation of elec- trical transport has been demonstrated by the good agreement of comparison between simulated results and theoretical value. 3. Digital Rock Model In petrophysics, the research has been increasingly fo- cused on how the factors of pore scale influencing the electrical transport properties of saturated rock. As men- tioned above, due to the limitations of laboratory expe- riments as the approach of macro scale, it is not possible to quantify the factors of pore scale that influence the relation between resistivity and physical parameters of rock and filling fluids. Therefore, as a complement to physical experiments, the digital rock is proved to be an effective numerical method to investigate the physical transport properties at the micro scale [9,16,17]. The digital rock involved in this research is constructed by the pile of matrix grain. The distribution of radius of matrix grain can be obtained from the 2D SEM images of rock sections, by the technique of digital image pro- cessing. Figure 4 shows the distribution of matrix grain obtained from a SEM image of rock. The horizontal axis is the value of radius, and the vertical axis is the percen- tage of matrix grain. In Figure 4, it is clear that the most of radius of matrix grain is in a range from 7.35 μm to 735 μm, and only a very few of radius of matrix grain is less than 0.735 μm. According the obtained information, the matrix grains will be deposit originally into a regular space through pilling up of particles to construct an unconsolidated digital rock. Consequently, the deposited matrix grain is consolidated by compacting under pressure. During the compaction, the grains may be moved from the original positions to the new sites for reaching the balance of contacted particles as shown in Figure 5. Figure 5 shows an enlarged picture of a small portion of thus constructed digital rock. In Figure 5, the radius of matrix grain used to construct digital rock is different with each other, and the distribution of radius is identical with that shown in Figure 4. Generally, the micro structure of pore in rock is de- pendent on the form of pilling up and shapes of matrix Figure 4. The distribution of matrix grain obtained from a SEM image of rock. Figure 5. The digital rock of sphere grain. 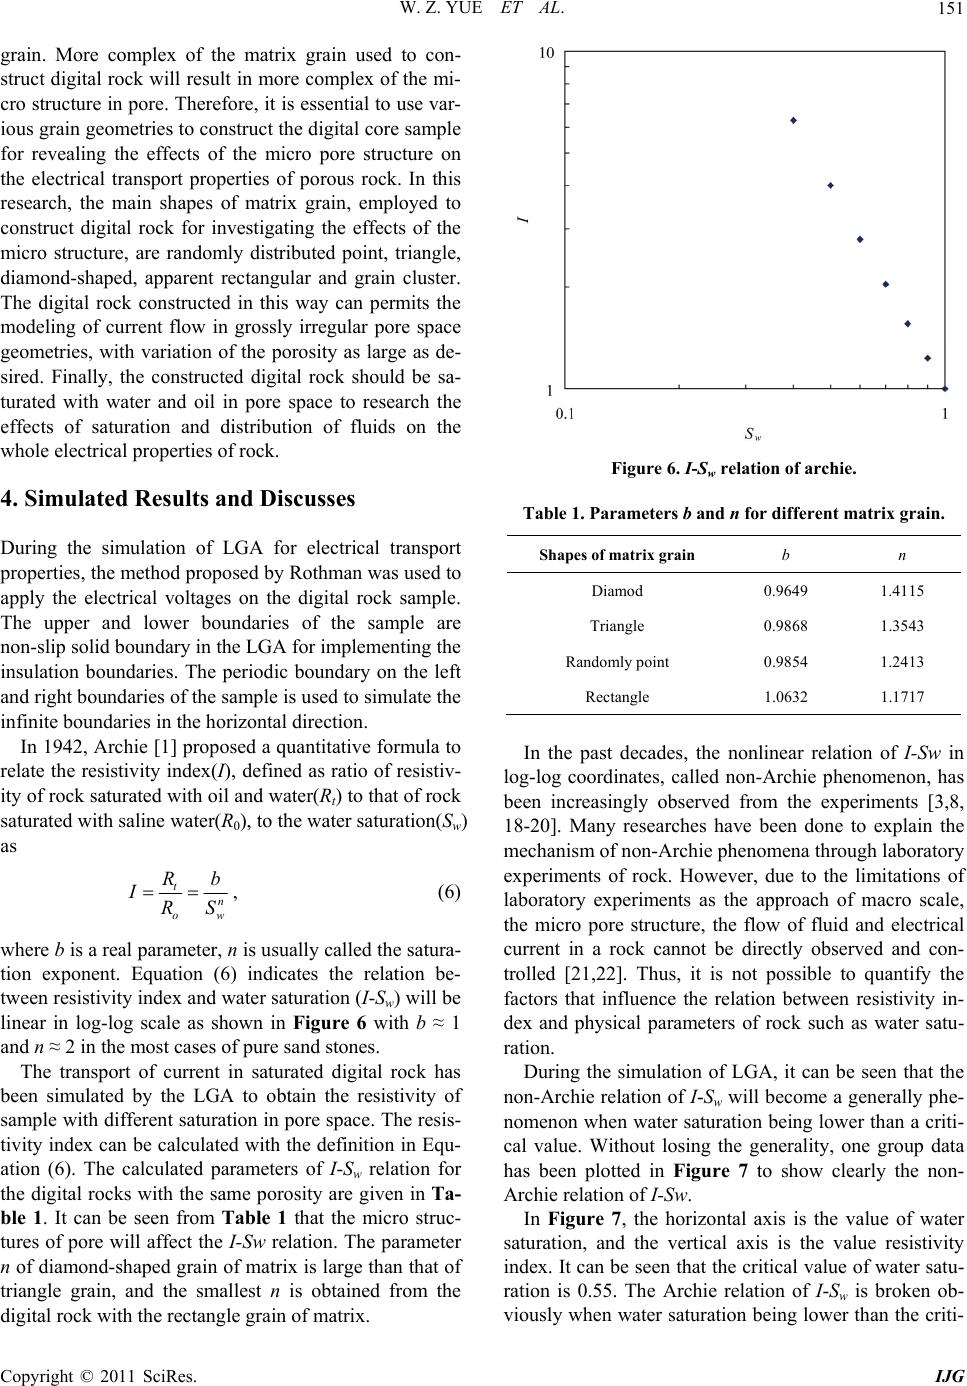 W. Z. YUE ET AL. Copyright © 2011 SciRes. IJG 151 grain. More complex of the matrix grain used to con- struct digital rock will result in more complex of the mi- cro structure in pore. Therefore, it is essential to use var- ious grain geometries to construct the digital core sample for revealing the effects of the micro pore structure on the electrical transport properties of porous rock. In this research, the main shapes of matrix grain, employed to construct digital rock for investigating the effects of the micro structure, are randomly distributed point, triangle, diamond-shaped, apparent rectangular and grain cluster. The digital rock constructed in this way can permits the modeling of current flow in grossly irregular pore space geometries, with variation of the porosity as large as de- sired. Finally, the constructed digital rock should be sa- turated with water and oil in pore space to research the effects of saturation and distribution of fluids on the whole electrical properties of rock. 4. Simulated Results and Discusses During the simulation of LGA for electrical transport properties, the method proposed by Rothman was used to apply the electrical voltages on the digital rock sample. The upper and lower boundaries of the sample are non-slip solid boundary in the LGA for implementing the insulation boundaries. The periodic boundary on the left and right boundaries of the sample is used to simulate the infinite boundaries in the horizontal direction. In 1942, Archie [1] proposed a quantitative formula to relate the resistivity index(I), defined as ratio of resistiv- ity of rock saturated with oil and water(Rt) to that of rock saturated with saline water(R0), to the water saturation(Sw) as tn ow Rb IRS , (6) where b is a real parameter, n is usually called the satura- tion exponent. Equation (6) indicates the relation be- tween resistivity index and water saturation (I-Sw) will be linear in log-log scale as shown in Figure 6 with b ≈ 1 and n ≈ 2 in the most cases of pure sand stones. The transport of current in saturated digital rock has been simulated by the LGA to obtain the resistivity of sample with different saturation in pore space. The resis- tivity index can be calculated with the definition in Equ- ation (6). The calculated parameters of I-Sw relation for the digital rocks with the same porosity are given in Ta- ble 1. It can be seen from Table 1 that the micro struc- tures of pore will affect the I-Sw relation. The parameter n of diamond-shaped grain of matrix is large than that of triangle grain, and the smallest n is obtained from the digital rock with the rectangle grain of matrix. Figure 6. I-Sw relation of archie. Table 1. Parameters b and n for different matrix grain. Shapes of matrix grain b n Diamod 0.9649 1.4115 Triangle 0.9868 1.3543 Randomly point 0.9854 1.2413 Rectangle 1.0632 1.1717 In the past decades, the nonlinear relation of I-Sw in log-log coordinates, called non-Archie phenomenon, has been increasingly observed from the experiments [3,8, 18-20]. Many researches have been done to explain the mechanism of non-Archie phenomena through laboratory experiments of rock. However, due to the limitations of laboratory experiments as the approach of macro scale, the micro pore structure, the flow of fluid and electrical current in a rock cannot be directly observed and con- trolled [21,22]. Thus, it is not possible to quantify the factors that influence the relation between resistivity in- dex and physical parameters of rock such as water satu- ration. During the simulation of LGA, it can be seen that the non-Archie relation of I-Sw will become a generally phe- nomenon when water saturation being lower than a criti- cal value. Without losing the generality, one group data has been plotted in Figure 7 to show clearly the non- Archie relation of I-Sw. In Figure 7, the horizontal axis is the value of water saturation, and the vertical axis is the value resistivity index. It can be seen that the critical value of water satu- ration is 0.55. The Archie relation of I-Sw is broken ob- viously when water saturation being lower than the criti-  W. Z. YUE ET AL. Copyright © 2011 SciRes. IJG 152 Figure 7. The simulated relation of I-Sw. cal value. The non-Archie behavior of I-Sw relation will become prominent when Sw being lower than 0.55. Clearly, the I-Sw relationship in a log-log scale drops off towards the saturation axis as Sw decreases. This means that the parameter n would decrease with the increasing of Sw. This non-Archie behavior can be explained as due to the effects of matrix- pore fluids network conducting. 5. A New Formula for the N o n-Archie I-Sw Both the simulated results of LGA and the measurements of laboratory experiments by many others, indicate that the relation of I I-Sw is not a linear in log-log scale as described by Archie’s equation. Generally, the I-Sw rela- tionships in a log-log scale drops off towards the satura- tion axis as Sw decreases, which means that the Archie exponent n is not a constant but a function of Sw itself. A reasonable interpretation for this phenomenon is that the saturation exponent n is the measure of the changing rate of the current path complexity with respect to saturation and porosity. Hence, a new non-Archie relation of I-Sw based on our simulations and observations has been de- veloped to relate I to Sw as U w YS w IS (7) where Y and U are the parameters related to the pore structure and porosity. To verify the validity of the Equation (7) in practical application, the formula is applied to process the data published by Diederix which were obtained by well- controlled experiments on the artificial rock consisting of smoothed glass beads. The data of Diederix have been plotted in Figure 8. Apparently, the non-Archie I- Sw relation can be observed obviously in Figure 8 from these data. The critical value of Sw for the non-Archie phenomenon of I-Sw relation is 0.45. The results calcu- lated with Equation (7) have been shown in Figure 8 for comparison. Clearly, it can be seen that the calculated results of Equation (7) fits the laboratory measurements very well. The good agreement between the calculated re- sults and the published data further confirm the validity of Equation (7) in application of processing measured data. In Figure 8, the diamond-shaped data points are from Diederix on the artificial samples consisting of smoothed glass beads. The data obtained from the experiments on real rock have been used to further verify the applicability of Equ- ation (7). The measured results and the calculated results with Equation (7) and Archie’s Equation are shown in Figure 9 for comparison. In Figure 9, the solid circles Figure 8. The I-Sw relation of artificial rock. Figure 9. The I-Sw relation of rock sample.  W. Z. YUE ET AL. Copyright © 2011 SciRes. IJG 153 are the data obtained from experiments. And the straight line is the result by fitting the data with the Archie’s eq- uation. The smooth curve in red is the results by fitting the data with the new formula. Clearly, the non-Archie phenomenon of the I-Sw rela- tion can be observed obviously in Figure 9 from these data. The critical value of Sw for the non-Archie pheno- menon of the I-Sw relation is 0.5. By comparison, the calculated result using Equation (7) is better agreement with the laboratory measurement than that using Archie’s equation. It can be understood that considerable errors could be introduced by processing such data of non- Archie behavior with Archie’s equation in reservoir evaluation. The new formula may result in a more accu- rate evaluation of fluid saturation, especially in the cases of obvious non-Archie phenomenon observed. 6. Conclusions The digital rock involved in this research can be con- structed by the pile of matrix grain with radius obtained from the 2D SEM images of rock sections. The LGA method was used to simulate the flow of current in satu- rated digital rock for revealing the effects of micro structure and water saturation on the electrical transport properties. Based on the simulated results, it is clearly that the saturation exponent n is not constant as described by Archie but is a function of pore structure and fluid saturation. The reasonable interpretation for this pheno- menon is that the saturation exponent n is the measure of the changing rate of the current path complexity with respect to saturation and porosity. Moreover, it is un- derstood that the mechanism of non-Archie phenomenon of I-S w relation is due to the inherent nature of the com- plex current paths of the mixture of matrix and filling fluids in pore space. Therefore, a new equation for re- servoir evaluation of saturation has been developed based on the results. The new equation can be applied to calcu- late the water saturation in reservoir with higher accura- cy, especially in the cases of obvious non-Archie phe- nomenon observed. The calculated results using Equa- tion (7) have been compared with laboratory measure- ments on real rock core from an oilfield and with data from published papers and have shown very good agree- ment. 7. Acknowledgements The authors wish to thank the National Natural Science Foundation of China for sponsoring this work under Pro- ject No.41074103, and the National Key Fundamental R&D Plan under Project No. 2007CB209601. 8. References [1] G. E. Archie, “The Electrical Resistivity Log as an Aid in Determining some Reservoir Characteristics,” Transac- tion of American Institute of Mining, Metallurgical, and Petroleum Engineers, Vol. 146, 1942, pp. 54-62. [2] X. D. Jing, A. Gillesple and B. M. Trewin, “Resistivity Index from Non-Equilibrium Measurements Using De- tailed In-situ Saturation Monitoring,” SPE Offshore Eu- ropean Conference, Aberdeen, 7-10 September 1993, pp. 456-464. [3] P. F. Worthington, “Quality Assurance of the Evaluation of Hydrocarbon Saturation from Resistivity Data,” SPE Annual Technical Conference and Exhibition, San Anto- nio, 24-27 September 2006. pp. 1-16. doi:10.2118/103075-MS [4] N. Li, “Generalised Resistivity-Porosity and Resistivity- -Oil Saturation Relationships,” Chinese Journal of Geo- physics, in Chinese, Vol. 32, No. 5, 1989, pp. 580-591. [5] G. K. Batchelor, “Transport Properties of Two-Phase Materials with Random Structure,” Annual Review of Fluid Mechanics, Vol. 6, 1974, pp. 227-255. doi:10.1146/annurev.fl.06.010174.001303 [6] D. P. Yale, “Network Modeling of Flow Storage and Deformation in Porous Rocks,” Ph.D. Thesis, Stanford University, Palo Alto, 1984. [7] G. Tao, “Elastic and Transport Properties of some Sand- stones,” Ph.D. Thesis, University of London, London, 1992. [8] H. N. Man and X. D. Jing, “Network Modeling of Strong and Intermediate Wettability on Electrical Resistivity and Capillary Pressure,” Advances in Water Resource, Vol. 24, No. 3-4, 2001, pp. 345-363. doi:10.1016/S0309-1708(00)00061-0 [9] P. E. Oren and S. Bakke, “Process Based Reconstruction of Sandstones and Prediction of Transport Properties,” Transport in Porous Media, Vol. 46, No. 2-3, 2002 pp. 311-343. doi:10.1023/A:1015031122338 [10] U. Frisch, B. Hasslacher and Y. Pomeau, “Lattice Gas Automation for the Navier-Stokes Equation,” Physical Review Letters, Vol. 56, No. 14, 1986, pp. 1505-1507. doi:10.1103/PhysRevLett.56.1505 [11] D. Rothman, “Cellular Automation Fluids: A Model for Flow in Porous Media,” Geophysics, Vol. 53, No. 4, 1988, pp. 509-518. doi:10.1190/1.1442482 [12] J. X. Hu and Y. M. Li, “Modeling Research for Simulat- ing Seismic Wave Propagation in Solid by Cellular Au- tomata,” Chinese Journal of Geophysics, in Chinese, Vol. 40, No. 1, 1997, pp. 120-125. [13] Z. L. Wang and Y. M. Li, “Parallel Algorithm for Simu- lating Seismic Wave Propagation by Cellular Automata,” Chinese Journal of Geophysics, in Chinese, Vol. 42, No. 3, 1999, pp. 410-415. [14] J. Hardy, “Time Evolution of a Two-Dimentional Model System,” Journal of Mathematical Physics, Vol. 14, No. 12, 1973, pp. 1746-1759. doi:10.1063/1.1666248  W. Z. YUE ET AL. Copyright © 2011 SciRes. IJG 154 [15] M. Küntz, J. C. Mareschal, et al., “Numerical Estimation of Effective Conductivity of Heterogeneous Media with a 2D Cellular Automaton Fluid,” Geophysical Research Letters, Vol. 24, No. 22, 1997, pp. 2865-2868. doi:10.1029/97GL52856 [16] O. Hiroshi and M. J. Blunt, “Pore Space Reconstruction Using Multiple-Point Statistics,” Journal of Petroleum Science and Engineering, Vol. 46, No. 1-2, 2005, pp. 121-137. doi:10.1016/j.petrol.2004.08.002 [17] M. Pilotti, “Reconstruction of Clastic Porous Media,” Transport in Porous Media, Vol. 41, No. 3, 2000, pp. 359-364. doi:10.1023/A:1006696301805 [18] K. M. Diederix, et al., “Anomalous Relationships be- tween Resistivity Index and Water Saturations in the Rot- liegend Sandstone,” SPWLA 23rd Annual Logging Sym- posium, Corpus Christi, 6-9 July 1982, pp. 1-16. [19] X. D. Li, J. Yu and M. Li, “Theoretic Research of Reser- voir Rock with Non-Archie Characteristics,” Oil-Gas F i e ld Surface Engineering, in Chinese, Vol. 27, No. 1, 2008, pp. 32-33. [20] A. U. Al-Kaabi, K. Mimoune and H. Y. Al-Yousef, “Ef- fect of Hysteresis on the Archie Saturation Exponent,” SPE Middle East Oil Conference and Exhibition, Mana- ma, 15-18 March 1997, pp. 497-503 [21] D. C. Herrick and W. D. Kennedy, “Electrical Efficien- cy—A Pore Geometric Theory for Interpreting the Elec- trical Properties of Reservoir Rocks,” Geophysics, Vol. 59, No. 6, 1994, pp. 918-927. doi:10.1190/1.1443651 [22] M. E. Kutay, et al., “Computational and Experimental Evaluation of Hydraulic Conductivity Anisotropy in Hot- -Mix Asphalt,” International Journal of Pavement Engi- neering, Vol. 8, No. 1, 2007, pp. 29-43. doi:10.1080/10298430600819147 |