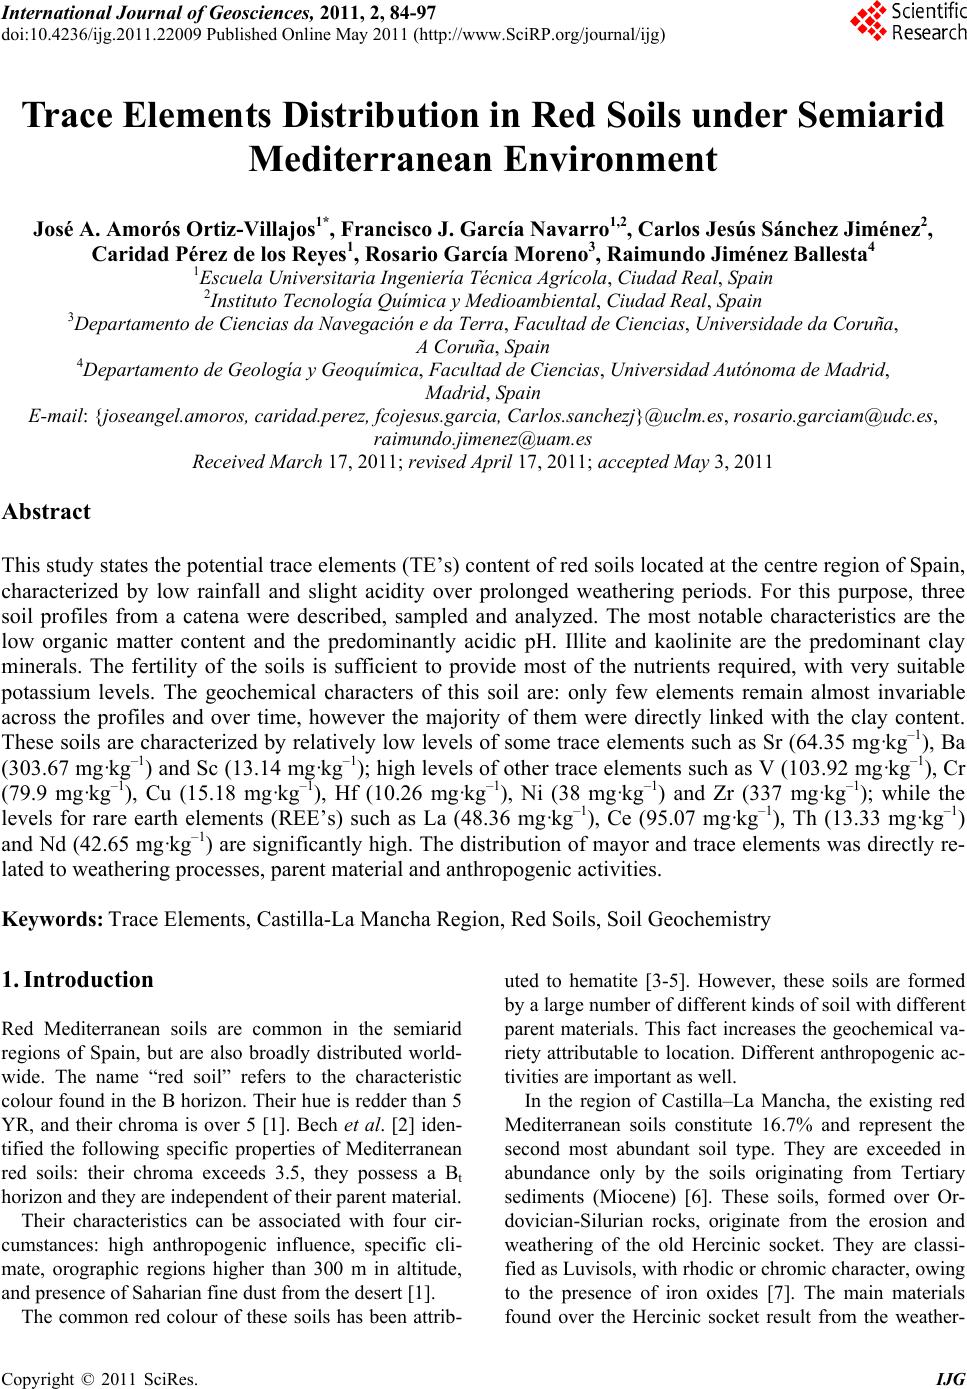
 International Journal of Geosciences, 2011, 2, 84-97 doi:10.4236/ijg.2011.22009 Published Online May 2011 (http://www.SciRP.org/journal/ijg) Copyright © 2011 SciRes. IJG Trace Elements Distribution in Red Soils under Semiarid Mediterranean Environment José A. Amorós Ortiz-Villajos1*, Francisco J. García Navarro1,2, Carlos Jesús Sánchez Jiménez2, Caridad Pérez de los Reyes1, Rosario García Moreno3, Raimundo Jiménez Ballesta4 1Escuela Universitaria Ingeniería Técnica Agrícola, Ciudad Real, Spain 2Instituto Tecnología Química y Medioambiental, Ciudad Real, Spain 3Departamento de Ciencias da Navegación e da Terra, Facultad de Ciencias, Universidade da Coruña, A Coruña, Spain 4Departamento de Geología y Geoqu ímica, Facultad de Ciencias, Un i v er sidad Autónoma d e Madrid, Madrid, Spain E-mail: {joseangel.amoros, caridad.perez, fcojesus.garcia, Carlos.sanchezj}@uclm.es, rosario.garciam@udc.es, raimundo.jimenez@uam.es Received March 17 , 20 1 1; revised April 17, 2011; accepted May 3, 2011 Abstract This study states the potential trace elements (TE’s) conten t of red soils located at the centre region of Spain, characterized by low rainfall and slight acidity over prolonged weathering periods. For this purpose, three soil profiles from a catena were described, sampled and analyzed. The most notable characteristics are the low organic matter content and the predominantly acidic pH. Illite and kaolinite are the predominant clay minerals. The fertility of the soils is sufficient to provide most of the nutrients required, with very suitable potassium levels. The geochemical characters of this soil are: only few elements remain almost invariable across the profiles and over time, however the majority of them were directly linked with the clay content. These soils are characterized by relatively low levels of some trace elements such as Sr (64.35 mg·kg–1), Ba (303.67 mg·kg–1) and Sc (13.14 mg·kg–1); high levels of other trace elements such as V (103.92 mg·kg–1), Cr (79.9 mg·kg–1), Cu (15.18 mg·kg–1), Hf (10.26 mg·kg–1), Ni (38 mg·kg–1) and Zr (337 mg·kg–1); while the levels for rare earth elements (REE’s) such as La (48.36 mg·kg–1), Ce (95.07 mg·kg–1), Th (13.33 mg·kg–1) and Nd (42.65 mg·kg–1) are significantly high. The distribution of mayor and trace elements was directly re- lated to weathering processes, parent material and anthropogenic activities. Keywords: Trace Elements, Castilla-La Mancha Region, Red Soils, Soil Geochemistry 1. Introduction Red Mediterranean soils are common in the semiarid regions of Spain, but are also broadly distributed world- wide. The name “red soil” refers to the characteristic colour found in the B horizon. Their hue is redder than 5 YR, and their chroma is over 5 [1]. Bech et al. [2] iden- tified the following specific properties of Mediterranean red soils: their chroma exceeds 3.5, they possess a Bt horizon and they are independent of their parent material. Their characteristics can be associated with four cir- cumstances: high anthropogenic influence, specific cli- mate, orographic regions higher than 300 m in altitude, and presence of Saharian fine dust from the desert [1]. The common red colour of these soils has been attrib- uted to hematite [3-5]. However, these soils are formed by a large number of different kinds of soil with different parent materials. This fact increases the geochemical va- riety attributable to location. Different anthropogenic ac- tivities are important as well. In the region of Castilla–La Mancha, the existing red Mediterranean soils constitute 16.7% and represent the second most abundant soil type. They are exceeded in abundance only by the soils originating from Tertiary sediments (Miocene) [6]. These soils, formed over Or- dovician-Silurian rocks, originate from the erosion and weathering of the old Hercinic socket. They are classi- fied as Luvisols, with rhodic or chromic character, owing to the presence of iron oxides [7]. The main materials found over the Hercinic socket result from the weather-  J. A. AMORÓS ET AL.85 ing and erosion of quartzite and materials from the schist- greywacke complex [8]. The main economic use of these soils in the region is the production of premium-quality wines. These soils represent 27.2% of the total regional area dedicated to the cultivation of the wine grape [6,9]. Several studies have been carried out on red soils from Mediterranean regions and areas of influence because of their different origins, parent material and characteristics [10-15]. Indeed, recently published studies have ad dr essed the area under consideration [16,17]. However the soils from the region of Ciudad Real have been poorly studied, particularly in relation to their con tent of trace and major elements. This specific area of the region is very impor- tant because it includes a large percentage of the total producti on of wine grape [18] . Trace elements are defined as those elements that are present in a rock at concentrations below 0.1% or 1000 mg·kg–1 [19]. The distribution and content of these chemical elements in soils depend on several factors: nature of the parent material, weathering processes and human activity [20]. Trace elements occur naturally in soils. Some of these elements are essential nutrients for plant growth as well as for human and animal health. However, at elevated levels some trace elements become potentially toxic, therefore acting as soil sinks for these compounds [21]. To give an idea of naturally occurring concentrations, Table 1 shows the mean content of trace elements for the Castilla-La Mancha region [22] and in the world [23]. Marques et al. [24] noted that trace elements that ac- cumulate during weathering are either pentavalent (Nb5+), tetravalent (Ti4+, Zr4+ and Th4+) or trivalent (Sc3+, V3+, Cr3+, Ga3+, Y3+, La3+, Ce3+) in soils that have acidic pH and are well-aerated. However, elements that are mono- valent (Rb+) or divalent (Mn2+, Co2+, Ni2+, Cu2+, Zn2+, Sr2+, Ba2+ and Pb2+) are depleted at acidic pH. Tetravalent cations crystallise into minerals that are very resistant to weathering and thus persist and accu- mulate (such as zircon, ZrSiO4). Zr is probably the most immobile of all trace elements [25], even less so than Ti. Nb can replace Zr and Ti in clay structure [24,26]. Ti and Zr (Al and Si as major elements) are classed as residual elements after long weathering periods [27]. However, several other experiments provide evidence for the mo- bility of Zr [28]. In this context, threshold levels are not yet defined by law in Castilla-La Mancha. Because of the high level of industrial and agricultural activities, anthropogenic input of trace elements into the natural environment in the re- gion represents a potential hazard [17]. The aforemen- tioned trace elements can be absorbed by plants [23,29] and fungi [30] in different amounts and can accumulate Table 1. Mean concentrations for trace elements in Cas- tilla-La Mancha region [22] and in the world [23]. Concentrations (mg·kg–1) Trace element Castilla - La Mancha World As 7.4 Ba 390 527 Ce 57.7 55 Co 5.8 10 Cr 54.8 67 Cs 7.7 Cu 10.3 24 Ga 11.1 17 Hf 4.9 La 23.6 31 Mo 0.9 Nb 8 16 Nd 21.6 Ni 16.9 24 Pb 19.3 29 Rb 86.2 73 Sc 23.6 9 Sn 4 Sr 380 190 Ta 2.2 Th 9.6 8 U 3.8 4 V 49.9 100 W 3.2 Y 17.9 18 Zn 35.7 67 Zr 167 307 in different structures (roots, leaves, fruits). They can then pass into the human food chain from these plants and fungi. The goals of this study are to evaluate potential prob- lems in wine production associated with these soils and Copyright © 2011 SciRes. IJG 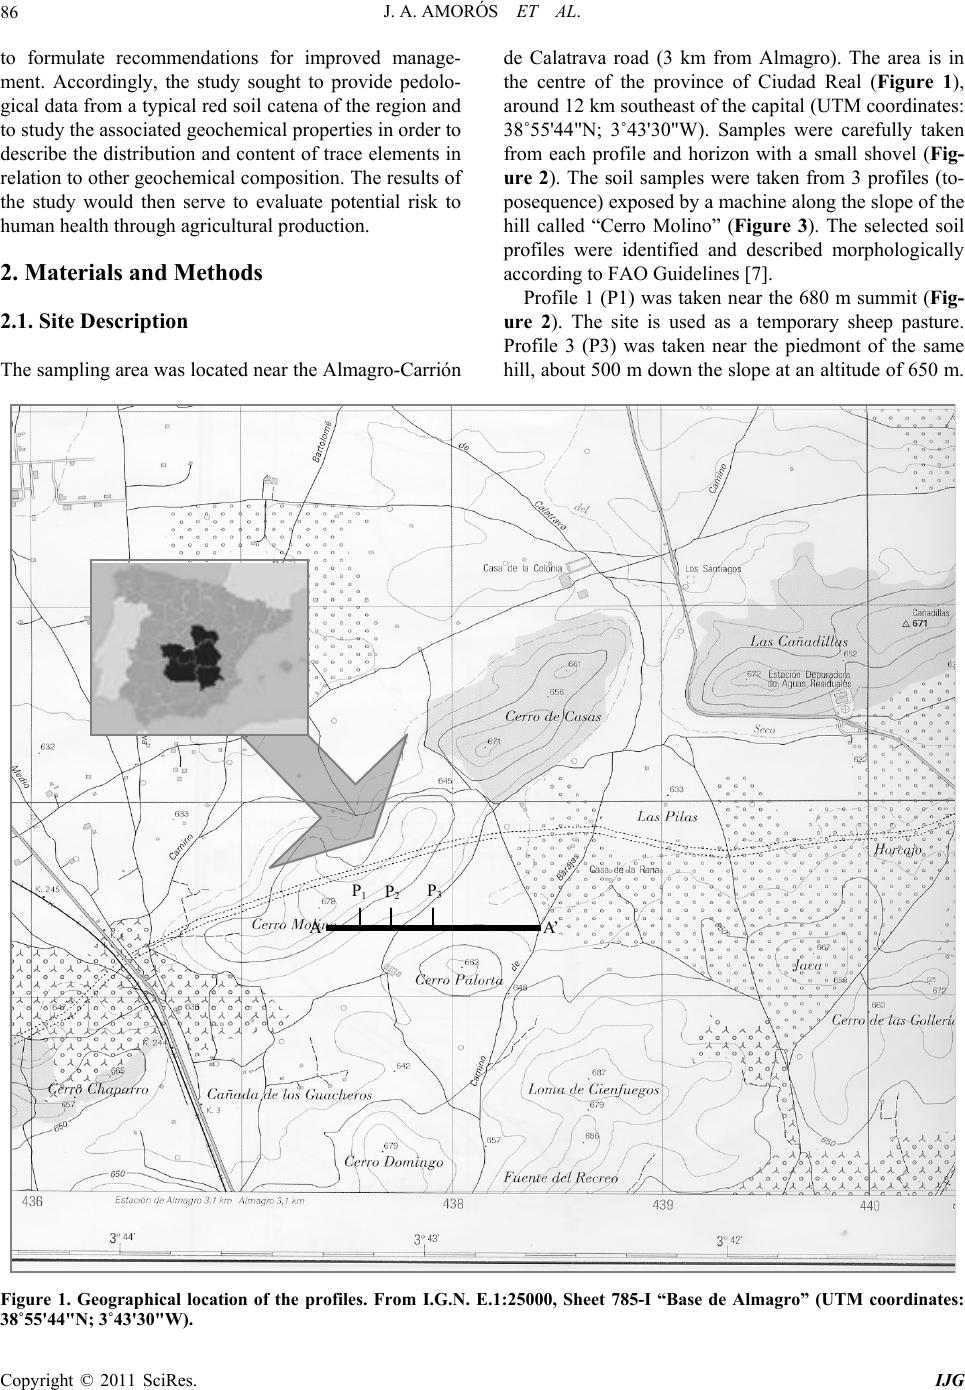 J. A. AMORÓS ET AL. Copyright © 2011 SciRes. IJG 86 to formulate recommendations for improved manage- ment. Accordingly, the study sought to provide pedolo- gical data from a typical red soil catena of the region and to study the associated geochemical properties in order to describe the distribution and content of trace elements in relation to other geochemical composition. The results of the study would then serve to evaluate potential risk to human health through agricultural production. 2. Materials and Methods 2.1. Site Description The sampling area was located near the Almagro-Carrión de Calatrava road (3 km from Almagro). The area is in the centre of the province of Ciudad Real (Figure 1), around 12 km southeast of the capital (UTM coordinates: 38˚55'44"N; 3˚43'30"W). Samples were carefully taken from each profile and horizon with a small shovel (Fig- ure 2). The soil samples were taken from 3 profiles (to- posequence) exposed by a machine along the slope of the hill called “Cerro Molino” (Figure 3). The selected soil profiles were identified and described morphologically according to FAO Guidelines [7]. Profile 1 (P1) was taken near the 680 m summit (Fig- ure 2). The site is used as a temporary sheep pasture. Profile 3 (P3) was taken near the piedmont of the same hill, about 500 m down the slop e at an altitude of 650 m. A A’ P 1 P 2 P 3 Figure 1. Geographical location of the profiles. From I.G.N. E.1:25000, Sheet 785-I “Base de Almagro” (UTM coordinates: 38˚55'44"N; 3˚43'30"W). 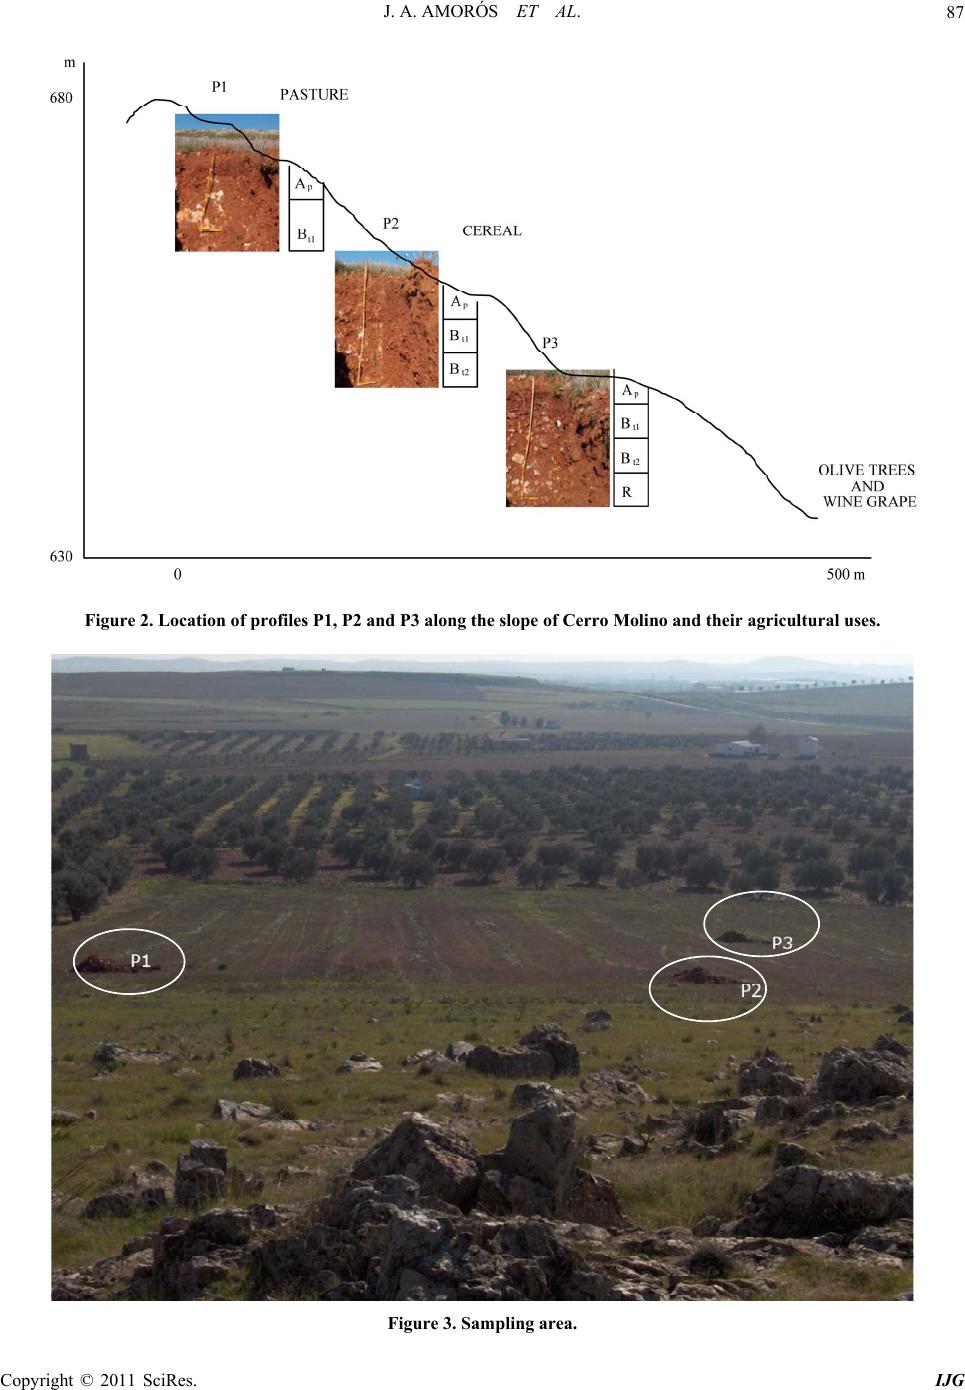 J. A. AMORÓS ET AL.87 Figure 2. Location of profiles P1, P2 and P3 along the slope of Cerro Molino and their agricultural uses. Figure 3. Sampling area. Copyright © 2011 SciRes. IJG  J. A. AMORÓS ET AL. Copyright © 2011 SciRes. IJG 88 The site is used for the culture of woody crops (olive tree and wine grape). Profile 2 (P2) was taken at an interme- diate point between P1 and P3. This location is tradition - ally used for dry farming (cereal-fallow). Selected climatic information is given in Figure 4, based on data supplied by the Meteorological Station of Ciudad Real. This station is located near the sampling area. The mean temperature and rainfall throughout the year were sampled from 1970 to 2009. A Mediterranean climate modified by altitude is evident and is typical of the central high plateau of Spain. This area has low mean rainfall (410 mm/year), especially in summer when a xeric period occurs from mid-June to the end of Sep- tember. The evapotranspiration is negative (average 400 mm/year). The mean temperature is 14.4˚C and ex- hibits a wide range between winter and summer. 2.2. Analytical Procedures All the analytical determinations were carried out ac- cording to SCS-USDA [31]. All samples were extracted and analysed in triplicate. Specifically, soil texture was determined using the h y- drometer method [32]. Soil pH was measured in H2O and in 0.1 M KCl using a 1:2.5 soil/solution ratio. Electrical conductivity was measured in a 1:5 soil:water extract. The method of Olsen et al. [33] was used to estimate available P. The soil organic matter was quantified by the Walkley and Black wet oxidation method [34]. Ex- changeable cations were determined using an ammonium acetate extraction method [35]. Exchangeable Na, K, Ca and Mg were determined by atomic absorption spec- trometry. Total nitrogen content was determined by the Kjeldahl method [36]. Semi-quantitative mineralogical analyses were carried out by X-ray diffraction (XRD) techniques. About 2 g of sample was hand-milled to below 53 m in an agate mortar and used for the bulk mineralogy determination (random powder method). For the detailed study of phyllosilicates, 100 g of sample was treated to remove components that prevent complete dispersion (e.g. car- bonates, sulphates, organic matter). The clay fraction (< 2 m) particles were extracted by sedimentation tech- niques and analysed on “thick” glass slides by XRD ac- cording to Moore and Reynolds [37]. Samples were chemically treated [(a) ethylene glycol to detect expand- able minerals and (b) dimethyl sulphoxide to differenti- ate chlorite and kaolinite] and thermally treated (550˚C for 2 h, to study the behaviour of phyllosilicates). The samples were analysed using a CuK radiation source (Philips-Panalytical X-PERT diffractometer) with a graphite monochromator, 40 kV and 40 mA, and a sensi- tivity of 2.103 cps. The ranges measured were 2 - 75˚ or 2 - 50˚ 2 , goniometer speed of 0.04 or 0.05 and time con- stant of 0.4 or 1 second for random powder or glass slides, respectively. Figure 4. Mean temperatures (Tm ,˚C, in bars) and monthly rainfall (mm in line) throughout the year (meteorological station f Ciudad Real, Spain, 1970 - 2009). o 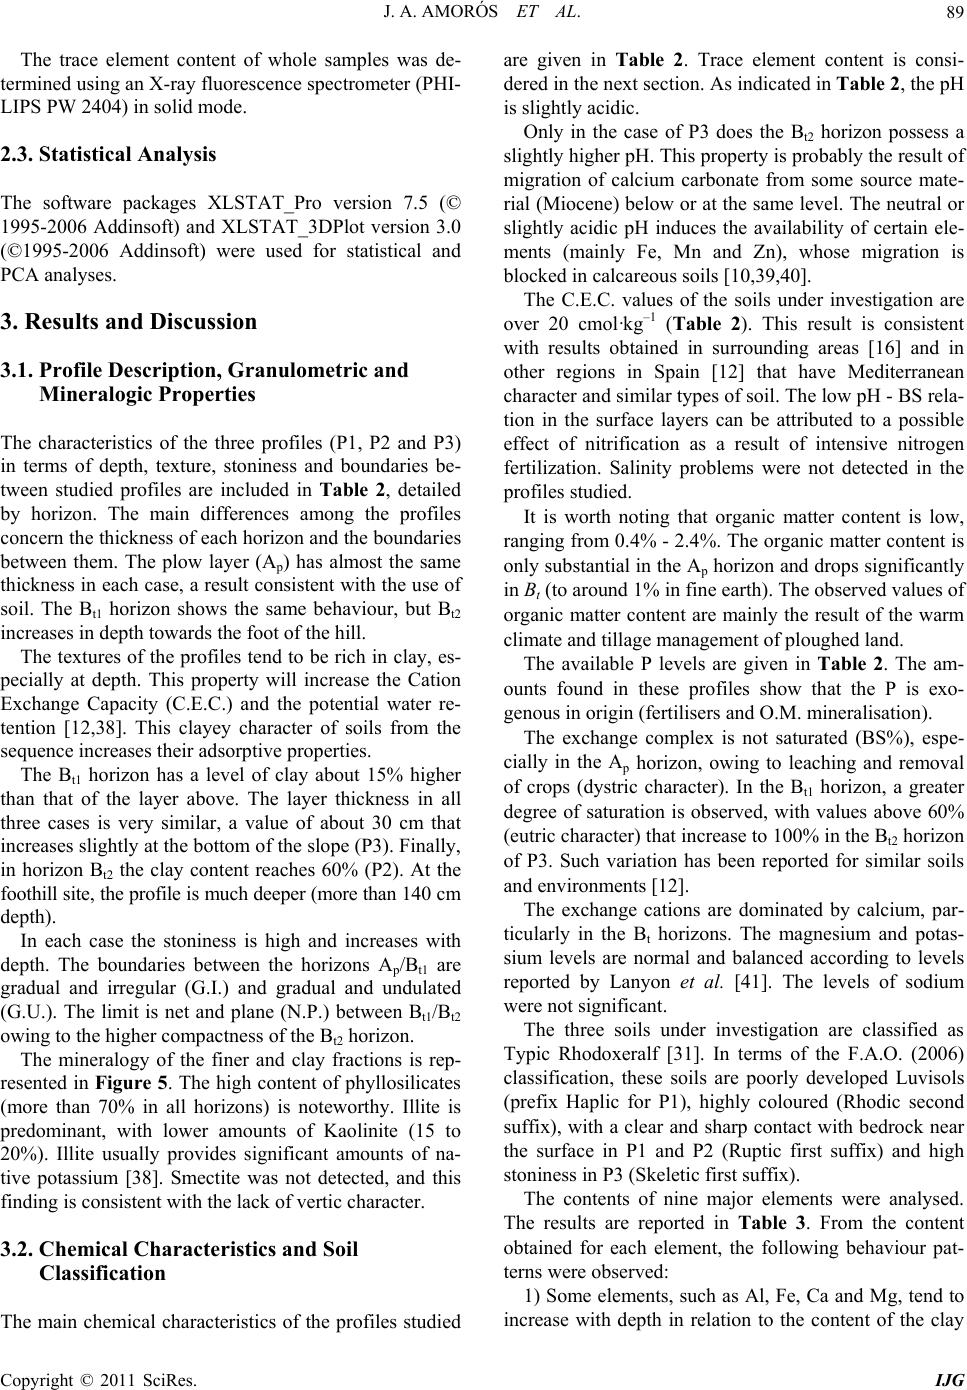 J. A. AMORÓS ET AL. Copyright © 2011 SciRes. IJG 89 The trace element content of whole samples was de- termined using an X-ray fluorescence spectrometer (PHI- LIPS PW 2404) in solid mode. 2.3. Statistical Analysis The software packages XLSTAT_Pro version 7.5 (© 1995-2006 Addinsoft) and XLSTAT_3DPlot version 3.0 (©1995-2006 Addinsoft) were used for statistical and PCA analyses. 3. Results and Discussion 3.1. Profile Description, Granulometric and Mineralogic Properties The characteristics of the three profiles (P1, P2 and P3) in terms of depth, texture, stoniness and boundaries be- tween studied profiles are included in Table 2, detailed by horizon. The main differences among the profiles concern the thickness of each horizon and the boundaries between them. The plow layer (Ap) has almost the same thickness in each case, a result consistent with the use of soil. The Bt1 horizon shows the same behaviour, but Bt2 increases in depth towards the foot of the hill. The textures of the profiles tend to be rich in clay, es- pecially at depth. This property will increase the Cation Exchange Capacity (C.E.C.) and the potential water re- tention [12,38]. This clayey character of soils from the sequence increases their adsorptive properties. The Bt1 horizon has a level of clay about 15% higher than that of the layer above. The layer thickness in all three cases is very similar, a value of about 30 cm that increases slightly at the bottom of th e slope (P3). Finally, in horizon Bt2 the clay content reaches 60% (P2). At the foothill site, the profile is much deeper (more than 140 cm depth). In each case the stoniness is high and increases with depth. The boundaries between the horizons Ap/Bt1 are gradual and irregular (G.I.) and gradual and undulated (G.U.). The limit is net and plane (N.P.) between Bt1/Bt2 owing to the higher compactness of the Bt2 horizon. The mineralogy of the finer and clay fractions is rep- resented in Figure 5. The high content of phyllosilicates (more than 70% in all horizons) is noteworthy. Illite is predominant, with lower amounts of Kaolinite (15 to 20%). Illite usually provides significant amounts of na- tive potassium [38]. Smectite was not detected, and this finding is consistent with the lack of vertic character. 3.2. Chemical Characteristics and Soil Classification The main chemical characteristics of the profiles studied are given in Table 2. Trace element content is consi- dered in the next section. As indicated in Table 2, the pH is slightly acidic. Only in the case of P3 does the Bt2 horizon possess a slightly higher pH. This property is probably the result of migration of calcium carbonate from some source mate- rial (Miocene) below or at the same level. The neutral or slightly acidic pH induces the availability of certain ele- ments (mainly Fe, Mn and Zn), whose migration is blocked in calcareous soils [10,39,40]. The C.E.C. values of the soils under investigation are over 20 cmol·kg–1 (Table 2). This result is consistent with results obtained in surrounding areas [16] and in other regions in Spain [12] that have Mediterranean character and similar types of soil. The low pH - BS rela- tion in the surface layers can be attributed to a possible effect of nitrification as a result of intensive nitrogen fertilization. Salinity problems were not detected in the profiles studied. It is worth noting that organic matter content is low, ranging from 0.4% - 2.4%. The organic matter content is only substantial in the Ap horizon and drops significantly in Bt (to around 1% in fine earth). The observ ed values of organic matter content are mainly the result of the warm climate and tillage management of ploughed land. The available P levels are given in Table 2. The am- ounts found in these profiles show that the P is exo- genous in origin (fertilisers and O.M. mineralisation). The exchange complex is not saturated (BS%), espe- cially in the Ap horizon, owing to leaching and removal of crops (dystric character). In the Bt1 horizon, a greater degree of saturation is observed, with values above 60% (eutric character) that increase to 100% in the Bt2 horizon of P3. Such variation has been reported for similar soils and environments [12]. The exchange cations are dominated by calcium, par- ticularly in the Bt horizons. The magnesium and potas- sium levels are normal and balanced according to levels reported by Lanyon et al. [41]. The levels of sodium were not significant. The three soils under investigation are classified as Typic Rhodoxeralf [31]. In terms of the F.A.O. (2006) classification, these soils are poorly developed Luvisols (prefix Haplic for P1), highly coloured (Rhodic second suffix), with a clear and sharp contact with bedrock near the surface in P1 and P2 (Ruptic first suffix) and high stoniness in P3 (Skeletic first suffix). The contents of nine major elements were analysed. The results are reported in Table 3. From the content obtained for each element, the following behaviour pat- terns wer e ob served: 1) Some elements, such as Al, Fe, Ca and Mg, tend to ncrease with depth in relation to the content of the clay i 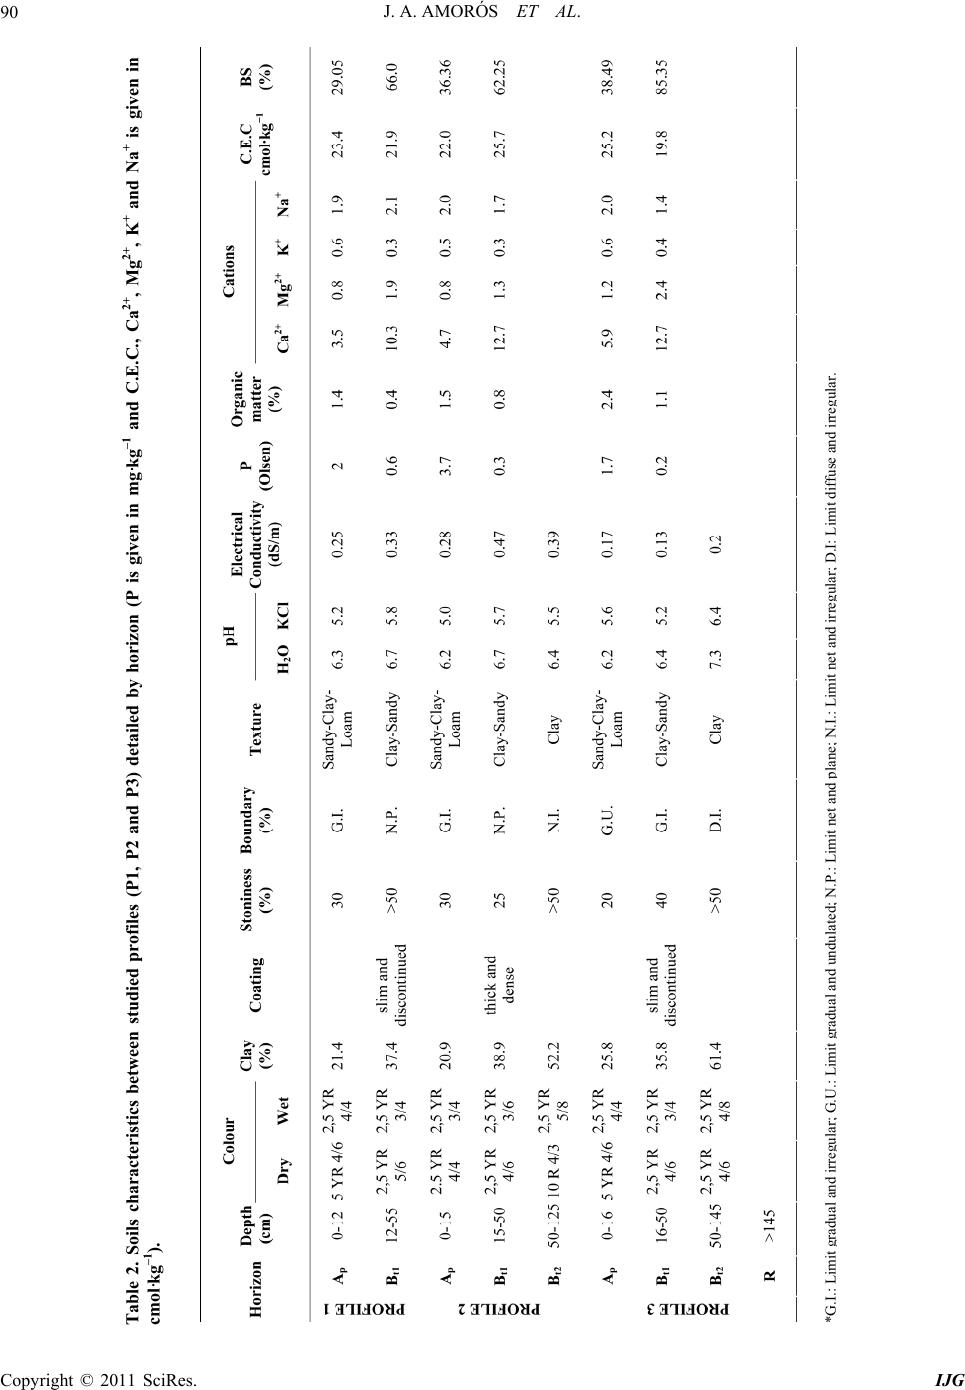 J. A. AMORÓS ET AL. 90 Table 2. Soils characteristics between studied profiles (P1, P2 and P3) detailed by horizon (P is given in mg·kg–1 and C.E.C., Ca2+, Mg2+, K+ and Na+ is given in cmol·kg–1). *G.I.: Limit radual and irre ular G.U.: Limit radual and undulated N.P.: Limit net and lane N.I.: Limit net and irre ular D.I: Limit diffuse an d i rre ular. Copyright © 2011 SciRes. IJG  J. A. AMORÓS ET AL.91 Figure 5. Mineralogy of finer and clay fractions. Top: percentage of minerals <2 µm. Bottom: Percentages of major clay types detected (smectite was not detected). Copyright © 2011 SciRes. IJG 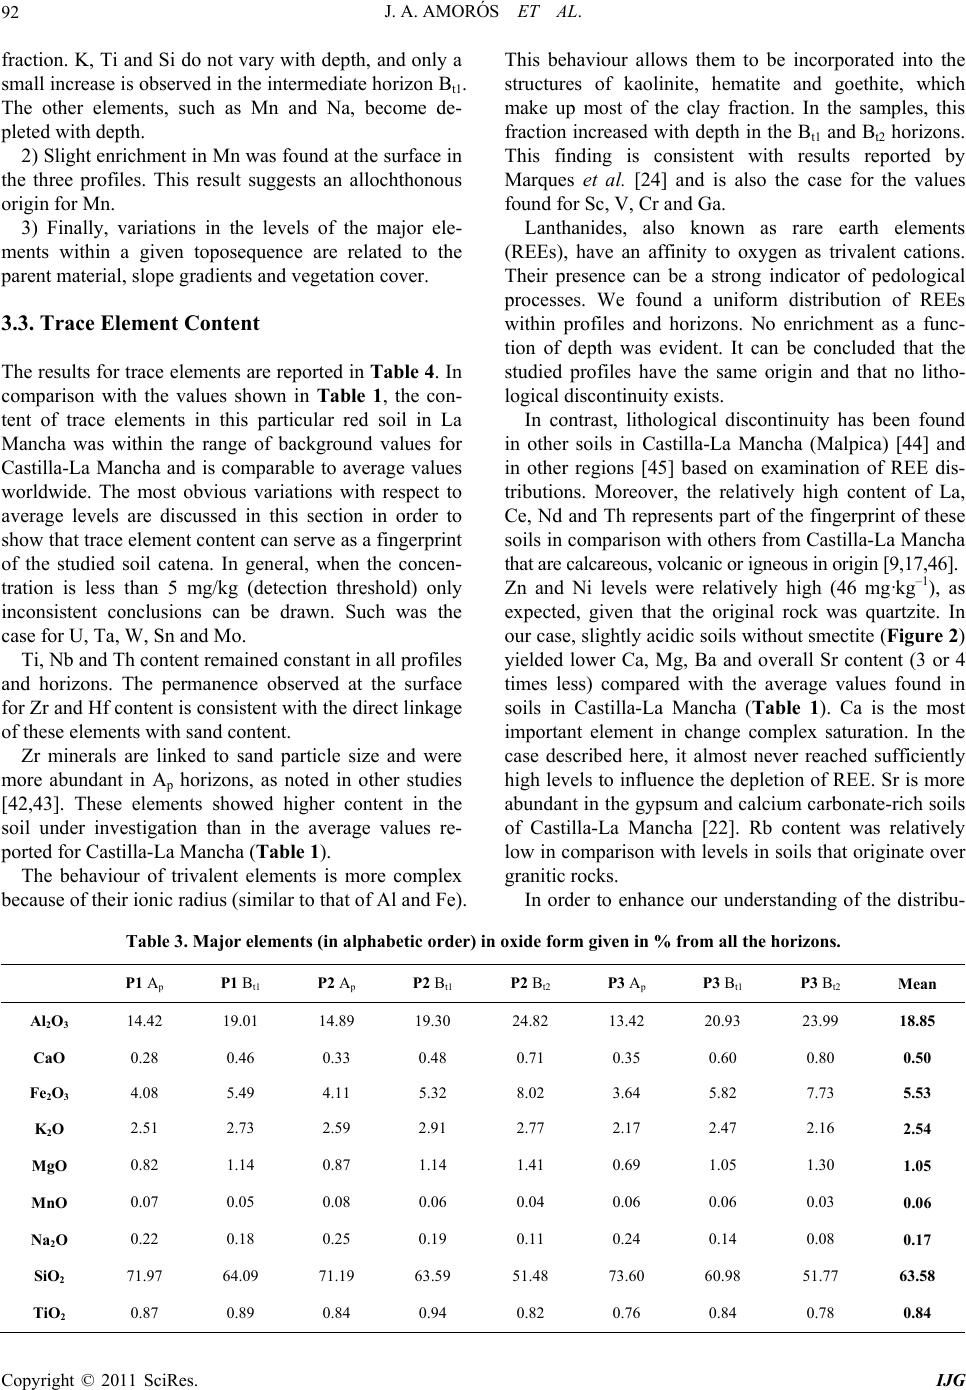 J. A. AMORÓS ET AL. Copyright © 2011 SciRes. IJG 92 fraction. K, Ti and Si do not vary with depth, and only a small increase is observed in the intermediate horizo n Bt1. The other elements, such as Mn and Na, become de- pleted with depth. 2) Slight enrichment in Mn was found at the sur face in the three profiles. This result suggests an allochthonous origin for Mn. 3) Finally, variations in the levels of the major ele- ments within a given toposequence are related to the parent material, slope gradients and vegetation cover. 3.3. Trace Element Content The results for trace elements are reported in Table 4. In comparison with the values shown in Table 1, the con- tent of trace elements in this particular red soil in La Mancha was within the range of background values for Castilla-La Mancha and is comparable to average values worldwide. The most obvious variations with respect to average levels are discussed in this section in order to show that trace element content can serve as a fingerprint of the studied soil catena. In general, when the concen- tration is less than 5 mg/kg (detection threshold) only inconsistent conclusions can be drawn. Such was the case for U, Ta, W, Sn and Mo. Ti, Nb and Th content remained constant in all prof iles and horizons. The permanence observed at the surface for Zr and Hf content is consistent with the direct linkage of these elements with sand content. Zr minerals are linked to sand particle size and were more abundant in Ap horizons, as noted in other studies [42,43]. These elements showed higher content in the soil under investigation than in the average values re- ported for Castilla-La Mancha (Table 1). The behaviour of trivalent elements is more complex because of their ionic radius (similar to that of Al and Fe). This behaviour allows them to be incorporated into the structures of kaolinite, hematite and goethite, which make up most of the clay fraction. In the samples, this fraction increased with depth in the Bt1 and Bt2 horizon s. This finding is consistent with results reported by Marques et al. [24] and is also the case for the values found for Sc, V, Cr and Ga. Lanthanides, also known as rare earth elements (REEs), have an affinity to oxygen as trivalent cations. Their presence can be a strong indicator of pedological processes. We found a uniform distribution of REEs within profiles and horizons. No enrichment as a func- tion of depth was evident. It can be concluded that the studied profiles have the same origin and that no litho- logical discontinuity ex ists. In contrast, lithological discontinuity has been found in other soils in Castilla-La Mancha (Malpica) [44] and in other regions [45] based on examination of REE dis- tributions. Moreover, the relatively high content of La, Ce, Nd and Th represents part of the fingerprint of these soils in comparison with others from Castilla-La Mancha that are calcareous, volcanic or igneous in origin [9,17,46]. Zn and Ni levels were relatively high (46 mg·kg–1), as expected, given that the original rock was quartzite. In our case, slightly acidic soils without smectite (Figure 2) yielded lower Ca, Mg, Ba and overall Sr content (3 or 4 times less) compared with the average values found in soils in Castilla-La Mancha (Table 1). Ca is the most important element in change complex saturation. In the case described here, it almost never reached sufficiently high levels to influence th e depletion of REE. Sr is more abundant in the gypsum and calcium carbonate-rich soils of Castilla-La Mancha [22]. Rb content was relatively low in comparison with leve ls in soils that originate over granitic rocks. In order to enhance our understanding of the distribu- Table 3. Major elements (in alphabetic order) in oxide form given in % from all the horizons. P1 Ap P1 Bt1 P2 Ap P2 Bt1 P2 Bt2 P3 Ap P3 Bt1 P3 Bt2 Mean Al2O3 14.42 19.01 14.89 19.30 24.82 13.42 20.93 23.99 18.85 CaO 0.28 0.46 0.33 0.48 0.71 0.35 0.60 0.80 0.50 Fe2O3 4.08 5.49 4.11 5.32 8.02 3.64 5.82 7.73 5.53 K2O 2.51 2.73 2.59 2.91 2.77 2.17 2.47 2.16 2.54 MgO 0.82 1.14 0.87 1.14 1.41 0.69 1.05 1.30 1.05 MnO 0.07 0.05 0.08 0.06 0.04 0.06 0.06 0.03 0.06 Na2O 0.22 0.18 0.25 0.19 0.11 0.24 0.14 0.08 0.17 SiO2 71.97 64.09 71.19 63.59 51.48 73.60 60.98 51.77 63.58 TiO2 0.87 0.89 0.84 0.94 0.82 0.76 0.84 0.78 0.84 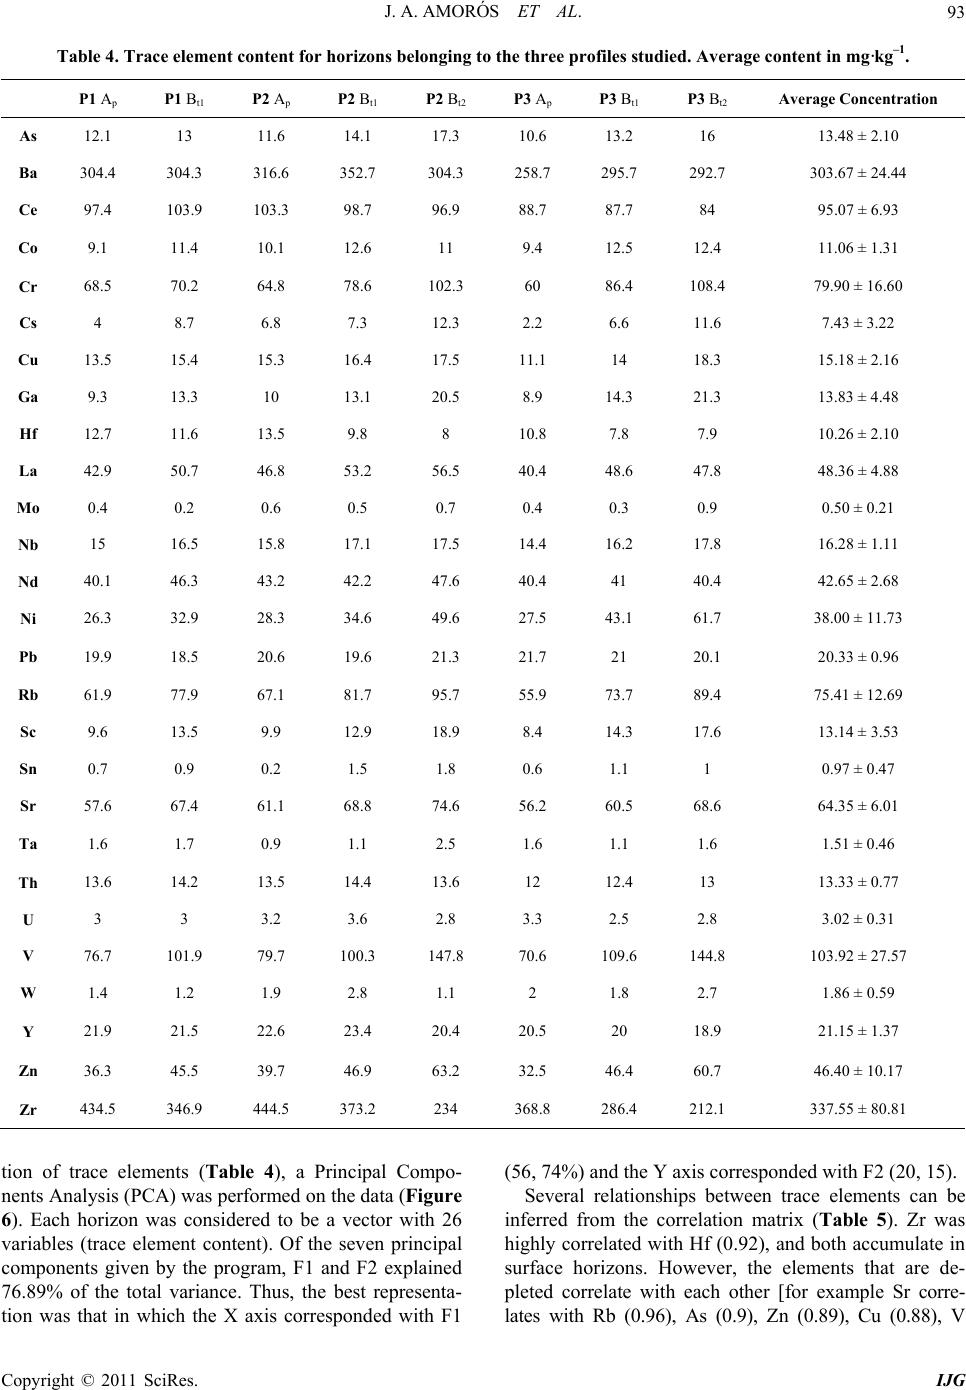 J. A. AMORÓS ET AL.93 Table 4. Trace element content for horizons belonging to the three profiles studied. Average content in mg·kg–1. P1 Ap P1 Bt1 P2 Ap P2 Bt1 P2 Bt2 P3 Ap P3 Bt1 P3 Bt2 Average Concentration As 12.1 13 11.6 14.1 17.3 10.6 13.2 16 13.48 ± 2.10 Ba 304.4 304.3 316.6 352.7 304.3 258.7 295.7 292.7 303.67 ± 24.44 Ce 97.4 103.9 103.3 98.7 96.9 88.7 87.7 84 95.07 ± 6.93 Co 9.1 11.4 10.1 12.6 11 9.4 12.5 12.4 11.06 ± 1.31 Cr 68.5 70.2 64.8 78.6 102.3 60 86.4 108.4 79.90 ± 16.60 Cs 4 8.7 6.8 7.3 12.3 2.2 6.6 11.6 7.43 ± 3.22 Cu 13.5 15.4 15.3 16.4 17.5 11.1 14 18.3 15.18 ± 2.16 Ga 9.3 13.3 10 13.1 20.5 8.9 14.3 21.3 13.83 ± 4.48 Hf 12.7 11.6 13.5 9.8 8 10.8 7.8 7.9 10.26 ± 2.10 La 42.9 50.7 46.8 53.2 56.5 40.4 48.6 47.8 48.36 ± 4.88 Mo 0.4 0.2 0.6 0.5 0.7 0.4 0.3 0.9 0.50 ± 0.21 Nb 15 16.5 15.8 17.1 17.5 14.4 16.2 17.8 16.28 ± 1.11 Nd 40.1 46.3 43.2 42.2 47.6 40.4 41 40.4 42.65 ± 2.68 Ni 26.3 32.9 28.3 34.6 49.6 27.5 43.1 61.7 38.00 ± 11.73 Pb 19.9 18.5 20.6 19.6 21.3 21.7 21 20.1 20.33 ± 0.96 Rb 61.9 77.9 67.1 81.7 95.7 55.9 73.7 89.4 75.41 ± 12.69 Sc 9.6 13.5 9.9 12.9 18.9 8.4 14.3 17.6 13.14 ± 3.53 Sn 0.7 0.9 0.2 1.5 1.8 0.6 1.1 1 0.97 ± 0.47 Sr 57.6 67.4 61.1 68.8 74.6 56.2 60.5 68.6 64.35 ± 6.01 Ta 1.6 1.7 0.9 1.1 2.5 1.6 1.1 1.6 1.51 ± 0.46 Th 13.6 14.2 13.5 14.4 13.6 12 12.4 13 13.33 ± 0.77 U 3 3 3.2 3.6 2.8 3.3 2.5 2.8 3.02 ± 0.31 V 76.7 101.9 79.7 100.3 147.8 70.6 109.6 144.8 103.92 ± 27.57 W 1.4 1.2 1.9 2.8 1.1 2 1.8 2.7 1.86 ± 0.59 Y 21.9 21.5 22.6 23.4 20.4 20.5 20 18.9 21.15 ± 1.37 Zn 36.3 45.5 39.7 46.9 63.2 32.5 46.4 60.7 46.40 ± 10.17 Zr 434.5 346.9 444.5 373.2 234 368.8 286.4 212.1 337.55 ± 80.81 tion of trace elements (Table 4), a Principal Compo- nents Analysis (PCA) was performed on the data (Figure 6). Each horizon was considered to be a vector with 26 variables (trace element content). Of the seven principal components given by the program, F1 and F2 explained 76.89% of the total variance. Thus, the best representa- tion was that in which the X axis corresponded with F1 (56, 74%) an d the Y axis corresponded with F2 (20, 15). Several relationships between trace elements can be inferred from the correlation matrix (Table 5). Zr was highly correlated with Hf (0.92), and both accumulate in surface horizons. However, the elements that are de- pleted correlate with each other [for example Sr corre- ates with Rb (0.96), As (0.9), Zn (0.89), Cu (0.88), V l Copyright © 2011 SciRes. IJG  J. A. AMORÓS ET AL. 94 Table 5. Correlation matrix. (Highlighted in black significant values; alpha = 0.050 (bilateral probe)). Copyright © 2011 SciRes. IJG 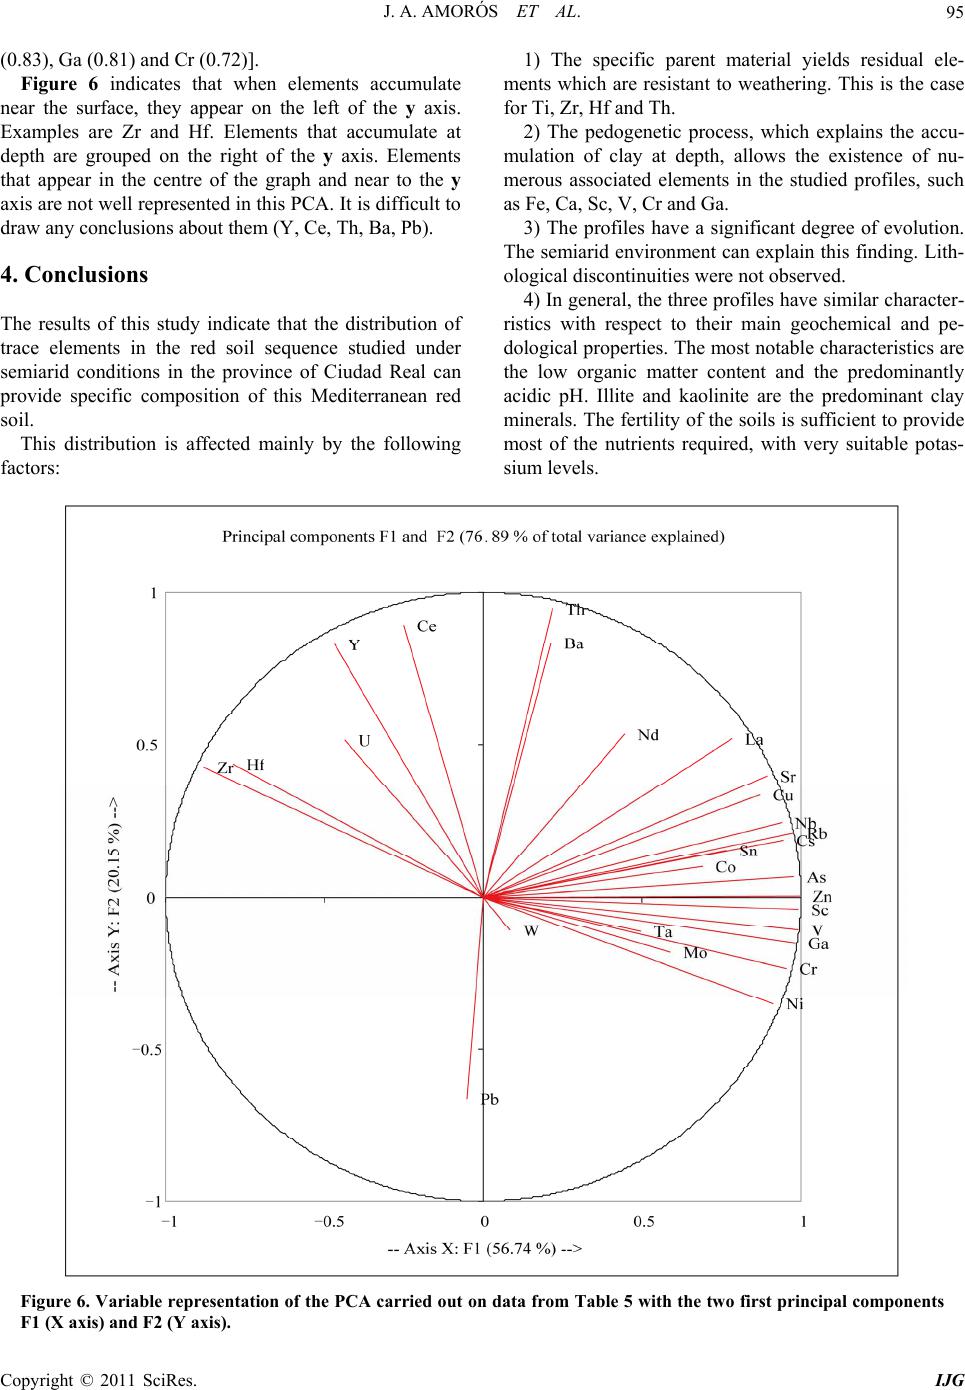 J. A. AMORÓS ET AL. Copyright © 2011 SciRes. IJG 95 (0.83), Ga (0.81) and Cr (0.72)]. Figure 6 indicates that when elements accumulate near the surface, they appear on the left of the y axis. Examples are Zr and Hf. Elements that accumulate at depth are grouped on the right of the y axis. Elements that appear in the centre of the graph and near to the y axis are not well represented in this PCA. It is difficult to draw any conclusions about them (Y, Ce, Th, Ba, Pb). 4. Conclusions The results of this study indicate that the distribution of trace elements in the red soil sequence studied under semiarid conditions in the province of Ciudad Real can provide specific composition of this Mediterranean red soil. This distribution is affected mainly by the following factors: 1) The specific parent material yields residual ele- ments which are resistant to weathering. This is the case for Ti, Zr, Hf and Th. 2) The pedogenetic process, which explains the accu- mulation of clay at depth, allows the existence of nu- merous associated elements in the studied profiles, such as Fe, Ca, Sc, V, Cr and Ga. 3) The profiles have a significant degree of evolution. The semiarid environment can explain this fin ding. Lith- ological discontinuities were not observed. 4) In general, the three profiles have similar character- ristics with respect to their main geochemical and pe- dological properties. The most notable characteristics are the low organic matter content and the predominantly acidic pH. Illite and kaolinite are the predominant clay minerals. The fertility of the soils is sufficient to provide most of the nutrients required, with very suitable potas- sium levels. Figure 6. Variable representation of the PCA carried out on data from Table 5 with the two first principal components F1 (X axis) and F2 (Y axis).  J. A. AMORÓS ET AL. Copyright © 2011 SciRes. IJG 96 5) Finally, the relatively low influence of human ac- tivity is indicated by the absence of surface enrichment of trace elements considered to be pollutants, namely Cu, Pb, Ni, Cr or Zn. In general, the geochemical characteristics for this soil are: 1) Low levels of some trace elements such as Sr (64.35 mg·k g–1), Ba (303.67 m g·kg–1) and Sc ( 13.14 mg ·kg–1) and major elements like Ca and Mg. 2) High levels of some trace elements such as V (103.92 mg·kg–1), Cr (79.9 mg·k g–1), Cu (15.18 mg·kg–1), Hf (10.26 mg·kg–1), Ni (38 mg·kg–1) and Zr (337 mg·kg1) and major elements like Fe. 3) High levels of REEs such as La (48.36 mg·kg–1), Ce (95.07 mg·kg–1), Th (13.33 mg·kg–1) an d Nd (42. 65 mg·kg–1). In general, the results show that the textur e of the soils and their stoniness can allow the development of crops as long as these crops do not have to compete for water. In particular, these soils can be used for the cultivation of high-quality grapes. To ensure the settling of the crop and as well as water-holding capacity, 1 m of soil must be left to accommodate the roots. Finally, it is important to mention that the data ob- tained in this study can serve as a pattern for extended agro-edaphic areas (almost 20% from Ciudad Real pro- vince and more than 10% from Toledo province). The study data are potentially useful for evaluating potential uses of the soils in accordance with their content of trace elements. However, specific studies must be considered, depending on location, in order to eliminate other an- thropogenic and allochthonous influences. 5. Acknowledgements This project was partially financed by the project “Soil Atlas of Castilla-La Mancha” elaborated by the Depart- ment of Agriculture of the Regional Government (Re- gional Government of Castilla-La Man c ha). 6. References [1] D. H. Yaalon, “Soils in the Mediterranean Region: What Makes Them Different?” Catena, Vol. 28, No. 3-4, 1997, pp. 157-169. doi:10.1016/S0341-8162(96)00035-5 [2] J. Bech, J. Rustullet, J. Garrigó, F. J. Tobías and R. Martínez, “The Iron Content of Some Red Mediterranean Soils from Northeast Spain and Its Pedogenic Signifi- cance,” Catena, Vol. 28, No. 3-4, 1997, pp. 221-229. doi:10.1016/S0341-8162(96)00039-2 [3] J. Torrent and U. Schwertmann, “Influence of Hematite on the Color of Red Beds,” Journal of Sedimentary Research, Vol. 57, No. 4, 1987, pp. 682-686. [4] V. Boero and U. Schwertmann, “Iron Oxide Mineralogy of Terra Rossa and Its Genetic Implications,” Geoderma, Vol. 44, No. 4, 1989, pp. 319-327. doi:10.1016/0016-7061(89)90039-6 [5] P. Tsaousidou, E. Gartzos, A. Tsagalides, C. Haidouti and D. Gasparatos, “Iron Oxides in Four Red Mediterranean Soils on Metarhyolite and Metadolerite in Kilkis, Gree- ce,” Archives of Agronomy and Soil Science, Vol. 54, No. 2, 2008, pp. 227-235. doi:10.1080/03650340701808922 [6] L. Hidalgo, “Caracterización Macrofísica del Ecosistema Medio-Planta en los Viñedos Españoles,” INIA Ser. Pro- ducción Vegetal, Vol. 29, 1980, p. 255. [7] Food and Agriculture Organization of the United Nations, “World Reference Base for Soil Resources,” World Soil Resources Reports, 2006. [8] M. A. S. José, I. Rabano, P. Herranz and J. C. Gutierrez, “El Paleozoico Inferior de la Zona Centro-Iberica Meridio- nal,” CSIC-University, Extremadura, 1992, pp. 505-522. [9] J. A. Amorós, et al., “Main Viticole Soils in Castilla-La Mancha,” Proceedings of 7th International Terroir Con- gress, Nyon, 19-23 May 2008, pp. 65-72. [10] J. J. Carlevalis, et al., “La Fertilidad de los Principales Suelos Agrícolas de la Zona Oriental de la Provincia de Ciudad Real La. Mancha y Campo de Montiel,” C.S.I.C. and J.J.C.C. Castilla-La Mancha, Vol. 1, 1992, p. 294. [11] I. Atalay, “Red Mediterranean Soils in Some Karstic Regions of Taurus Mountains Turkey,” Catena, Vol. 28, No. 3-4, 1997, pp. 247-260. doi:10.1016/S0341-8162(96)00041-0 [12] J. M. García and F. Santos, “Relationship between the Characteristics of Mediterranean Red Soils and the Age of the Geomorphological Surfaces in Central-Western Spain,” Catena, Vol. 28, No. 3-4, 1997, pp. 231-245. doi:10.1016/S0341-8162(96)00040-9 [13] N. Yassoglou, C. Kosman and N. Moustakas, “The Red Soils, Their Origin, Properties, Use and Management in Greece,” Catena, Vol. 28, No. 3-4, 1997, pp. 261-278. doi:10.1016/S0341-8162(96)00042-2 [14] I. Ortiz, M. Simón, C. Dorronsoro, F. Martín and I. Gar- cía, “Soil Evolution over the Quaternary Period in a Mediterranean Climate (SE Spain),” Catena, Vol. 48, No. 3, 2002, pp. 131-148. doi:10.1016/S0341-8162(01)00194-1 [15] A. Bronger and S. Sedov, “Vetusols and Paleosols: Natu- ral Versus Man Induced Environmental Change in the Atlantic Coastal Region of Morocco,” Quaternary Inter- national, Vol. 106-107, 2003, pp. 33-60. doi:10.1016/S1040-6182(02)00160-X [16] F. Serrano, et al., “Estudio de Suelos del Campo de Ca- latrava (Ciudad Real) y sus Condiciones de Fertilidad,” Consejo Superior de Investigaciones Científicas, Vol. 32, 2008, p. 415. [17] P. Conde, et al., “Trace Elements Contents in Different Soils of a Semiarid Mediterranean Environment: Castilla- -La Mancha, Spain,” Fresenius Environmental Bulletin, Vol. 18, No. 5, 2009, pp. 858-867. [18] J. A. Amorós, et al., “Description of Red Soils in a Semi-Arid Climate and Evaluation for Vineyard (Vitis Vinifera L.) Use,” Fresenius Environmental Bulletin, Vol.  J. A. AMORÓS ET AL.97 19, 2010, pp. 1199-1207. [19] H. R. Rollinson, “Using Geochemical Data: Evaluation, Presentation, Interpretation,” Longman, Singapore, 1993. [20] A. Martínez, et al., “Distribution of Some Selected Major and Trace Elements in Four Italian Soils Developed from the Deposits of the Gauro and Vico Volcanoes,” Geo- derma, Vol. 117, No. 3-4, 2003, pp. 215-224. doi:10.1016/S0016-7061(03)00124-1 [21] M. B. McBride, “Environmental Chemistry of Soils,” Oxford University Press, Oxford, 1994. [22] R. Jiménez-Ballesta, P. Conde, J. A. Martín and R. Gar- cía, “Pedogeochemical Baseline Concentration Levels and Soil Quality Reference Values of Trace Elements in Soils of Mediterranean Environment (Castilla-La Mancha, Sp- ain),” Actas VII Congreso Ibérico de Geoquímica, Soria, 21-23 September 2009, pp. 315-324. [23] A. Kabata-Pendias, “Trace Elements in Soils and Plants,” 3rd Edition, CRC Press, Boca Raton, 2001. [24] J. J. Marques, D. G. Schulze, N. Curi and S. A. Mertzman, “Trace Element Geochemistry in Brazilian Cerrado Soi ls, ” Geoderma, Vol. 121, No. 1-2, 2003, pp. 31-43. doi:10.1016/j.geoderma.2003.10.003 [25] D. Mathieu, M. Bernat and D. Nahon, “Short-Lived U and Th Isotope Distribution in a Tropical Laterite De- rived from Granite (Pitinga River Basin, Amazonia, Bra- zil): Application to Assessment of Weathering Rate,” Ear- th and Planetary Science Letters, Vol. 136, No. 3-4, 1995, pp. 703-714. doi:10.1016/0012-821X(95)00199-M [26] W. A. Deer, R. A. Howie and J. Zussman, “An Intro- duction to the Rock-Forming Minerals,” Longman, Har- low, 1985. [27] S. Thanachit, A. Suddhiprakarn, I. Kheoruenromne and R. J. Gilkes, “The Geochemistry of Soils on a Catena on Basalt at Khon Buri, Northeast Thailand,” Geoderma, Vol. 135, 2006, pp. 81-96. doi:10.1016/j.geoderma.2005.10.010 [28] M. E. Hodson, “Experimental Evidence for Mobility of Zr and Other Trace Elements in Soils,” Geochimica et Cosmochimica Acta, Vol. 66, No. 5, 2002, pp. 819-828. doi:10.1016/S0016-7037(01)00803-1 [29] P. Madejón, J. M. Murillo, T. Marañón, F. Cabrera and M. A. Soriano, “Trace Element and Nutrient Accumulation in Sunflower Plants Two Years after the Aznalcóllar Mine Spill,” The Science of the Total Environment, Vol. 307, No. 1-3, 2003, pp. 239-257. [30] J. A. Campos, N. A. Tejera and C. J. Sánchez, “Substrate Role in the Accumulation of Heavy Metals in Sporocarps of Wild Fungi,” Biometals, Vol. 22, No. 5, 2009, pp. 835- 841. doi:10.1007/s10534-009-9230-7 [31] SCS-USDA, “Soil Survey Laboratory Methods and Pro- cedures for Collecting Soil Samples,” Soil Survey Inve- stigations Report No. 1, US Govt. Printing Office, Wa- shington DC, 1972. [32] G. W. Gee and J. W. Bauder, “Particle-Size Analysis,” In: A. Klute, Ed., Methods of Soil Analysis. Part 1. Physical and Mineralogical Methods, 2nd Edition, ASA-SSSA, Madison, 1986, pp. 383-411. [33] S. R. Olsen, C. V. Cole, F. S. Watanabe and L. A. Dean, “Estimation of Available Phosphorus in Soils by Extra- ction with Sodium Bicarbonate,” US Govt. Printing Office, Washington DC, 1953. [34] D. V. Nelson and L. E. Sommers, “Total Carbon, Organic Carbon and Organic Matter,” In: A. L. Page, R. H. Miller and D. R. Keeney, Eds., Methods of Soil Analysis: Part 2, Chemical and Microbiological Properties, 2nd Edition, American Society of Agronomy and Soil Science Society of America, Madison, 1982, pp. 539-579. [35] G. W. Thomas, “Exchangeable Cations,” In: A. L. Page, R. Miller and D. Keeney, Eds., Methods of Soil Analysis, Part 2, American Society of Agronomy and Soil Science Society of America, Madison, 1982, pp. 159-165. [36] J. M. Bremner and C. S. Mulvaney, “Nitrogen Total,” In: A. L. Page, Ed., Methods of Soil Analysis Part 2, Che- mical and Microbiological Properties, American Society of Agronomy and Soil Science Society of America, Ma- dison, 1982, pp. 621-622. [37] D. M. Moore and R. C. J. Reynolds, “X-Ray Diffraction and the Identification and Analysis of Clay Minerals,” Oxford University Press, Oxford, 1989. [38] J. B. Dixon, “Roles of Clays in Soils,” Applied Clay Sci- ence, Vol. 5, No. 5-6, 1991, pp. 489-503. doi:10.1016/0169-1317(91)90019-6 [39] A. Wild, “Condiciones del suelo y Desarrollo de las Plan- tas Según Russel,” Mundiprensa, Madrid, 1992. [40] J. Porta, M. López-Acevedo and R. Poch, “Introducción a la Edafología. Uso y Protección del Suelo,” Mundiprensa, Madrid, 2008. [41] D. M. Lanyon, A. Cass and D. Hansen, “The Effect of Soil Properties on Vine Performance,” CSIRO Land and Water Technical Report 34/04, 2004. [42] C. A. Stiles, C. I. Mora and S. G. Driesse, “Pedogenetic Processes and Domain Boundaries in a Vertisol Climo- sequence: Evidence from Titanium and Zirconium Distri- bution and Morphology,” Geoderma, Vol. 116, No. 3-4, 2003, pp. 279-299. doi:10.1016/S0016-7061(03)00105-8 [43] T. Taboada, A. Martínez, C. Garcia and E. Garcia-Rodeja, “Particle Size Fractionation of Titanium and Zirconium during Weathering and Pedogenesis Rocks in NW S pain ,” Geoderma, Vol. 131, No. 1-2, 2006, pp. 218-236. doi:10.1016/j.geoderma.2005.03.025 [44] F. J. García, J. A. Amorós, C. Sánchez and R. Jiménez- Ballesta, “Red Soil Geochemistry in a Semiarid Mediter- ranean Environment and Its Suitability for Vineyards,” Environmental Geochemistry and Health, Vol. 33, No. 3, 2010, pp. 315-324. [45] E. A. D. N. Fernandes and F. A. M. Bacchi, “Lanthanides in the Study of Lithologic Discontinuity in Soils from the Piracicaba River Basin,” Journal of Alloys and Com- pounds, Vol. 275-277, 1998, pp. 924-928. doi:10.1016/S0925-8388(98)00486-1 [46] R. J. Ballesta, P. C. Bueno, J. A. M. Rubí and R. G. Giménez, ”Pedo-Geochemical Baseline Content Levels and Soil Quality Reference Values of Trace Elements in Soils from the Mediterranean (Castilla la Mancha, Sp a i n ), ” Central European Journal of Geosciences, Vol. 2, No. 4, 2010, pp. 441-454. doi:10.2478/v10085-010-0028-1 Copyright © 2011 SciRes. IJG
|