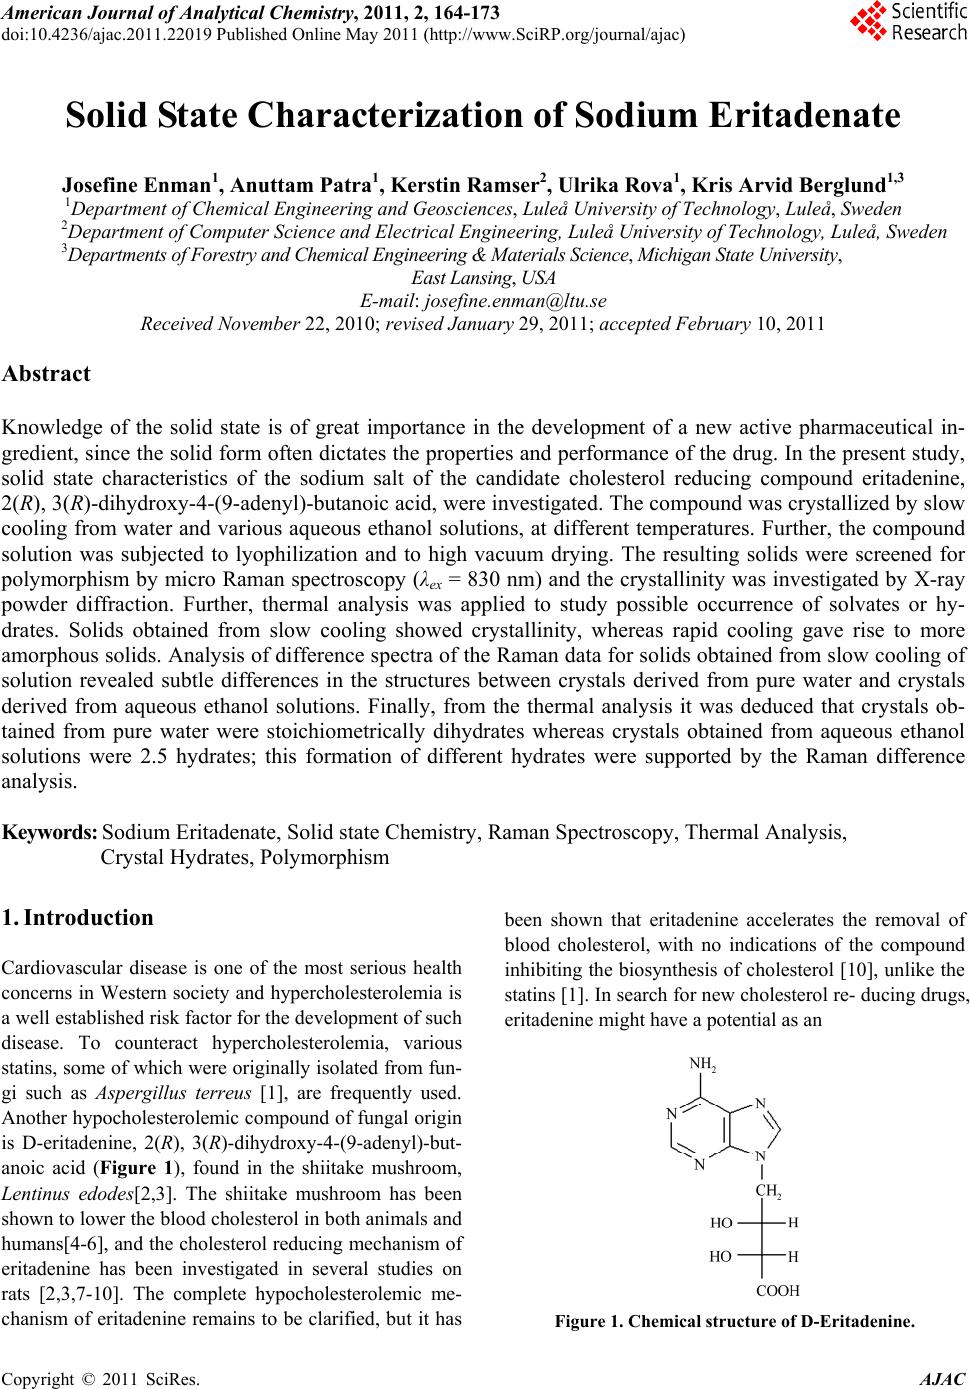
 American Journal of Anal yt ical Chemistry, 2011, 2, 164-173 doi:10.4236/ajac.2011.22019 Published Online May 2011 (http://www.SciRP.org/journal/ajac) Copyright © 2011 SciRes. AJAC Solid State Characterization of Sodium Eritadenate Josefine Enman1, Anuttam Patra1, Kerstin Ramser2, Ulrika Rova1, Kris Arvid Berglund1,3 1Department of Chemical Engineering and Geosciences, Luleå University of Technology, Luleå, Sweden 2Department of Computer Science and Electrical Engineering, Luleå University of Technology, Luleå, Sweden 3Departments of Forestry and Chemical Engineering & Materials Science, Michigan State University, East Lansing, USA E-mail: josefine.enman@ltu.se Received November 22, 2010; revised January 29, 2011; accepted February 10, 2011 Abstract Knowledge of the solid state is of great importance in the development of a new active pharmaceutical in- gredient, since the solid form often dictates the properties and performance of the drug. In the present study, solid state characteristics of the sodium salt of the candidate cholesterol reducing compound eritadenine, 2(R), 3(R)-dihydroxy-4-(9-adenyl)-butanoic acid, were investigated. The compound was crystallized by slow cooling from water and various aqueous ethanol solutions, at different temperatures. Further, the compound solution was subjected to lyophilization and to high vacuum drying. The resulting solids were screened for polymorphism by micro Raman spectroscopy (λex = 830 nm) and the crystallinity was investigated by X-ray powder diffraction. Further, thermal analysis was applied to study possible occurrence of solvates or hy- drates. Solids obtained from slow cooling showed crystallinity, whereas rapid cooling gave rise to more amorphous solids. Analysis of difference spectra of the Raman data for solids obtained from slow cooling of solution revealed subtle differences in the structures between crystals derived from pure water and crystals derived from aqueous ethanol solutions. Finally, from the thermal analysis it was deduced that crystals ob- tained from pure water were stoichiometrically dihydrates whereas crystals obtained from aqueous ethanol solutions were 2.5 hydrates; this formation of different hydrates were supported by the Raman difference analysis. Keywords: Sodium Eritadenate, Solid state Chemistry, Raman Spectroscopy, Thermal Analysis, Crystal Hydrates, Polymorphism 1. Introduction Cardiovascular disease is one of the most serious health concerns in Western society and hypercholesterolemia is a well established risk factor for the development of such disease. To counteract hypercholesterolemia, various statins, some of which were originally isolated from fun- gi such as Aspergillus terreus [1], are frequently used. Another hypocholesterolemic compound of fungal origin is D-eritadenine, 2(R), 3(R)-dihydroxy-4-(9-adenyl)-but- anoic acid (Figure 1), found in the shiitake mushroom, Lentinus edodes[2,3]. The shiitake mushroom has been shown to lower the blood cholesterol in both animals and humans[4-6], and the cholesterol reducing mechanism of eritadenine has been investigated in several studies on rats [2,3,7-10]. The complete hypocholesterolemic me- chanism of eritadenine remains to be clarified, but it has been shown that eritadenine accelerates the removal of blood cholesterol, with no indications of the compound inhibiting the biosynthesis of cholesterol [10], unlike the statins [1]. In search for new cholesterol re- ducing drugs, eritadenine might have a potential as an Figure 1. Chemical structure of D-Eritadenine.  J. ENMAN ET AL.165 active pharmaceutical ingredient, conceivably as a com- plement to the statins. Since active pharmaceutical ingredients are commonly delivered as solids, one key aspect in their development is research comprising the solid state chemistry of the compound. The solid form of a pharmaceutical substance greatly influences its properties and performance, such as stability and bioavailability, and an understanding of the solid state in relation to its functional properties is fun- damental when developing a new drug [11,12]. A given drug substance can be present in several different solid forms, commonly as crystalline polymorphs, i.e. solids with the same elemental composition but different crystal structures; as solvates, in which solvent molecules are present in the crystal structure; as desolvated solvates for which the crystal structure is principally retained upon solvent loss, or as amorphous solids, which show no or only partial crystallinity [11]. In the pharmaceutical in- dustry a variety of methods are applied for production of solids and which crystal form is obtained depends on the crystallization conditions applied, e.g. solvent composi- tion [13] and temperature [14]. The objectives of the present study were to investigate the effects of solvent composition and temperature on the crystal structure of the cholesterol reducing compound eritadenine. For acidic drug products the sodium salts are commonly the chosen derivatives, because of higher so- lubility and generally increased biocompatibility [15]. Consequently the sodium salt of eritadenine, sodium eritadenate, was investigated in the present study. As solvent systems, pure water and various aqueous ethanol solutions were used since these are frequently applied in the pharmaceutical industry. Sodium eritadenate was slowly crystallized from water and different aqueous ethanol solutions, at different temperatures, by means of cooling, and subjected to rapid cooling from water solu- tions by either lyophilization or drying under high vac- uum. The resulting solids were collected and analyzed by X-ray powder diffraction (XRPD), micro Raman spec- troscopy and thermal analysis, to investigate for crystal- linity and for the occurrence of possible polymorphs, solvates or hydrates. 2. Materials and Methods 2.1. Synthesis of Sodium Eritadenate Sodium eritadenate was synthesized as previously de- scribed [16]. In summary, methyl 2,3-O-isopropylidene- -D-ribofuranoside was first synthesized [17] and proc- essed to methyl 2,3-O-isopropylidene-5-O-p-toluene-su- lfonyl- -D-ribofuranoside [18]. The latter reacted with the sodium salt of adenine to give the compound methyl 5-(6-aminopurin-9H-9-yl)-2,3-O-isopropylidene-5-deoxy - -D-ribofuranoside, which underwent hydrolysis to 5- (6-aminopurin-9H-9-yl)-5-deoxy-D-ribofuranose. In the final step, oxidation of the latter in alkaline media re- sulted in sodium eritadenate [19]. 2.2. Solubility Studies The solubility of sodium eritadenate in pure water and in 15, 30 and 50% (v/v) aqueous ethanol solutions was stu- died. The concentrations of sodium eritadenate used were in the ranges 50 - 300 mg/mL and 5 - 150 mg/mL, for pure water and aqueous ethanol solutions, respec- tively. All solubility studies took place in microtiter wells, which were tightly covered and placed in a Ther- mo forma orbital shaker, at 200 rpm. The solubility was observed after 24 hours at 20, 30, 40 and 50˚C for all solvent systems, and additionally at 60˚C for pure water. 2.3. Crystallization Procedure Based on the solubility studies, 15 - 60 mg of sodium eri- tadenate in 200 μl of water, 6 - 30, 3 - 14 and 1 - 12 mg of sodium eritadenate in 200 μl of 15, 30 and 50% aqueous ethanol solutions, respectively, were added to microtiter wells. The wells were tightly covered and the samples heated and slowly cooled down, using a Thermo forma orbital shaker. Solid forms obtained at 20, 30, 40 and 50˚C were collected and dried. Eritadenine in pure water was also subjected to high vacuum drying and to lyophi- lization. 2.4. Characterization of Solids 2.4.1. X-Ray Powder Diffraction Measurements X-ray powder diffraction data of selected solid samples were recorded with a Siemens D5000 diffractometer, using CuKα radiation and variable slits. The samples were investigated in the 2-theta range 7˚ - 90˚, in Bragg- Brentano geometry, with a step size of 0.01, for 15 hours. 2.4.2. Raman Measurements The solid state Raman spectra of all solids were recorded with a Renishaw 2000 micro Raman spectrometer and approximately 20 mg of sodium eritadenate, on a glass slide, were used for each measurement. The excitation wavelength was 830 nm, giving excellent signal strength while minimizing photo-induced damage. The power onto the sample was 50 mW and the integration time was 10 sec. For all measurements a 20 long working dis- tance (LWD) microscope objective was used. Correction for the energy sensitivity of the spectrometer was per- formed by measuring the spectrum of a calibrated light Copyright © 2011 SciRes. AJAC  J. ENMAN ET AL. Copyright © 2011 SciRes. AJAC 166 source and calculating the intensity wave number re- sponse curve. Each Raman spectrum was filtered by the noise-reduction algorithm according to Eilers [20]. The background was automatically subtracted using the algo- rithm by Cao et al. [21], which fits a piecewise modified polynomial to the spectrum, and spectra were vector normalized to get equal integrated areas. The preproc- essing algorithms, except the one by Eilers, were written in-house and implemented in Matlab (version R2007b including Statistics Toolbox version 6.1). The occurrence of possible polymorphs of sodium eritadenate was inves- tigated by examining the ratio of the Raman intensity lines and by plotting difference spectra between crystals obtained from water, between crystals obtained from aqueous ethanol, and by investigating the difference spectrum between crystals derived from water and crys- tals derived from ethanol solutions. The Full Width at Half Maximum (FWHD) of the Raman line that exposed the most prominent difference, i.e. at 742 cm−1, was cal- culated for several spectra. 2.4.3. Thermal Analysis Differential scanning calorimetry (DSC).The thermal behavior of selected solid samples was studied using a Thermal Advantage DSC Q1000 (TA instrument). The samples were scanned from 20 to 260˚C, at a heating rate of 10˚C/min, under nitrogen purge. Thermogravimetric analysis (TGA). The changes in sample mass with temperature were measured by ther- mogravimetric analysis (TGA) using the Thermal Ad- vantage TGA Q5000 (TA instrument-Waters, LLC) mod- ule. The samples were heated from 20 to 260˚C, at a heating rate of 10˚C/min, under nitrogen purge. Evolved gas analysis-mass spectrometry (EGA-MS). For identification of the evolved gas on heating, a Netzsch STA 409 instrument equipped with simultane- ous thermo-gravimetric (TG), differential scanning calo- rimetric (DSC) and quadropole mass spectrometric (QMS) analysis was used. The experiments were con- ducted in flowing argon while heating from 20 to 260˚C, at a heat- ing rate of 10˚C/min. 3. Results and Discussion The solubility of sodium eritadenate was comparatively high in pure water and virtually insoluble in absolute ethanol (Figure 2); hence the highest ethanol concentra- tion used for crystallization in this study was 50% (v/v). Sodium eritadenate was crystallized from water and aqueous ethanol solutions, by controlled cooling, and additionally subjected to rapid cooling from water solu- tions. The resulting solids were then investigated by means of X-ray powder diffraction, Raman spectroscopy and thermal analysis. X-ray powder diffraction is a powerful technique for identifying crystalline phases [22] and was employed to Figure 2. Solubility of sodium eritadenate in pure water (●), 15% aqueous ethanol (∆), 30% aqueous ethanol (♦) and 50% aqueous ethanol (□).  J. ENMAN ET AL. Copyright © 2011 SciRes. AJAC 167 establish if the solids of sodium eritadenate were crystal- line or amorphous. The XRPD data presented are in the 2-theta range 10˚ - 50˚, since all distinctive peaks were found in this range (Figures 3(a)-(c)). These data indi- cated that solids resulting from slow cooling were crys- talline and their patterns similar, irrespective of the sol- vent used (Figures 3(a)-(b)), whereas solids obtained from rapid cooling gave rise to more amorphous patterns (Figure 3(c)). However, some crystalline pattern could be observed for the lyophilized solid and this could be attributed to small crystals in the amorphous phase. By optical microscopy studies (data not shown) it was veri- fied that there were small crystals within the amorphous sample. Micro Raman spectroscopy is a highly valuable tech- nique for investigating structural properties of molecules, such as polymorphism [23,24] and all solid forms of so- dium eritadenate obtained from the crystallization pro- cedure in this study were screened for the occurrence of polymorphism, by Raman spectroscopy. Three different Raman spectra were recorded for each solid form and the spectra were background corrected and normalized in order to optimize comparison. In accordance with the XRPD measurements (Figure 3), the solids obtained from slow cooling showed more crystallinity in the Ra- man spectra (Figures 4(a)-(b)) and the solid forms ob- tained from fast cooling (Figures 4(c)-(d)) gave rise more amorphous patterns. The latter is plausible since amorphous forms are readily obtained by lyophilization or other means of rapid cooling [25-27]. In some cases, the amorphous forms of pharmaceuticals are used as products because of enhanced solubility [28] and occa- sionally increased bioavailability [29], but generally this form is not marketed due to lower chemical stability than the crystalline counterpart [27]. The Raman spectra of all solids resulting from slow cooling of solution had a sim- ilar appearance, irrespective of temperature and sol- vent composition (Figures 4(a)-(b)). Further, they were highly reproducible and correlated well with the earlier assignments of the eritadenine Raman spectrum [30]. Based on the Raman intensity ratio, there was no sig- nificant difference between the different solid forms. In order to study more subtle differences in the crystal structures, difference spectra were plotted (Figure 5). The analysis of the difference spectra revealed small changes at several Raman lines, i.e. at 742, 1320/1354 Figure 3. X-ray powder diffraction pattern of sodium eritadenate solids obtained by slow cooling from water (a) and by slow cooling from aqueous ethanol (b).  J. ENMAN ET AL. 168 Figure 4. Raman spectra of sodium eritadenate solids obtained by slow cooling from water (a), by slow cooling from aqueous ethanol (b), by lyophilization (c), by high vacuum drying (d), by dehydration of A (e) and by dehydration of B (f) . The inset shows the region between 1000 and 1150 cm–1, where the Raman lines arise from vibrations in the carbon chain moiety. The upper graph in the inset is from (c), while the lower graph is from (b). and 1583 cm–1 (breathing and deformation of the ring structure), as well as at 880, 926 and at 1365 cm–1 (stretching vibrations of the carbon chain). These differ- ences were negligible when comparing spectra for crys- tals obtained from water at different temperatures (Fig- ure 5(a)), and likewise for crystals obtained from differ- ent aqueous ethanol concentrations (Figure 5(b)). How- ever, the differences increased significantly when spectra of crystals derived from water were subtracted from spectra of crystals derived from aqueous ethanol solu- tions (Figure 5(c)). This indicates that these two types of crystals might form slightly different hydrates or solvates influencing the crystal structure. The Raman line that re- vealed the most prominent difference was found at 742 cm–1. When comparing the FWHD of this Raman line for the spectra of crystals derived from water with the spectra of crystals derived from aqueous ethanol solutions, a broadening by 2 cm–1 was found for sodium eritadenate crystallized from water solutions (Inset of Figure 5). Narrow bands indicate a rigid structure, hence, it can be argued that crystals derived from aqueous ethanol solu- tions are more crystalline than those obtained from pure Copyright © 2011 SciRes. AJAC  J. ENMAN ET AL.169 water. A preliminary study with solid state NMR spec- troscopy supports these results. Analyzing both 13C and 15N SS-NMR spectra for crystals derived from water and aqueous ethanol solutions, it was found that there are slight, but noticeable differences in some of the peak positions, indicating the presence of two different types of crystals. A more detailed discussion will be published elsewhere. To investigate the thermal behavior and possible exis- tence of solvates or hydrates, crystalline solids were stu- died by thermal analysis. The TGA curve (Figure 6(a)) of sodium eritadenate crystallized from water showed a mass loss in the temperature range 70˚C - 130˚C, which was estimated to 12%. The corresponding temperature Figure 5. Raman difference spectrum for sodium eritadenate crystals obtained from water solutions (a), for sodium eritade- nate crystals obtained from aqueous ethanol solutions (b) and for crystals of sodium eritadenate obtained from water and aqueous ethanol solutions (c). A broadening of the peak at 742 cm–1 of 2 cm–1 for water derived crystals is indicated and was verified by the FWHD, as shown in the inset from (a). Copyright © 2011 SciRes. AJAC  J. ENMAN ET AL. Copyright © 2011 SciRes. AJAC 170 range in the DTG curve showed that the mass loss oc- curred in two sequential steps, and the EGA-MS further identified it as water loss. The total mass loss calculated amid the two peaks shown in the DTG curve, suggest that two water equivalents departed the crystal structure, one after another. Hence, the water molecules are differ- ently bound in this type of hydrate, which could be sup- ported by the crystal structure of sodium eritade- nate determined previously [31]. Approximately one third of all active pharmaceutical ingredients are able to form crystal hydrates [12] and sodium salts of all differ- ent types of drugs are particularly apt to form crystal hy- drates [15]. In the DSC curve, the water loss was rep- resented by an endothermic peak, which was followed by a sharp endothermic peak starting at about 135˚C. It is plausible that the latter peak corresponds either to melt- ing of the compound or to a phase transition, since no mass change occurred. In a separate experiment, upon heating the crystals to 160˚C under nitrogen atmosphere, no melting could be observed. However, by investigating this anhydrous form by Raman spectroscopy (Figure 4(e)), it could be seen that there was a transition to amorphous phase upon de- hydration. Solvent molecules commonly stabilize the crystal structure and desolvation can thus cause amor- phous materials [32]. In this case the water molecules act as stabilizers, due to their incorporation in the crystal structure [31], and hence dehydration would reasonably disrupt the crystal structure. Since water is a small mo- lecule it is apt to fill vacancies and its exceptional hy- drogen bonding capacity, to other water molecules or- functional groups, enables the formation of stable crystal structures [12]. Starting at about 225˚C, an endothermic peak was observed in the DSC curve (Figure 6(a)); however, at the same temperature a mass change was seen in the TGA curve. This, combined with carbon di- oxide formation as shown by EGA-MS, indicated that decomposition of the compound took place. Figure 6. Thermal analysis for sodium eritadenate crystals obtained from water solutions (a) and from aqueous ethanol solu- tions (b).  J. ENMAN ET AL. Copyright © 2011 SciRes. AJAC 171 For the crystals forming from aqueous ethanol, a mass loss was detected between 55 - 125˚C in the TGA curve (Figure 6(b)) and estimated to 14%. The mass loss was further observed by one broad peak in the DTG curve and a broad endothermic peak in the DSC curve. The EGA-MS showed that water was departing the crystals, whereas no ethanol could be detected. Hence, in these types of crystals there are reasonably 2.5 molecules of water per molecule sodium eritadenate, according to the mass loss. As stated above, sodium salts of drug mole- cules are prone to form hydrates. It should also be em- phasized that, due to a low ability of forming multi-point hydrogen bonding, ethanol is distinguished by a low li- kelihood to be incorporated into solvates [33]. Accom- panying the water loss, a diffuse endothermic peak could be observed in the DSC curve. Again, upon heating the crystals to 160˚C, under nitrogen atmosphere, and inves- tigating the anhydrous form by micro Raman spectros- copy (Figure 4(f)) it could be seen that there was a tran- sition to amorphous phase upon dehydration. Starting around 235˚C, a sharp endothermic peak was detected in the DSC curve (Figure 6(b)). Since there was no mass loss at this temperature, the compound was plausibly melting. The thermal analysis of crystals derived from water and from aqueous ethanol solutions indicated the former as dihydrates and the latter as 2.5 hydrates. These two types of hydrates showed a subtle difference in crystal structure, as indicated by micro Raman spectroscopy and clearly displayed different thermal behavior. A higher temperature was required for loss of water from the di- hydrates, and the loss was more stepwise. Based on these observations it is plausible that one or more water equi- valents are attached differently and/or more loosely to the crystal lattice of the 2.5 hydrates, as compared to the dihydrates. However, since there were no major dis- si- milarities between the crystal structures of the two types of hydrates, the difference in water binding is plau- sibly small and tentatively pertains to secondary water mole- cules more outside the lattice. Further, for both types of crystals the water loss resulted in more amor- phous ma- terials, verifying that water has a stabilizing effect on both types of hydrates. The decrease of structural order for the amorphous materials was especially apparent in the region between 1000 and 1150 cm–1, where the Raman lines are due to vibrations of the carbon chain moiety (Inset of Figure 4). Previously carried out polarization measurements show- ed that a change of the polarization direction by 90˚ re- sulted in an increase of the lines at 1066 and 1085 cm–1 ascribed to the (C - O) and (C - C)[30], indicating an increase in structural order. The carbon chain moiety has structural properties that enable certain orientations, which are stabilized by adjacent water molecules. For solid states of sodium eritadenate achieved through ly- ophilization, high vacuum drying or dehydration by heating above 120˚C, these bands more or less disap- peared (Figures 4(c)-(f)). Hence, by removing the stabi- lizing water molecules, the order of the solid pertaining to the carbon chain moiety is lost and a more amorphous structure is achieved. Conclusively, for both types of crystals, water mole- cules are presumably both highly incorporated into the crystal lattice and more loosely bound to the crystals. Further, the additional water molecule for every two molecules of sodium eritadenate in crystals derived from aqueous ethanol solutions, as compared to water derived crystals, is plausibly attached to the crystal lattice, but not as a part of the crystal structure. The thermal behav- ior as described above was shown to be highly repro- ducible for both types of hydrates. 4. Conclusions The solid forms of sodium eritadenate, as crystallized from water or aqueous ethanol solutions, at various tem- peratures and cooling methods, were investigated. Solids forming from slow cooling from either water or aqueous ethanol showed crystallinity and similar Raman and XRPD patterns, irrespective of temperature of formation, whereas rapid cooling resulted in more amorphous solids. However, a slight difference in the structure between crystals obtained from water and crystals obtained from aqueous ethanol could be observed by analyzing the dif- ference spectrum of the Raman data. Thermal analysis showed that the former were stoichiometrically dihydrates whereas the latter were 2.5 hydrates. The difference in water equivalents had a minor effect on the crystal structures, as observed by Raman spectroscopy but gave rise to clearly dissimilar thermal behaviors. Finally, both anhydrous forms were more amorphous than their hy- drated counterparts, verifying the stabilizing effect of water on the crystal structures. Future studies have to reveal whether there are any differences between the two hydrates with respect to stability and bioactivity and hence which solvent system to use for crystallization. Further, if the amorphous ma- terial of sodium eritadenate will be shown to exhibit equal biocompatibility and fulfil stability requirements, this form might also be considered as an active pharma- ceutical ingredient. In this case solidification can be achieved significantly faster. 5. Acknowledgements We wish to acknowledge Stefan Candefjord for preproc- essing of the Raman data, Linda Sandström for assis-  J. ENMAN ET AL. 172 tance with XRPD measurements and Amjad Alhalaweh and Ryan Robinson for assistance with thermal analysis. JE, UR and KAB acknowledge the financial support of Innovationsbron, the Research Council of Norrbotten, and Working Bugs AB. AP acknowledges financial sup- port from the foundation to the memory of J. C. and Seth M. Kempe (research grants JCK-2701 and JCK-2905). KR acknowledges financial support from the Swedish research council. 6. References [1] A. W. Alberts, J. Chen, G. Kuron, V. Hunt, J. Huff, C. Hoffman, J. Rothrock, M. Lopez, H. Joshua, E. Harris, A. Patchett, R. Monaghan, S. Currie, E. Stapley, G. Al- bers-Schonberg, O. Hensens, J. Hirshfield, K. Hoogsteen, J. Liesch and J. Springer, “Mevinolin: A Highly Potent Competitive Inhibitor of Hydroxymethylglutaryl-Co-En- zyme a Reductase and a Cholesterol-Lowering Age- nt,” Proceeding of the National Academy of Sciences, Vol. 77, No. 7, 1980, pp. 3957-3961. doi:10.1073/pnas.77.7.3957 [2] I. Chibata, K. Okumura, S. Takeyama and K. Kotera, “Lentinacin: A New Hypocholesterolemic Substance in Lentinus Edodes,” Experientia, Vol. 25, No. 12, 1969, pp. 1237-1238. doi:10.1007/BF01897467 [3] T. Rokujo, H. Kikuchi, A. Tensho, Y. Tsukitani, T. Ta- kenawa, K. Yoshida and T. Kamiya, “Lentysine: A New Hypolipidemic Agent from A Mushroom,” Life Sciences, Vol. 9, No. 7, 1970, pp. 379-385. doi:10.1016/0024-3205(70)90240-7 [4] Y. Kabir, M. Yamaguchi and S. Kimura, “Effect of Shii- take (Lentinus Edodes) and Maitake (Grifola Frondosa) Mushrooms on Blood Pressure and Plasma Lipids of Spontaneously Hypertensive Rats,” Journal of Nutri- tional Science and Vitaminology, Vol. 33, No. 5, 1987, pp. 341-346. [5] T. Kaneda and S. Tokuda, “Effect of Various Mushroom Preparations on Cholesterol Levels in Rats,” Journal of Nutrition, Vol. 90, No. 4, 1966, pp. 371-376. [6] S. Suzuki and S. Ohshima, “Influence of Shiitake (Len- tinus Edodes) on Human Serum Cholesterol,” Proceed- ings of the 9th International Scientific Congress on the Cultivation of Edible Fungi, Tokyo, 1974, pp. 463-467. [7] Y. Shimada, T. Morita and K. Sugiyama, “Eritadenine- Induced Alterations of Plasma Lipoprotein Lipid Con- centrations and Phosphatidylcholine Molecular Species Profile in Rats Fed Cholesterol-Free and Cholesterol-En- riched Diets,” Bioscience, Biotechnology and Biochemis- try, Vol. 67, No. 5, 2003, pp. 996-1006. doi:10.1271/bbb.67.996 [8] K. Sugiyama, A. Yamakawa, H. Kawagishi and S. Saeki, “Dietary Eritadenine Modifies Plasma Phosphatidylcho- line Molecular Species Profile in Rats Fed Different Types of Fat,” Journal of Nutrition, Vol. 127, No. 4, 1997, pp. 593-599. [9] K. Takashima, K. Izumi, H. Iwai and S. Takeyama, “The Hypocholesterolemic Action of Eritadenine in the Rat,” Atherosclerosis, Vol. 17, No. 3, 1973, pp. 491-502. doi:10.1016/0021-9150(73)90039-7 [10] K. Takashima, C. Sato, Y. Sasaki, T. Morita and S. Ta- keyama, “Effect of Eritadenine on Cholesterol Metabo- lism in the Rat,” Biochemical Pharmacology, Vol. 23, No. 2, 1974, pp. 433-438. doi:10.1016/0006-2952(74)90434-1 [11] S. R. Byrn, R. R. Pfeiffer, G. Stephenson, D. J. W. Grant and W. B. Gleason, “Solid-State Pharmaceutical Chemis- try,” Chemistry of Materials, Vol. 6, No. 8, 1994, pp. 1148-1158. doi:10.1021/cm00044a013 [12] J. Lu and S. Rohani, “Polymorphism and Crystallization of Active Pharmaceutical Ingredients (Apis),” Current Medicinal Chemistry, Vol. 16, No. 7, 2009, pp. 884-905. doi:10.2174/092986709787549299 [13] A. Hakkinen, K. Pollanen, M. Karjalainen, J. Rantanen, M. Louhi-Kultanen and L. Nystrom, “Batch Cooling Cry- stallization and Pressure Filtration of Sulphathiazole: The Influence Of Solvent Composition,” Biotechnology and Applied Biochemistry, Vol. 41, No. 1, 2005, pp. 17-28. doi:10.1042/BA20040044 [14] M. Kitamura, “Polymorphism in the Crystallization of L-Glutamic Acid,” Journal of Crystal Growth, Vol. 96, No. 3, 1989, pp. 541-546. doi:10.1016/0022-0248(89)90049-3 [15] S. Byrn, R. Pfeiffer and J. Stowell, “Solid State Chemis- try of Drugs,” 2nd Edition, SSCI, Inc., West Lafayette, 1999. [16] J. Enman, U. Rova and K. A. Berglund, “Quantification of the Bioactive Compound Eritadenine in Selected Strains of Shiitake Mushroom (Lentinus Edodes),” Jour- nal of Agricultural Food Chemistry, Vol. 55, No. 4, 2007, pp. 1177-1180. doi:10.1021/jf062559+ [17] N. J. Leonard and K. L. Carraway, “5-Amino-5-Deox- yribose Derivatives. Synthesis and Use in the Preparation of ‘Reversed’ Nucleosides,” Journal of Heterocyclic Chemistry, Vol. 3, No. 4, 1966, pp. 485-489. [18] P. A. Levene and E. T. Stiller, “Acetone Derivatives of d-Ribose. Ⅱ.,” Journal of Biological Chemistry, Vol. 106, 1934, pp. 421-429. [19] M. Kawazu, T. Kanno, S. Yamamura, T. Mizoguchi and S. Saito, “Studies on the Oxidation of ‘Reversed Nucleo- sides’ in Oxygen. I. Synthesis of Eritadenine and Its De- rivatives,” Journal of Organic Chemistry, Vol. 38, No. 16, 1973, pp. 2887-2890. doi:10.1021/jo00956a033 [20] P. H. C. Eilers, “A Perfect Smoother,” Analytical Ch- emistry, Vol. 75, No. 14, 2003, pp. 3631-3636. [21] A. Cao, A. K. Pandya, G. K. Serhatkulu, R. E. Weber, H. Dai, J. S. Thakur, V. M. Naik, R. Naik, G. W. Auner, R. Rabah and D. C. Freeman, “A Robust Method for Auto- mated Background Subtraction of Tissue Fluorescence,” Journal of Raman Spectroscopy, Vol. 38, No. 9, 2007, pp. 1199-1205. [22] R. Suryanarayanan and S. Rastogi, “Encyclopedia of Pha- rmaceutical Technology,”2006. http://informahealthcare.com/ [23] A. P. Ayala, “Polymorphism in Drugs Investigated by Copyright © 2011 SciRes. AJAC  J. ENMAN ET AL. Copyright © 2011 SciRes. AJAC 173 Low Wavenumber Raman Scattering,” Vibrational Spec- troscopy, Vol. 45, No. 2, 2007, pp. 112-116. doi:10.1016/j.vibspec.2007.06.004 [24] S. D. Clas, “The Importance of Characterizing the Crystal Form of the Drug Substance During Drug Development,” Current Opinion in Drug Discovery and Development, Vol. 6, No. 4, 2003, pp. 550-560. [25] E. Fukuoka, M. Makita and Y. Nakamura, “Glassy State of Pharmaceuticals. 5. Relaxation During Cooling and Heating of Glass by Differential Scanning Calorimetry,” Chemical and Pharmaceutical Bulletin, Vol. 39, No. 8, 1991, pp. 2087-2090. [26] P. Tong and G. Zografi, “Solid-State Characteristics of Amorphous Sodium Indomethacin Relative to Its Free Ac- id,” Pharmaceutical Research, Vol. 16, No. 8, 1999, pp. 1186-1192. [27] L. Yu, “Amorphous Pharmaceutical Solids: Preparation, Characterization and Stabilization,” Advanced Drug De- livery Reviews, Vol. 48, No. 1, 2001, pp. 27-42. doi:10.1016/S0169-409X(01)00098-9 [28] B. C. Hancock and M. Parks, “What Is the True Solubil- ity Advantage for Amorphous Pharmaceuticals?,” Phar- maceutical Research, Vol. 17, No. 4, 2000, pp. 397-404. doi:10.1023/A:1007516718048 [29] T. Vasconcelos, B. Sarmento and P. Costa, “Solid Dis- persions as Strategy to Improve Oral Bioavailability of Poor Water Soluble Drugs,” Drug Discovery Today, Vol. 12, No. 23-24, 2007, pp. 1068-1075. doi:10.1016/j.drudis.2007.09.005 [30] J. Enman, K. Ramser, U. Roval and K. A. Berglund, “Ra- man Analysis of Synthetic Eritadenine,” Journal of Raman Specroscopy, Vol. 39, No. 10, 2008, pp. 1464-1468. [31] Y. Huang, J. Komoto, Y. Takata, D. Powell, T. Gomi, H. Ogawa, M. Fujioka and F. Takusagawa, “Inhibition of S-Adenosylhomocysteine Hydrolase by Acyclic Sugar Adenosine Analogue D-Eritadenine-Crystal Structure of S-Adenosylhomocysteine Hydrolase Complexed with D-Eritadenine,” Journal of Biological Chemistry, Vol. 277, No. 9, 2002, pp. 7477-7482. doi:10.1074/jbc.M109187200 [32] S. R. Vippagunta, H. G. Brittain and D. J. W. Grant, “Crystalline Solids,” Advanced Drug Delivery Reviews, Vol. 48, No. 1, 2001, pp. 3-26. doi:10.1016/S0169-409X(01)00097-7 [33] A. Nangia and G. R. Desiraju, “Pseudopolymorphism: Occurrences Of Hydrogen Bonding Organic Solvents in Molecular Crystals,” Chemical Communications, No. 7, 1999, pp. 605-606. doi:10.1039/a809755k
|