Technology and Investment
Vol.3 No.1(2012), Article ID:17458,10 pages DOI:10.4236/ti.2012.31005
The Impact of Adoption of Flexible Manufacturing Technology on Price Cost Margin of Malaysian Manufacturing Industry
1International Graduate School of Business, University of South Australia, Adelaide, Australia
2Faculty of Management, Multimedia University, Cyberjaya, Malaysia
Email: dadol@ou.ac.lk, absade@mmu.edu.my
Received November 14, 2011; revised December 14, 2011; accepted December 22, 2011
Keywords: Flexible Manufacturing Technology; Price Cost Margin; Mass Customisation
ABSTRACT
This paper explores the impact of the adoption of Flexible Manufacturing Technology (FMT) on the Malaysian Manufacturing Industry. The Principal Component Analysis has been adopted to extract the most appropriate underlying dimensions of FMT to use in place of the eight FMT variables owing to the potential multicollinearity. The study has been conducted within FMT intensively adopted 16 three-digit industries that encompass 50 five-digit industries covering the years 2000-2005. The results obtained from the two scenarios, one, including the industry fixed effects dummy variables and the other without these, are contrasted. It is established that the model that included the industry fixed effect dummy variables has a greater explanatory power. The two principal components that account for the greater variation in FMT show positive and moderately significant relationship with PCM. The study provides sufficient evidence to conclude that FMT has a direct and moderately significant relationship with PCM.
1. Introduction
It is widely accepted that FMT has the potential to bring about impressive cost savings while at the same time affording facilities to manufacture high quality products. In today’s highly competitive world, a customer not only expects quality, reliability and competitive pricing but also customised products with timely delivery [1]. FMT refers to computer-based manufacturing technologies that make automation programmable rather than fixed. When fully developed, FMT organizations use the computer to integrate the functional areas of marketing, design, manufacturing, inventory control, materials handling and quality control into a continuous, sometimes unattended, round-the-clock operation. Actual installations today range from single, flexible manufacturing machining systems to “islands of automation” to fully computer-integrated manufacturing (CIM) operations [2]. The ability to alter the production of diverse products rapidly can provide manufacturers with a distinct competitive advantage. Companies adopting FMT rather than conventional manufacturing technology can react more quickly to market changes, provide certain economies, enhance customer satisfaction and increase profitability. FMT affords manufacturing flexibility that comprises three components: 1) the flexibility to produce a variety of products using the same machines and to produce the same products on different machines; 2) the flexibility to produce new products on existing machines; and 3) the flexibility of the machines to accommodate changes in the design of products. The ability to alter the production of diverse products rapidly can provide manufacturers with a distinct competitive advantage. Firms adopting FMT rather than conventional manufacturing technology can react more quickly to market changes, provide certain economies, enhance customer satisfaction and increase profitability. FMT is sometimes referred to in literature as high technology or high tech.
Nonetheless, the degree to which such potential benefits have been derived and reflected in the market performance has not been adequately explored. The review of literature shows empirical studies on FMT have been carried out in the following areas; types of flexibility, types of FMT, procedure bias on investment appraisal of FMT, operational problems, market structure and competitiveness. However, it is observed that the influence of FMT adoption on the competitiveness of the Malaysian manufacturing industry has not been adequately explored to give conclusive findings. The extant empirical studies have revealed that due to the potential operational problems of FMT implementation, derivation of potential benefits of FMT might be impeded [3-5]. MoreoverSlagmulder and Bruggemen [6] and Fine and Freund [7] showed that due to the “procedure bias on investment appraisal of FMT, investments in FMT” did not take place smoothly or effectively. Sinha and Noble [8] found strong support for the research hypothesis: Adoption of advanced manufacturing technologies (i.e. those that changed competitive dynamics in the industry) was a significant predictor of survival. Hence, there is a necessity for further studies that focus on measurement of FMT contribution towards the profitability in the manufacturing industry.
In the Malaysian manufacturing industry, FMT is widely adopted and has received the due attention from the industry policy makers. The Malaysian Industrial Development Authority (MIDA) [9] has recognised a number of promoted activities and products (for development and production) with regard to high technology establishments. The engagement in these activities will make them entitled to pioneer status or investment tax allowance under the promotion of Investment Act 1986. This includes FMT products such as, computer process control systems/equipment, process instrumentation and robotic equipment and computer numerical control machine tools. The Ninth Malaysia Plan which is aimed at achieving changes in the structure and improved performance of the economy with every economic sector achieving higher value added and total factor productivity. The “Thrust 1” of this plan states that, “Application of high technology and production of higher value added products will be given emphasis. Measures will be undertaken to migrate the electrical and electronics (E & E) industry towards high-technology and higher value added activities”.
It is known that adherence to intensive regimes of contemporary manufacturing paradigms namely mass customisation, customerisation and instant customerisation is essential to stay competitive in the manufacturing industry. The studies show that mass customisation is the core manufacturing paradigm. The studies also showed that the crucial determinant of the successful implementation of mass customisation is the abundant use of Flexible manufacturing Technology (FMT) [10,11].
There are three widely adopted measures of competitiveness namely productivity technical efficiency and profitability. Both productivity and technical efficiency provide insights into particular facets of the competetiveness of the manufacturing industry but do not reflect the profitability within industries. Invariably these measures adopt value of “all assets” as that of the capital due to non availability of segregated data for land, building and machinery. Since this value is always very large and changes in the value of “all assets” due to machinery alone may not be discernible, a measure devoid of capital is needed to be incorporated in the study. Besides, sustainability of a particular industry depends mostly on the industry profitability and so a measure capable of evaluating this dimension of manufacturing industry should also be incorporated in any study that focuses on manufacturing industry competitiveness. When a new and cost efficient technology such as FMT emerges, the first to grab such technology are the top performing firms followed by the others. With the passage of time, once all the firms could gain access to the FMT, the advantage the top performing firms enjoyed purely due to adoption of FMT diminishes and as a result the profit margin of a unit product would squeeze. However, due to factors such as lowering of product prices, more customised products and larger assortments of models from the same products, new custromers would be attracted to the market. This results in a situation where the sales volume has increased without commensurate additional costs to the firm. Therefore, owing to the economies of scale, Industry-wide PCM could change in response to the degree of adoption of FMT. Hence, it is rational to anticipate that profit within a particular industry would increase despite squeezing unit profits.
Evidently, only a few studies have examined the impact of specific technologies on the industry level profitability using less aggregated data. Berndt and Morrison [12] examined the impact of high-tech investments on profitability using three profitability measures. The study found a significant and negative relationship between profitability and the share of high-tech capital in the total physical capital stock. Amato and Amato [13] investtigated the impact of high-tech investments on Price Cost Margin. Okada [14] adopts PCM to measure the product market competition on productivity in Japanese manufacturing industries. Hence, this study adopts price cost margin (PCM) which has the ability of addressing both these requirements.
This study established that prior findings of a negative relationship between profitability and high-tech might result from omitting industry fixed effect dummy variables (to account for the differences in technological opportunity among industries) from regression models.
Berndt and Morrison [12] found limited evidence of a positive relationship between profitability and the share of high-tech capital in the total physical capital. Amato and Amato [13] established a negative and significant relationship between the price cost margin and high-tech methods when industry fixed variable was excluded; relationship became insignificant when industry fixed variable was included. Hence there is a need for a separate study that incorporates differences in technologies considered, differences in the industries considered, differences in countries considered and the differences in the explanatory variables considered.
The main aim of this empirical study is to investigate the impact of FMT adoption on PCM in selected manufacturing industries of Malaysia. The study developed inclusion criteria to identify industries in which FMT is intensively adopted. As such 16 three-digit industries have been selected which consist of 50 five-digit industries. The study depends on the Annual Surveys of Manufacturing Industries (ASMI) during 2000-2005 and Economic census data maintained by the Department of Statistics Malaysia (DOS), for the secondary data [15]. The present study, unlike prior similar studies that have been conducted at the four-digit level, is carried out at the five-digit level. Also the present study contributes to the previous studies by considering less aggregated data and also by considering PCM being computed using data obtained from ASMI.
This study also takes into consideration a higher number of specific FMT variables such as, Computer Numerical Control Machine Tools (CNC), Numerical Controlled Machine Tools (NC), Robotics (ROB), Programmable Logic Controllers (PLC), Automated Inspections (INS), Automated Storage and Retrieval Systems (ASR), Computer Aided Design (CAD) and Local Area Networks (LAN). In order to overcome multicollinearity among FMT variables, the study extracts three underlying dimensions of FMT by adopting Principal Component Analysis. They are namely; “process control” technologies, “production and quality control” technologies and “general control” technology. The study adopts a questionnaire survey to compute the degree of adoption of FMT among the selected 50 five-digit industries. The present study considers eight types of FMT instead of five specific technologies, evidently the maximum number considered in a prior study. The study covers only six years from 2000 to 2005 due to the limitation of data availability.
2. Methodology
The basic research hypothesis of the study is: A high degree of FMT adoption enhances PCM of the manufacturing industry of Malaysia.
2.1. Estimation of FMT
The methodology of this study comprises two stages. The first stage is to compute PCM for all the industries considered in the sample. The second stage is to identify the explanatory variables of PCM. The PCM approach to measuring profitability is widely adopted in the manufacturing industry. Siraz [16], Go, Kamerschen and Delorme [17], Yean [18] and Lee [19] adopted PCM to measure profitability. Collins and Preston [20] defined PCM as the percentage gross return (before taxes) on sales. Also PCM can be defined as the difference between price (p) and marginal cost (mc) as a fraction of price that is . The price cost margin is usually taken as an indicator of market power which means the ability of buyers or sellers to exert influence over the price or quantity of a good, service, or commodity exchanged in a market. Siraz [16] and Round [21] in their investigation to the influence of major market structure elements on performance in manufacturing industries in the United Kingdom and Australia respectively, used PCM to measure the competitiveness. The formula of PCM i.e.
  can be expanded and presented in Equation 1 in order to measure PCM industry-wise:
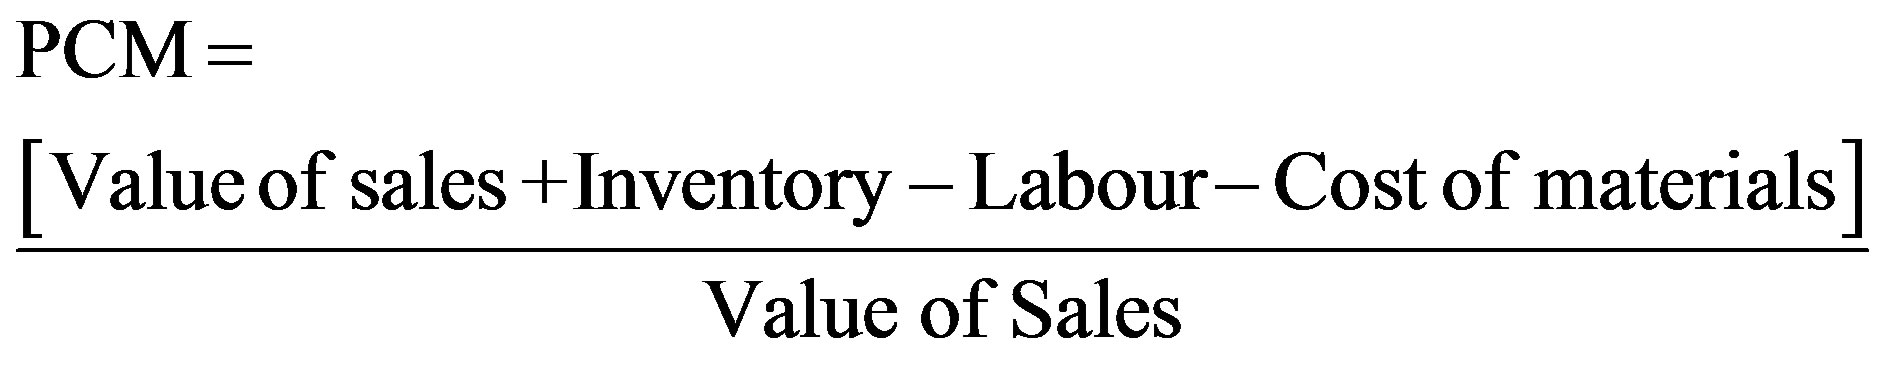 (1)
(1)
In a study, Go, Kamerschen and Delorme [17] used PCM to measure the profitability of Philippine manufacturing industry where the explanatory variables were sellers’ concentration, capital output ratio, industry growth rate, import share, export share and degree of foreign participation. Lee [19] adopted PCM to measure the profitability in his study on Determinants of Cyclical Properties of PCM in Manufacturing Industries of the US. Yean [18] too used PCM to measure profitability in his empirical study on the Market Structure and Performance in Korean Manufacturing Industries. Berndt and Morrison [12] and Amato and Amato [13] used PCM to measure the impact of High-Tech Investments on competetiveness.
2.2. Factors Affecting PCM in the Manufacturing Industry
Growth Rate of Output (GRO): It is logical to expect that output growth can lead to higher factor productivity growth because it affords the “economies of scale” advantage. As output grows, capacity utilisation is bound to increase leading to a fall in the average cost. Therefore, it is rational to postulate a positive relationship between output growth and PCM. Yean [18], Lee [19], Round [21], Amato and Amato [13], Go, Kamerschen and Delorme [17] and Shiraz [16] considered GRO as an explanatory variable of PCM. GRO was measured as the increase in output between two consecutive years divided by the output of the previous year. The value of output for each MSIC five-digit industry was obtained from ASMI and deflated using GDPD.
Industry Concentration (CR4): Oligopoly theory explains that the higher the level of concentration, the more likely it is that the dominant firms will be able to collude, tacitly or expressly, to raise prices above the long run average costs [16]. Therefore, it is reasonable to include this variable in the PCM models as it can affect the profitability in a given industry. Industry concentration is widely expressed in terms of four-firm concentration ratio (CR4) i.e. sales of the four largest firms divided by the total sales in an industry. Lee [19], Yeaoon [18] and Amato and Amato [13], Shiraz [16], Go, Kamerschen and Delorme [17], Round [21] consider CR4 as an explanatory variable of PCM. In this study, CR4 was measured as the percentage of industry sales contributed by the four largest firms in each MSIC five digit industry for each year. The figures for CR4 are not published annually in Malaysia, so these figures were worked out using the data obtained from the Economic census data maintained by the DOS.
Capital Intensity (CAPIN): It is rational to expect that capital-intensive industries offer more scope for technological progress and learning by doing and thereby influencing their profitability. However, the efficiency of capital intensity is more likely to depend on the availability of efficient infrastructure. Therefore, the direction of the relationship is contentious. The researchers Amato and Amato [13], Lee [19], Go, Kamerschen and Delorme [17], Round [20] and Shiraz [16] considered CAPIN as an explanatory variable of PCM. A significant variability could be observed among the researchers in their approach to quantifying CAPIN. Sharma [3] defined it as Fixed Capital divided by Total Employment. Goldar and Kumari [22] used the ratio of Investment to Capital. Leung [23], McGuckin and Streitwieser [24] and Mahadevan [25] used the capital labour ratio, measured as the capital per employee. Amato and Amato [13] defined capital intensity as the value of shipment divided by capital stock. In the present study, CAPIN was measured by the value of assets divided by the total number of employees. The data required for this computation were obtained from ASMI.
Advertisement Intensity (ADV): Advertising helps to make a product and its characteristics known to the public and as a result industry sales are bound to increase. Yoon [18] in his PCM study in Korea has considered ADV as an explanatory variable having a positive relationship with PCM. In this study ADV was measured by the total expenditure on advertisement divided by the total sales. However, ADV is not published annually and so is computed using the industry-wise data obtained from the Economic Census data maintained by the DOS.
Export Intensity (EXP): Export Intensity can lead to higher productivity due to a number of reasons namely, opportunity for greater capacity utilisation, particularly in industries in which the minimum efficient size of plant is large relative to the domestic market; greater horizontal specialisation as each firm concentrates on a narrow range of products; and increasing familiarity with and absorption of new technologies [3]. Moreover, with foreign exchange earned from export growth, firms would have better access to imported inputs and new technology the effects of which can evidently enhance profitability. Yean [18] considered EXP as an explanatory variable of PCM. In the present study, EXP was measured as the ratio of the value of manufactured exports to the total sales. The “value of export” data were obtained from the unpublished Economic Census data maintained by the DOS.
The eight types of FMT considered in this study are given below:
• Computer Numerical Control Machine Tools (CNC): Measured as the percentage of firms in each MSIC five-digit industry using microprocessor based numerical control technologies, referred to as computer numerical control machine tools.
• Numerical Controlled Machine Tools (NC): Measured as the percentage of firms in each MSIC fivedigit industry using numerical controlled machine tools.
• Robotics (ROB): Measured as the percentage of firms in each MSIC five-digit industry using robotics.
• Programmable Logic Controllers (PLC): Measured as the percentage of firms in each MSIC five-digit industry using programmable logic controllers.
• Automated Inspections (INS): Measured as the percentage of firms in each MSIC five-digit industry using automated sensor-based inspection, either during the production process or final product.
• Automated Storage and Retrieval Systems (ASR): Measured as the percentage of firms in each MSIC five-digit industry using automated storage and retrieval systems.
• Computer Aided Design (CAD): Measured as the percentage of firms in each MSIC fivedigit industry using computer aided design to control manufacturing machinery.
• Local Area Networks (LAN): Measured as the percentage of firms in each MSIC five-digit industry using local area networks.
Industry Fixed Effects Dummy Variables (INDj): The study involved 50 five-digit industries included in 16 three-digit industries. It is logical to assume that industry characteristics among these 16 three-digit industries can be diverse and need to be captured by a variable. Therefore, 16 dummy variables (INDj) were incorporated into the PCM model to capture industry fixed effects. However, most contemporary researchers have not considered industry fixed effects in the PCM model. While Mahadevan [26] and Amato & Amato [13] have incorporated industry fixed effect dummy variables, Goldar & Kumari [21], Yean [27], Leung [23] and Sharma [3] in their similar studies, have not made any reference to industry fixed effects, let alone considering them in their models.
The model representing the relationship among PCM, explanatory variables and FMT variables can be specified and shown below in Equation (2).
Price Cost Margin Model
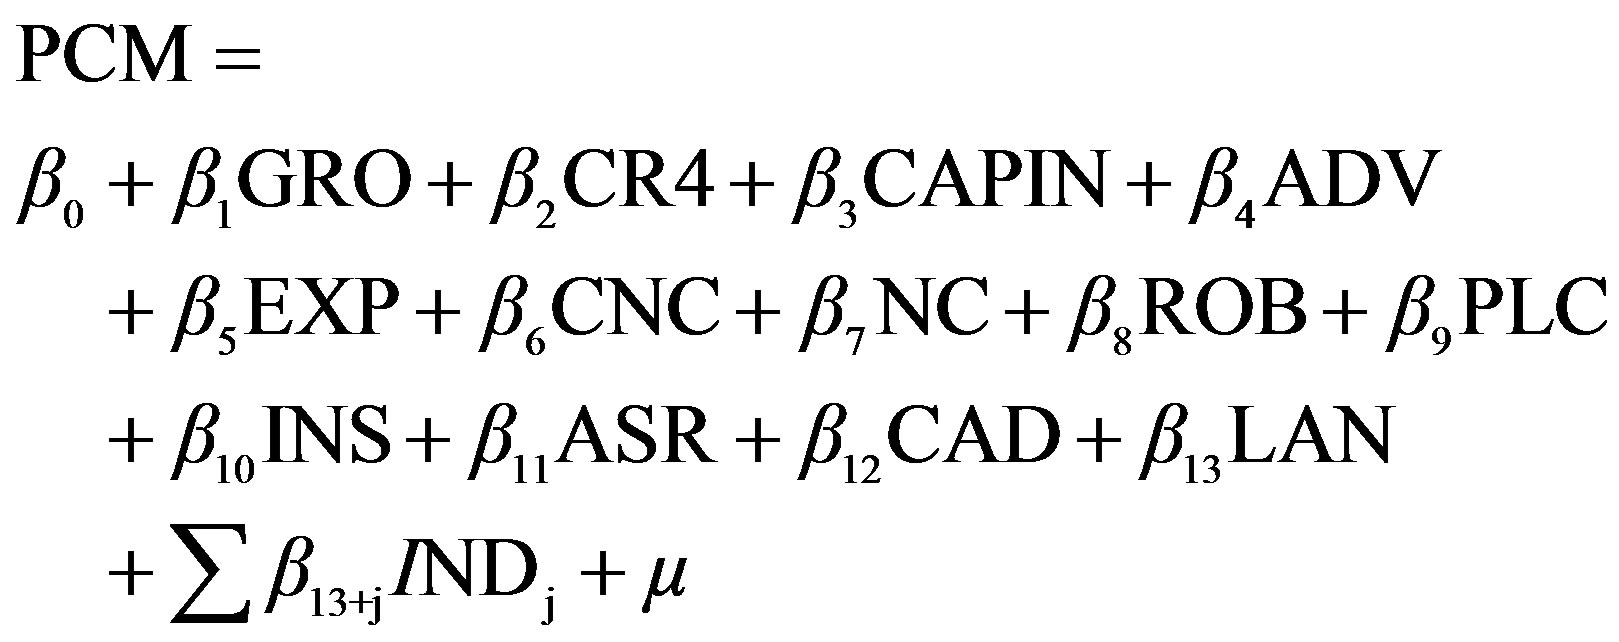 (2)
(2)
3. Data and Estimation
3.1. Inclusion Criteria
According to the Malaysian Standard Industrial Classification 2000 (MSIC 2000), there are 53 three-digit industries [15]. In order to obtain a rational outcome, the study needs to be conducted only within industries in which FMT is intensively adopted. On account of this, inclusion criteria were formulated in an effort to select FMT intensively adopted MSIC three-digit industries for the sample, which is shown below:
Industries with high “capital/labour” ratio;
Industries in which product features need to be varied as a marketing strategy;
Industries in which demand for products are susceptible to fluctuation.
The “capital/labour” ratios for all 53 three-digit Industries were tabulated after computing them as the ratio of total value of assets to the total number of employees. The questionnaire carried two separate questions: one question sought the response of each firm regarding the degree to which product features need to be varied as a marketing strategy; another sought the response of each firm regarding the degree to which demand for products are susceptible to fluctuation. Using these responses that were indicated on a Likert scale, two separate values were computed for either criterion for each industry. After careful evaluation of the values obtained for the three criteria, a sample of 16 MSIC three-digit industries which together comprised 50 five-digit industries was selected.
3.2. Data
3.2.1. Primary Data
The data that indicate the degree of adoption of FMT is not published by any organisation in Malaysia. Hence, a questionnaire survey was conducted to gather information necessary to compute the percentage of establishments adopting each specific type of FMT in a given year, within a given MSIC five-digit industry. The questionnaires were sent to all the establishments listed under the 50 MSIC five-digit industries, in the directory of Federation of Malaysian Manufacturers (FMM) [28].
3.2.2. Secondary Data
In order to compute PCM, industry-wise data is required for output, intermediate input, capital input and labour input. The closest indicators for these values were obtained from Table 3 of the ASMI published for the years 2000 through 2005 by the DOS of Malaysia. The variables GRO and CAPIN were computed using the data obtained from Table 3. EXP, CR4 and ADV were computed using the data obtained from the Economic Censes conducted by the DOS Malaysia.
4. Empirical Results
4.1. Multicollinearity of FMT
Since only FMT intensively used industries were included in the sample, naturally some similarity in the sequence and characteristics of the production processes could be expected even amongst different five-digit industries. Hence, there could be a tendency for a similarity in the technology adopted amongst these industries. Due to the similarities in technologies, a high prevalence of multicollinearity among the eight types of FMT could be anticipated. In this study, bivariate Pearson productmoment correlation analysis has been conducted using SPSS to test for multicollinearity amongst FMT. The output that reveals potential multicollinearity among FMT variables is displayed in Table 1. According to Coakes, Steed and Price [29] and Field [30], when a considerable number of correlations are exceeding 0.3, the matrix is suitable for Principal Component Analysis (PCA).
PCA was adopted using SPSS in order to obtain underlying dimensions (Principal Components) of FMT as a remedy for multicollinearity. As per both standard methods (i.e. screen test and eigen values greater than one) of extracting the optimal number of components, three Principal Components (PCs) were extracted that account for 67 percent of the variation in the FMT. According to Table 2, the loadings of variables onto three PCs obtained from both types of rotations (Orthogonal and Oblique) are quite similar. Hence, due to simplicity, PCs obtained from orthogonal rotation was used in the rest of the analysis.
Once the most appropriate type of rotation and the resultant PCs were decided, the variables loading onto each of these PCs were examined as the next step. An examination of the component loadings depicted in Table 2 indicates that LAN, CAD, PLC and CNC load onto PC1; ASR, INS and ROB load onto PC2 while only NC loads onto PC3. Usually it is difficult to give clear cut themes or names to PCs that only relate to or encompass particular variables that are loading onto it. Hence, only the best possible names have been assigned to the PCs extracted from this analysis. The technologies LAN, CAD, PLC and CNC are used in the manufacturing set up as process
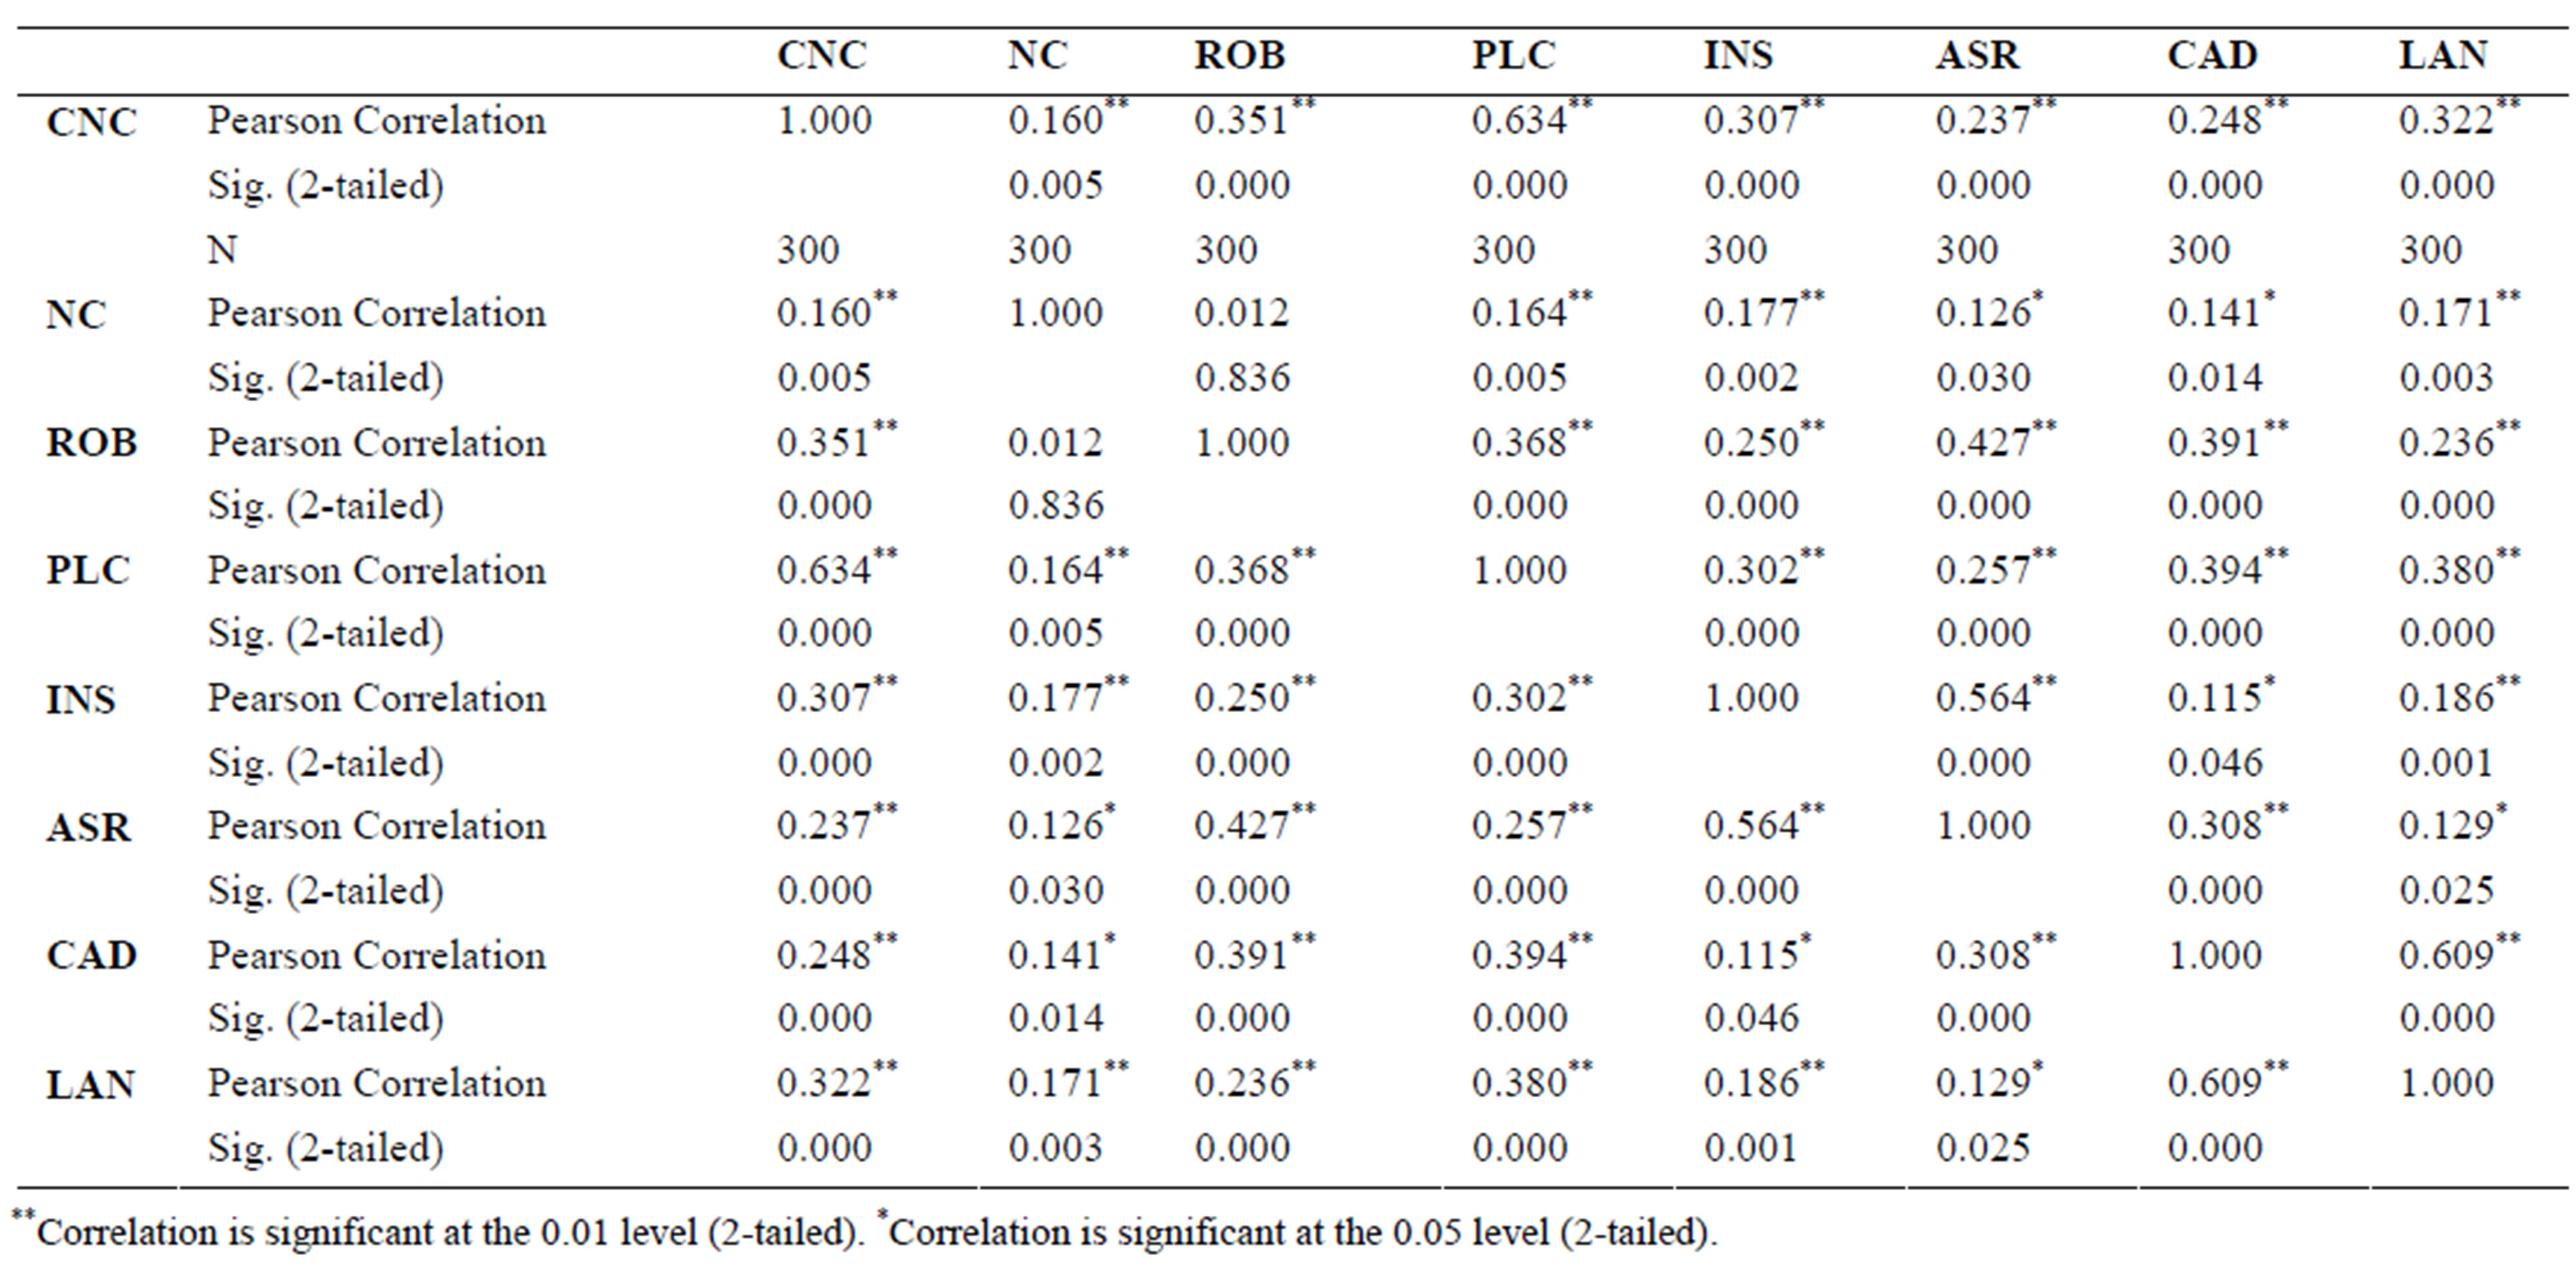
Table 1. Correlations among FMT.
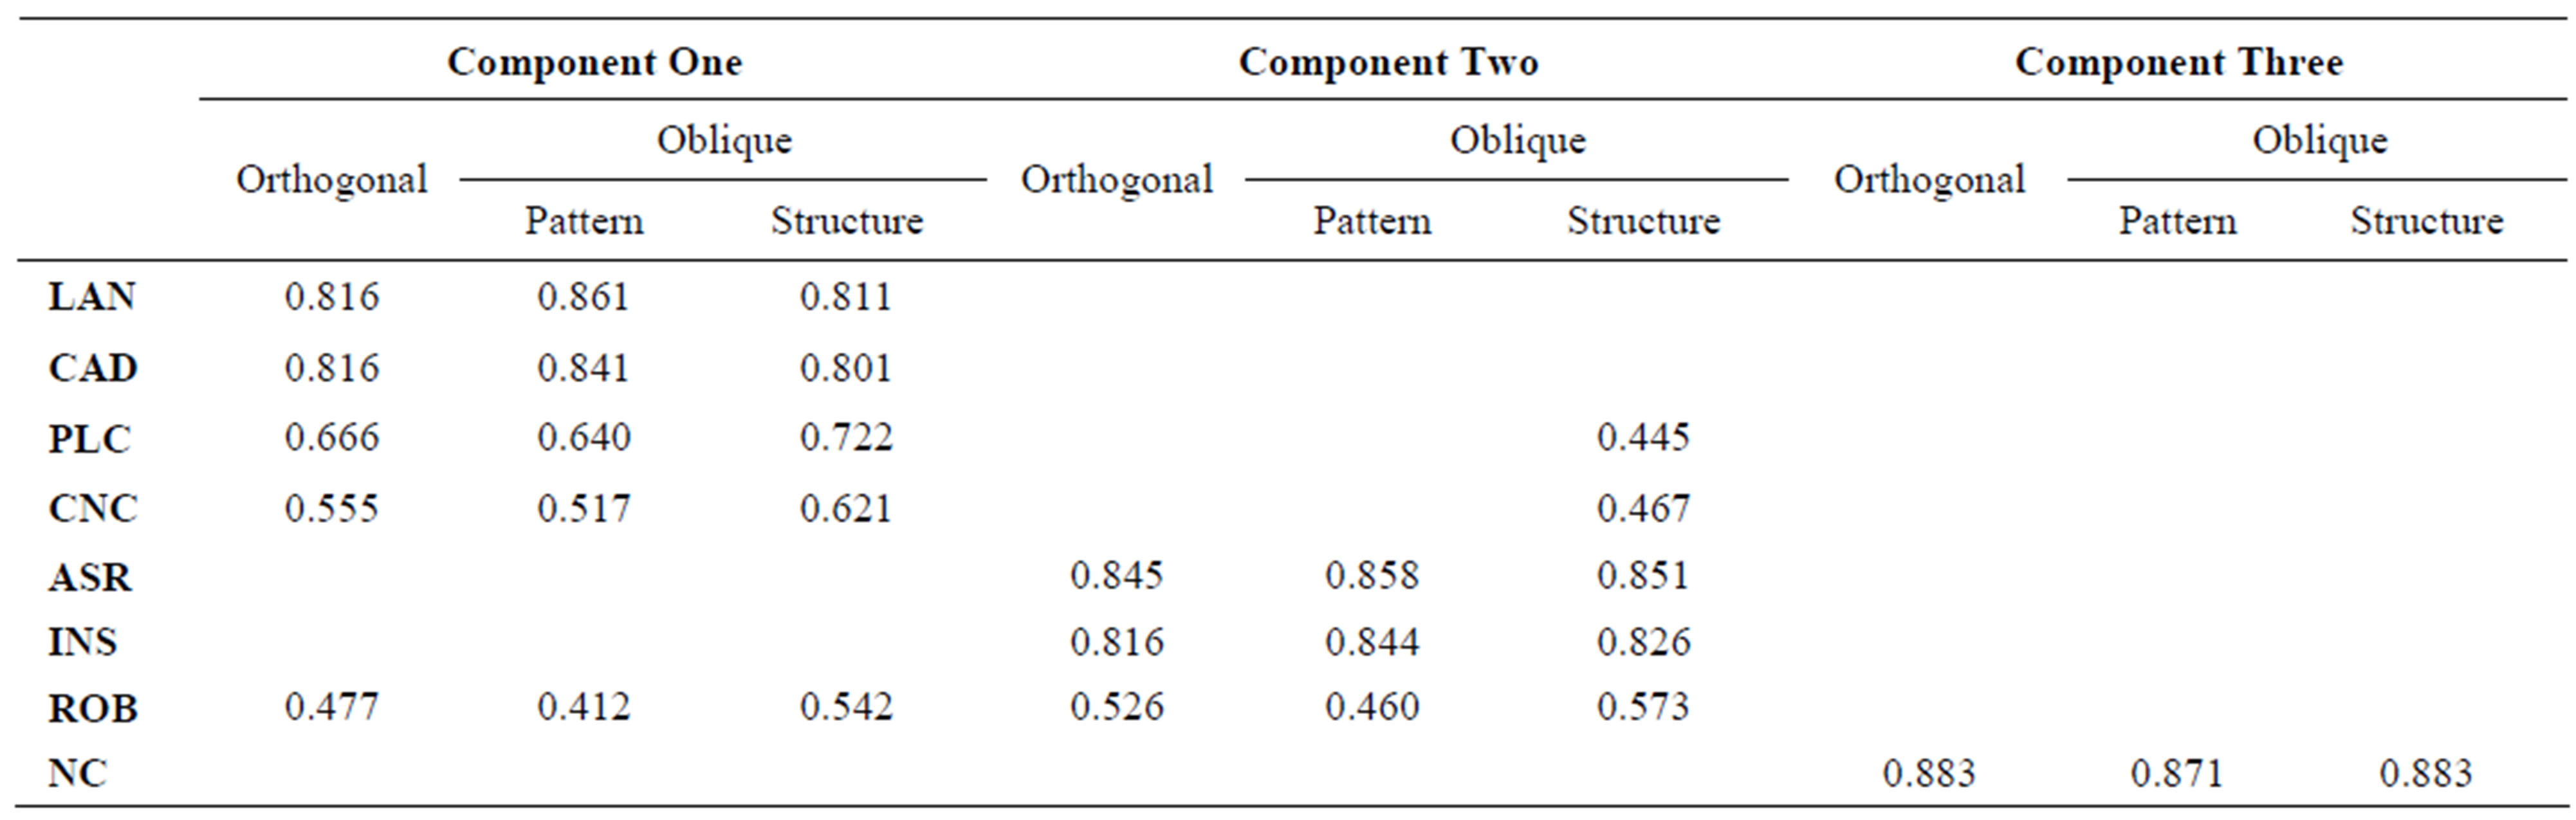
Table 2. Comparison of components obtained from two types of rotations.
control technologies. Since these load onto PC1, they can be named as “process control” technologies. The technologies ASR, INS and ROB load onto PC2, so can be named as “production and quality control” technologies. PC3 has only one variable i.e. NC, loading onto it so can be called the “general control” technology.
As the next step, the eight FMT variables were substituted with the three PCs namely, PC1, PC2 and PC3. Therefore, the PCM model was reformulated and presented in Equation (3) below (the changes in PCs are considered here to be consistent with PCM which too is measured as a change):
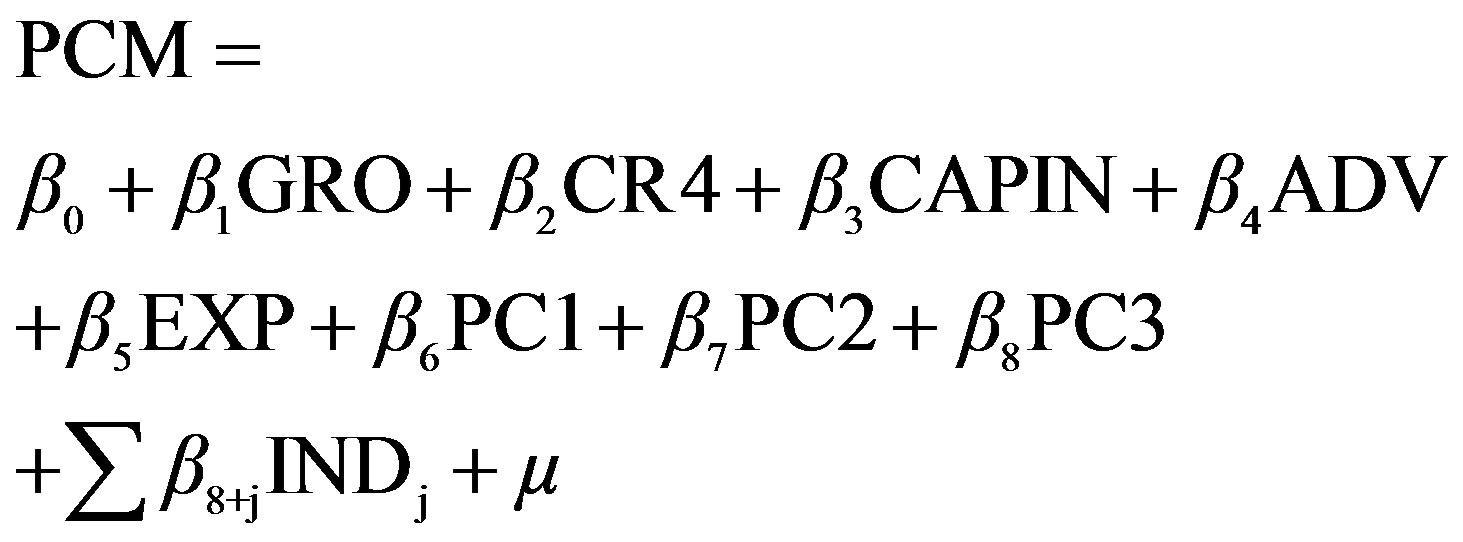 (3)
(3)
4.2. Multiple Regression Analysis of PCM
As described, the model contains a set of 16 industry fixed dummy variables (INDj) to account for the differences of technological opportunity among industries. Although it is theoretically desirable to include INDj, the consequent impact of adding these 16 extra variables needs to be examined by comparing and contrasting the results obtained without considering the INDj in the model. A separate regression was performed for this scenario and the tables of Model Summary, ANOVA and Coefficients were obtained. In order to facilitate easy comparison of the results, the tables of output obtained from regression analysis for the two situations, one with the INDj included and the other without the INDj have been combined into one.
The tables of Model Summary, ANOVA and Coefficients contained in the SPSS output have been reproduced in Tables 3-5 respectively. According to the Model Summary, Adjusted R square is 0.367. This indicates that explanatory variables in the model have the ability to explain 36.7 percent of the variance in PCM.
According to ANOVA, the F statistics (8.534) is much larger than the critical values of the F distribution, obtainned from the F distribution calculator for α = 0.05 level of significance for the situations of Indj excluded (1.97) and Indj excluded (1.57).
H0: β1 + β2 + β3 = … βk = 0 H1: Not all the βi (i= 1,2,…,24) are zero.
As the F statistic is in the rejection region, H0 was rejected and H1 was accepted. Since “p < 0.000” it can be concluded that there is strong evidence of PCM having a linear regression relationship with any of the explanatory variables in the model with a probability of less than 0.1 percent of making an error in this conclusion.
4.3. INDj Included
According to Table 5, CAPIN (0.000) is very highly significant at “p < 0.001”. This implies that the chances of making an error by assuming that this variable correlates with PCM is less than 0.1 percent. While GRO (0.002) is highly significant at “0.001 < p < 0.01”, EXP (0.038) is significant at “0.01 < p < 0.05”. All variables CAPIN, GRO and EXP are positively correlated. While ADV (0.072) is moderately significant at “0.05 < p < 0.1” and positively correlated, CR4 (0.13) is marginally significant at “0.1 < p < 0.15” and negatively correlated. Since the main focus of the study is to test the significance of the correlation of FMT with PCM, an examination of the correlation of the three PCs with PCM becomes necessary. Both PC1 (0.069) and PC2 (0.098) are moderately significant at “0.1 < p < 0.05” and display positive correlation with PCM. However, PC3 is highly insignificant and shows a negative relationship.
4.4. INDj Excluded
According to the output of the model that excluded the INDj, the significance of explanatory variables, GRO, CR4, CAPIN, ADV, EXP, PC1, PC2 and PC3 are, 0.001, 0.001, 0.632, 0.000, 0.007, 0.125, 0.032, 1.000 and 0.671
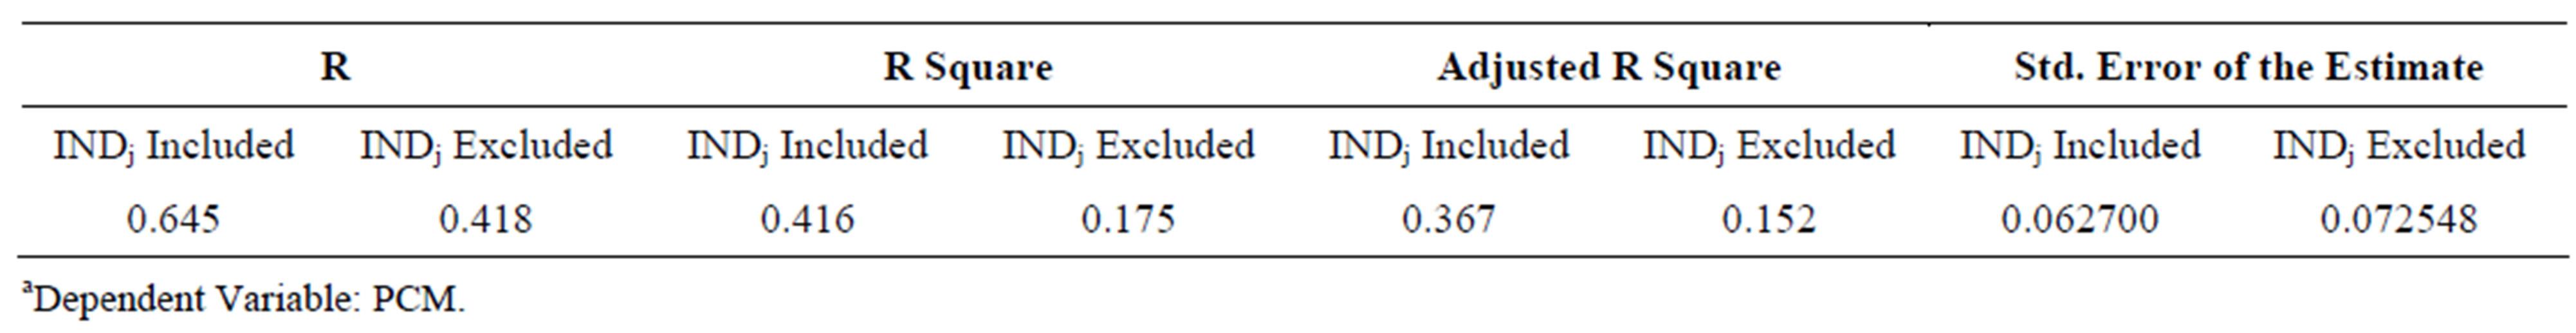
Table 3. Model summarya.
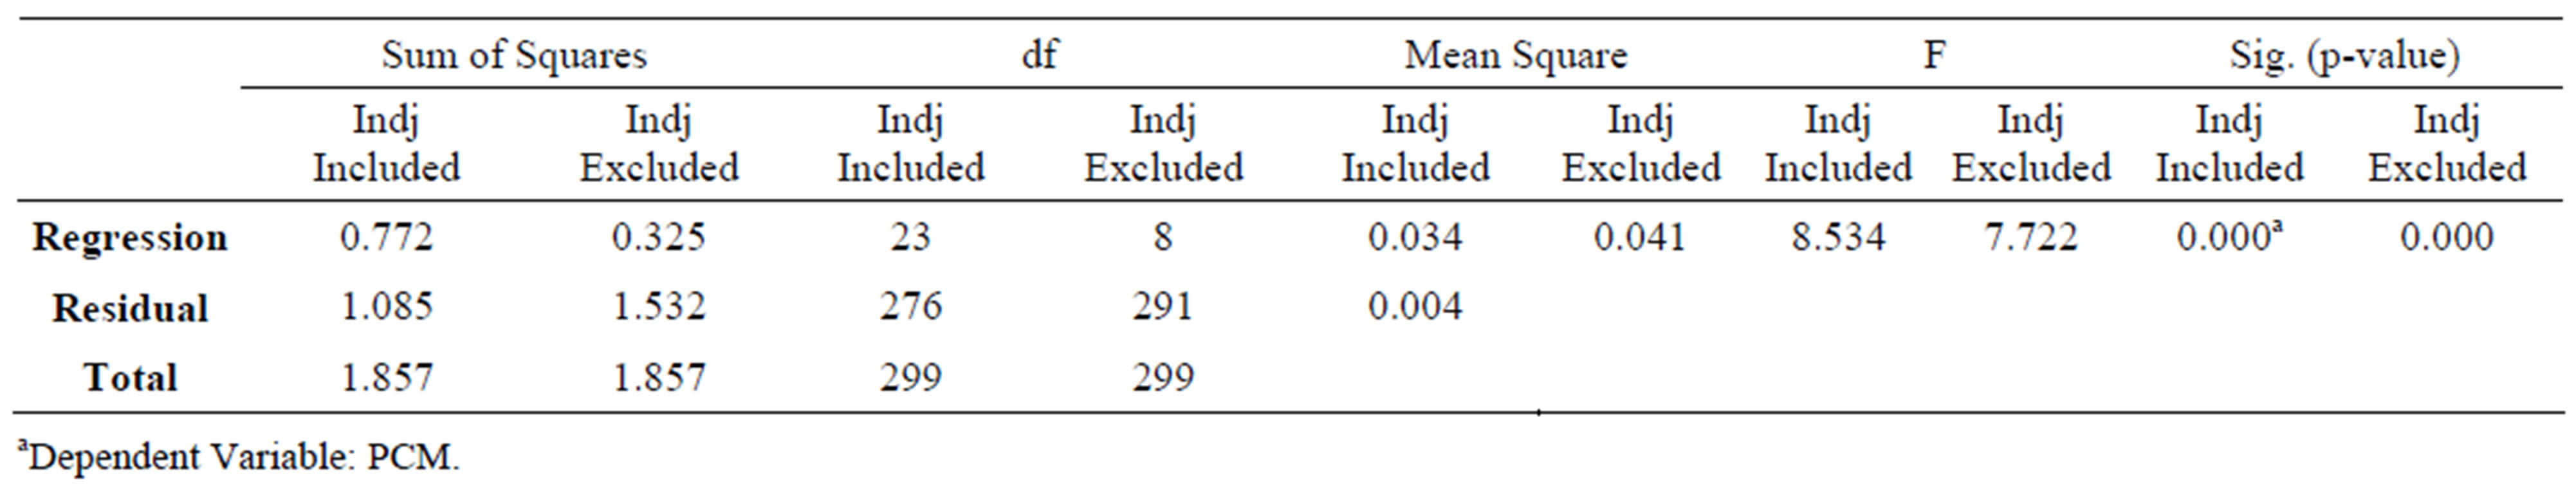
Table 4. Anovaa.
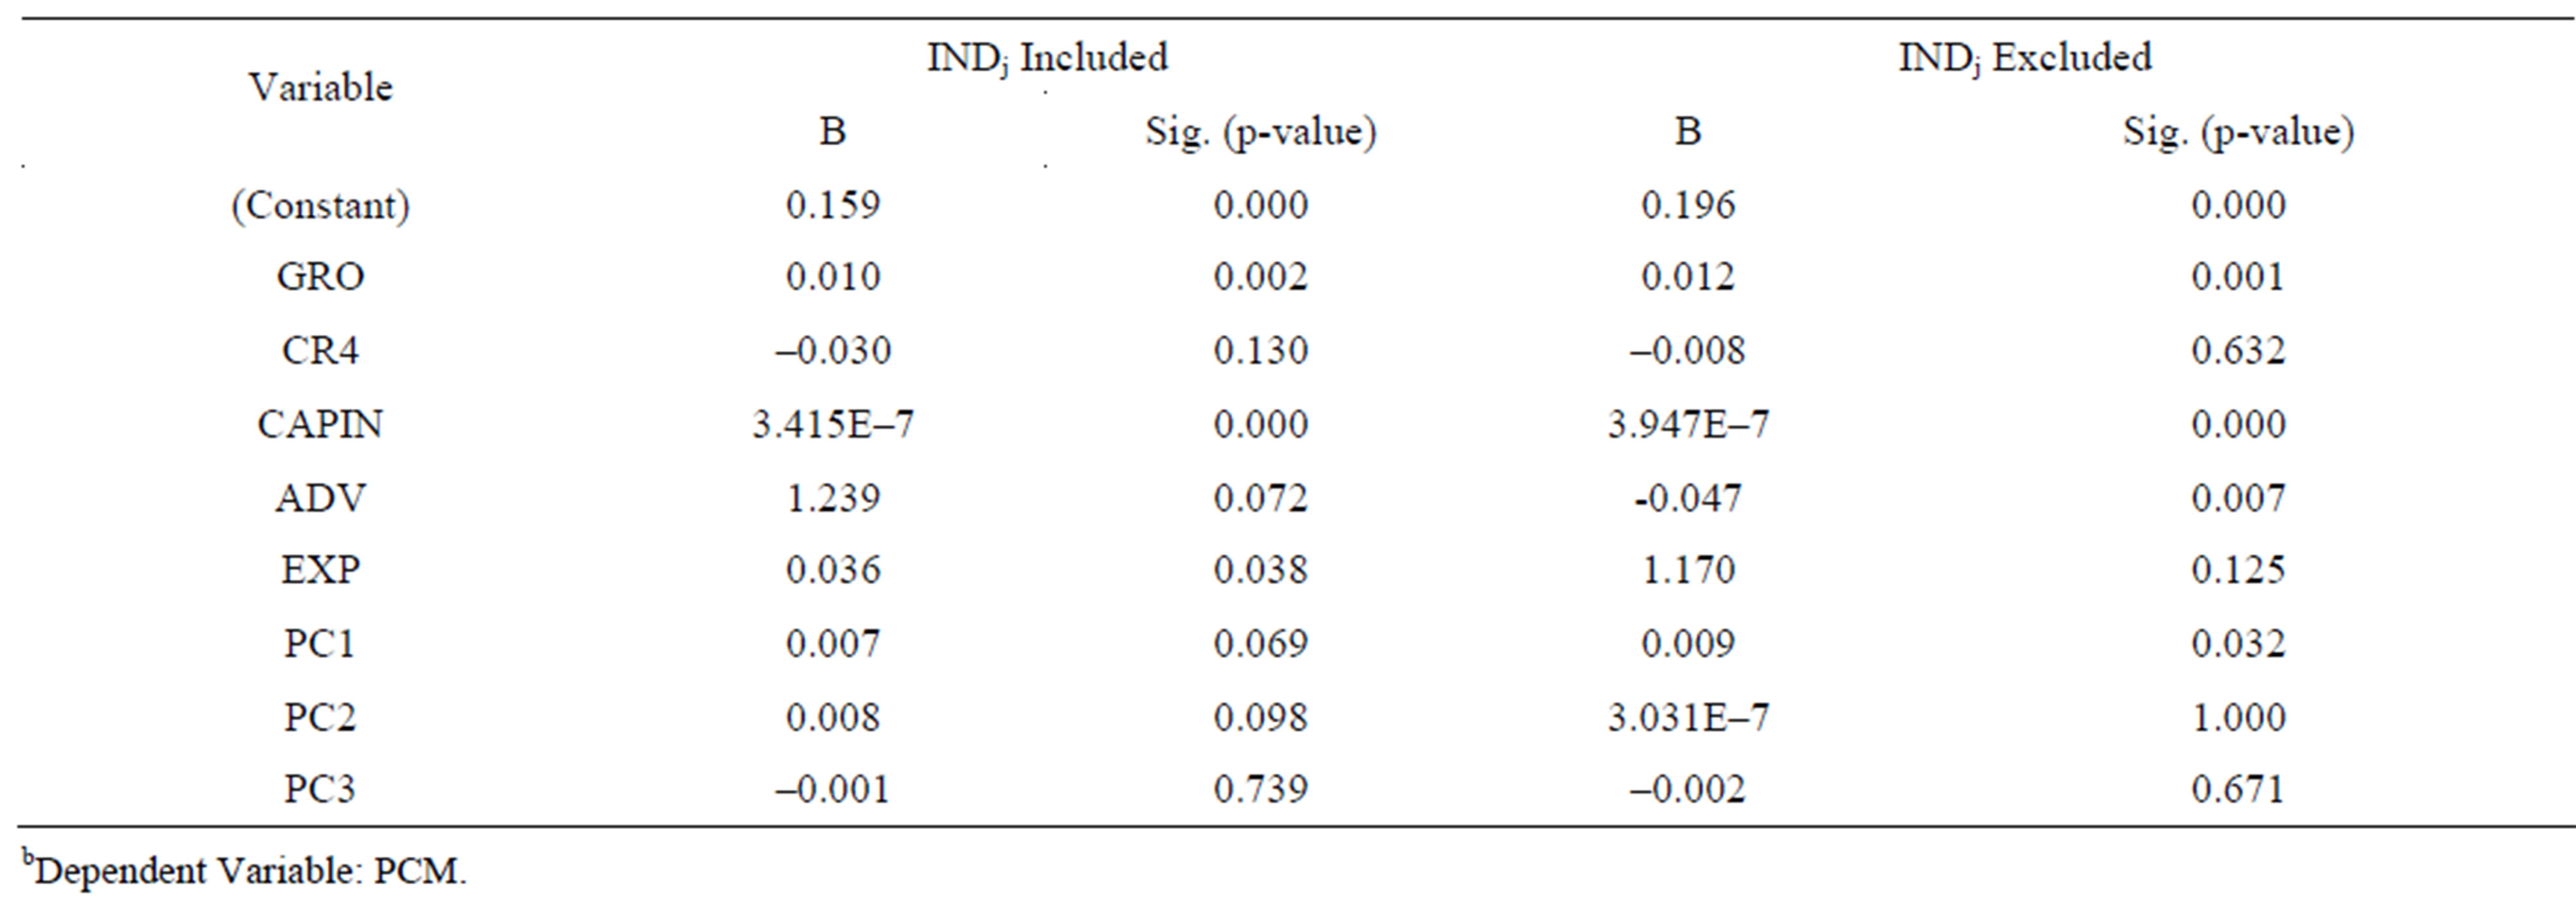
Table 5. Coefficientsb.
respectively. The differences in this model are: CR4 is highly significant (marginally significant in the first PCM model), ADV is moderately significant (marginally significant in the first PCM model). While PC1 is significant (moderately significant in the first PCM model), PC2 is very highly significant (moderately significant in the first PCM model). Similar to the first PCM model, PC3 is negative and very highly insignificant. Hence, it is inferred that the reliability of PCM model which included INDj variable is much higher.
The variables, PC1 and PC2 of the FMT which represent two important themes (dimensions), namely “process control technologies” and “production and quality control technologies” which together account for 53 percent of the variance in FMT is significant. PC3 which represents “general control technology” is insignificant and it only accounts for 12 percent of the variance in FMT. According to the first PCM model, the null hypotheses that PC1 and PC2 have no partial correlation with PCM (i.e. β6 = 0 and β7 = 0) can be rejected. However, according to the second PCM, model only the null hypotheses that PC1 has no partial correlation with PCM (i.e. β6 = 0) can be rejected. Therefore, the alternative hypothesis can be accepted which means that CP1 has a significant correlation with PCM which is positive (since λ6 is positive). However, in the second PCM model, the null hypothesis that PC2 has no partial correlation with PCM has to be accepted (i.e. β7 = 0). However, as explained above, according to the first model, PC2 has a positive partial correlation with PCM. Since, as was shown, according to all indicators the predictability of the first PCM model is greater, it can be concluded that PC2 has a positive partial correlation with PCM. This leads to the acceptance of research Hypothesis; a high degree of FMT adoption enhances PCM of the Manufacturing Industry of Malaysia.
For all the cases, Mahalanobis distance and Cooks distance which indicate the impacts of outliers had been saved in the SPSS data editor. The critical chi-square value of 51.179 at α = 0.001 level of significance was taken as the critical value for the Mahalanobis distance. There were 12 cases which exceeded the critical value indicating that there were 12 multivariate outliers among the 300 cases. The critical value considered for the Cooks distance was one and only in two cases the critical value was exceeded.
5. Conclusions
The main purpose of this study was to evaluate the impact of the degree of FMT adoption on the profitability of the manufacturing industry of Malaysia. The types of FMT considered are namely, Computer Numerical Control Machine Tools (CNC), Numerical Controlled Machine Tools (NC), Robotics (ROB), Programmable Logic Controllers (PLC), Automated Inspections (INS), Automated Storage and Retrieval Systems (ASR), Computer Aided Design (CAD) and Local Area Networks (LAN). On account of the potential multicollinearity among the eight types of FMT, three PCs were extracted to substitute the individual FMT variables. The FMT variables load onto PCs as follows: LAN, CAD, PLC and CNC load onto PC1; ASR, INS and ROB load onto PC2 and NC only loads onto PC3. The three PCs were labelled so that they best describe the respective constituents; PC1- “process control” technologies, PC2-“production and quality control” technologies and the PC3-“general control” technology.
Separate PCM models were solved for the two scenarios: one included the INDj; and the other excluded the INDj. One of the important contributions of the present study is that it reveals regarding the models specified to study the impact of FMT, that by including an industry fixed dummy variable to account for the differences in technological opportunity among different industries, the credibility of the models can be increased considerably.
The most significant finding of the study is that both PC1 and PC2 show significant and positive correlation with PCM. In contrast, PC3 shows a highly insignificant and negative relationship with PCM. This indicates that the degree of adoption of process control technologies and production and quality control technologies have a positive influence on PCM of the FMT intensively adopted sub sector of the manufacturing industry. Since both PC1 and PC2 together account for (53 percent) greater variation and PC3 account for (12 percent) relatively smaller variation among the eight FMT and it can be concluded that a high degree of FMT adoption enhances PCM of the Manufacturing Industry of Malaysia. This is consistent with the a priori expectations regarding the investments in FMT.
The present study has been made different from previous studies by incorporating most of the aspects overlooked by other studies. As a result of this, the findings of the present study afford a more realistic picture of the relationship between PCM and the degree of FMT adoption in the manufacturing industry of Malaysia. According to Mohamed, Mohamed, Abdullah and Jalil [31], findings of the empirical estimation appear to lend some support to the idea that in the Malaysian manufacturing industry, production flexibility is one of the forces that explains the lasting presence of small firms alongside their larger counterparts in the market.
In its customary call for future research, the authors recommend studies that investigate the relationship of investments in FMT rather than the degree of adoption of FMT have with the PCM of the manufacturing industry. It can be safely admitted that the accuracy of findings can be increased further by taking precautionary measures to elicit information regarding the value of investments. Hence, it is proposed that future studies need be undertaken in collaboration with the industry monitoring institutes of the state sector that makes establishments obligatory to divulge investments made in FMT to evaluate the impact of investments in FMT on PCM.
REFERENCES
- P. Kumar and S. G. Deshmukh, “A Model for Flexible Supply Chain through Flexible Manufacturing,” Global Journal of Flexible Systems Management, Vol. 7, No. 3, 2006, pp. 17-24. doi:10.5465/AMR.1988.4307510
- P. L. Nemetz and L. W. Fry, “Flexible Manufacturing Organizations: Implications for Strategy Formulation and Organization Design,” Academy of Management Review, Vol. 13, No. 4, 1988, pp. 627-638.
- O. P. Sharma, “Managing Flexibility in Manufacturing and Operations,” Journal of Management Research, Vol. 2, No.3, 2002, pp. 147-163.
- H. F. Gale, T. R. Wojan and J. C. Olmsted, “Skills, Flexible Manufacturing Technology and Work Organization,” Industrial Relations, Vol. 41, No. 1, 2002, pp. 48-79. doi:10.1111/1468-232X.00235
- L. H. Roller and M. M. Tombak, “Competition and Investment in Flexible Technologies,” Management Science, Vol. 39, No. 1, 1993, pp. 107-114. doi:10.1287/mnsc.39.1.107
- R. Slagmulder and W. Bruggeman, “Investment Justification of Flexible Manufacturing Technologies: Inferences from Field Research,” International Journal of Operations & Production Management, Vol. 12, No. 7-8, 1992, pp. 168-186. doi:10.1108/EUM0000000001310
- C. H. Fine and R. M. Freund, “Optimal Investment in Product-Flexible Manufacturing,” Management Science, Vol. 36, No. 4, 1990, pp. 449-466. doi:10.1287/mnsc.36.4.449
- R. Sinha and C. H. Noble, “The Adoption of Radical Manufacturing Technologies and Firm Survival,” Strategic Management Journal, Vol. 29, No. 9, 2008, pp. 943-962. doi:10.1002/smj.687
- Malaysian Industrial Development Authority (MIDA), “Malaysia-Investment in the Manufacturing Sector,” MIDA, 2007.
- J. Wind and A. Rangaswamy, “Customisation: The Next Revolution in Mass Customization,” Journal of Interactive Marketing, Vol. 15, No. 1, 2001, pp. 13-31. doi:10.1002/1520-6653(200124)15:1<13::AID-DIR1001>3.0.CO;2-#
- G. Da Silveria and F. S. Fogliatto, “Effects of Technology Adoption on Mass Customisation Ability of Broad and Narrow Market Firms,” Gestao & Producao, Vol. 12, No. 3, 2005, pp. 347-359. doi:10.1590/S0104-530X2005000300006
- E. R. Brendt and C. J. Morrsison, “High Tech Capital Formation and Economic Performance in USA Manufacturing Industries: An Exploratory Analysis,” Journal of Econometrics, Vol. 65, 1995, pp. 9-43. doi:10.1016/0304-4076(94)01596-R
- L. H. Amato and C. H. Amato, “The Impact of High Tech Production Techniques on Productivity and Profitability in Selected U.S. Manufacturing Industries,” Review of Industrial Organization, Vol. 16, No. 4, 2000, pp. 327- 342. doi:10.1023/A:1007800121100
- Y. Okada, “Competition and Productivity in Japanese Manufacturing Industries,” Journal of Japanese and International Economies, Vol. 19, No. 4, 2005, pp. 586-616. doi:10.1016/j.jjie.2005.10.003
- Department of Statistics Malaysia, DOS, “Annual Survey of Manufacturing Industries,” DOS, Malaysia, 2000- 2005.
- J. K. Shiraz, “Market Structure and Price Cost Margins in United Kingdom Manufacturing Industries,” The Review of Economics and Statistics, Vol. 56, No. 1, 1973, pp. 67- 76.
- G. L. Go, D. R. Kamerschen and C. D. Delorme, “Market Structure and Price-Cost Margins in Philippine Manufacturing Industries,” Applied Economics, Vol. 31, No. 7, 1999, pp. 857-864. doi:10.1080/000368499323814
- T. S. Yean, “Determinants of Productivity Growth in the Malaysian Manufacturing Sector,” ASEAN Economic Bulletin, Vol. 13, No. 3, 1997, pp. 333-343. doi:10.1355/AE13-3D
- I. K. Lee, “Determinants of Cyclical Properties of the Price Cost Margin in US Manufacturing Industries,” International Economic Journal, Vol. 18, No. 3, 2004, pp. 353-364.
- N. H. Collins and L. E. Preston, “Concentration and Price Cost Margins in Manufacturing Industries,” University of California Press, Berkeley, 1968.
- D. K Round, “Price Cost Margins in Australian Manufacturing Industries,” University of Adelaide Press, Adelaide, 1971-1972.
- B. Goldar and A. Kumari, “Import Liberalisation and Productivity Growth in Indian Manufacturing Industries in the 1990s,” The Developing Economies, Vol. 41, No. 4, 2003, pp. 436-460.
- H. M. Leung, “Total Factor Productivity Growth in Singapore’s Manufacturing Industries,” Applied Economics Letters, Vol. 4, No. 8, 1997, pp. 525-528. doi:10.1080/758536639
- R. H. McGuckin and M. L. Streitwieser, “The Effect of Technology Use on Productivity Growth,” Economics of Innovation and New Technology, Vol. 7, No. 1, 1998, pp. 1-26.
- R. Mahadevan, “Assessing the Output and Productivity Growth of Malaysia’s Manufacturing Sector,” Journal of Asian Economics, Vol. 12, No. 4, 2001, pp. 587-597. doi:10.1016/S1049-0078(01)00104-X
- R. Mahadevan, “A Frontier Approach to Measuring Total Factor Productivity Growth in Singapore’s Services Sector,” Journal of Economic Studies, Vol. 29, No. 1, 2002, pp. 48-58. doi:10.1108/01443580210414111
- S. Yoon, “A Note on the Market Structure and Performance in Korean Manufacturing Industries,” Journal of Policy Modeling, Vol. 26, No. 6, 2004, pp. 733-746. doi:10.1016/j.jpolmod.2004.03.005
- Directory of Federation of Malaysian Manufacturers 2007, Federation of Malaysian Manufacturers, Malaysia.
- S. J. Coakes, L. Steed and J. Price, “SPSS 15.0, Analysis without Anguish,” John Wiley & Sons, Hoboken, 2008.
- A. Field, “Discovering Statistics Using SPSS,” SAGE Publications Ltd, London, 2005.
- N. Mohamed, N. G Mohamed, A. Z Abdullah and S. A Jalil, “Flexibility and Small Firm’s Survival: Further Evidence from Malaysian Manufacturing,” Applied Economics Letters, Vol. 14, No. 12, 2007, pp. 931-934. doi:10.1080/13504850600706065