Journal of Electromagnetic Analysis and Applications
Vol.4 No.5(2012), Article ID:19527,4 pages DOI:10.4236/jemaa.2012.45029
Novel Method of Detecting Thyroid Disfunction Using Microwaves

Department of Electrical Engineering, Mangosuthu University of Technology, Durban, South Africa.
Email: lonappan@mut.ac.za
Received March 14th, 2012; revised April 12th, 2012; accepted April 24th, 2012
Keywords: Thyroid, Blood; Cavity Perturbation; Clinical Analysis
ABSTRACT
This paper reports a novel method of in-vitro thyroid function analysis based on the measurement of the dielectric properties of blood at microwave frequencies. The measurements were made using rectangular cavity perturbation technique at the S-band of microwave frequency with the different samples obtained from healthy donors as well as from patients. It is observed that an appreciably change in the dielectric properties of patient samples with that of normal healthy samples and this measurements are in good agreement with clinical analysis. These results indicate an alternative in-vitro method of diagnosing thyroid abnormalities using microwaves.
1. Introduction
Thyroid is one of the largest endocrine glands, found in the neck, below the thyroid cartilage. The thyroid gland controls the usage of body energy, makes proteins and the sensitivity of the body to other hormones. It participates in these processes by producing thyroid hormones, mainly triiodothyronine (T3) and thyroxine (T4). These hormones regulate the rate of metabolism and affect the growth and rate of function of many other systems in the body [1,2]. The thyroid also produces calcitonin, which plays a role in calcium homeostasis. The most common problems of the thyroid gland consist of an overactive thyroid gland, referred to as hyperthyroidism, and an underactive thyroid gland, referred to as hypothyroidism. The measurement of the dielectric properties of blood helps to identify the healthy condition as well as abnormalities of thyroid as there is significant variation in the dielectric properties.
Although medical science has advanced greatly in the last century, there is still much that is not understood about the way the human body interacts with many things, including microwaves. The potential for medical uses of microwaves lies in two areas therapeutic and diagnostic field and many new medical microwave devices are also developed [3,4]. All the known therapeutic uses of microwaves involve the heating of tissue. Carefully controlled, microwave-generated heat can have a therapeutic effect on a number of ailments. Microwave medical devices ability depends upon how far microwaves can deeply penetrate into living tissues. The depth to which microwaves can penetrate tissues is primarily a function of the dielectric properties of tissues and of the frequency of the microwaves. Lower the water content of the tissue the deeper a wave at a given frequency and lower the frequency the deeper is the depth of penetration into tissues with given water content. Thus, there is a need to study the interaction of microwave with tissues especially its effect on biological materials. The key element in the microwave study is the determination of the absorbed energy. The amount of energy absorbed is a function of the complex permittivity of a material [5]. Hence, it is crucial to know the dielectric properties of biological materials and the various constituents thereof. Exhaustive studies of dielectric parameters of various human tissues and body fluids at different RF frequencies have been reported [6-8]. Different measurement techniques are used to measure the complex permittivity of a material and the chosen technique depends on various factors such as the nature of the sample and the frequency range used [9-12]. When only very small volumes of the sample are available, the cavity perturbation technique is an attractive option as it requires only minute volumes for the measurement [13]. This makes it suitable for the dielectric study of blood samples, as only very small volumes need only be extracted by this procedure. The rectangular cavity perturbation technique has been employed for the measurement of the dielectric parameters of blood samples obtained from healthy persons as well as from patients with thyroid abnormalities in this work, in the frequency range 2 to 3 GHz. It is noticed that a remarkable change in the dielectric properties of thyroid abnormal blood samples with that of the normal healthy blood samples and these measurements were in good agreement with clinical analysis. This microwave measurement procedure is simple and extraction of blood from persons is least painful and nonsurgical in nature. These results prove a new novel method of diagnosing thyroid abnormalities using microwaves.
2. Sample Preparation
The blood samples were extracted by syringe from donors as well as from patients. Then it is heparin-treated sealed in sample holder at 5˚C in order to prevent coagulation and to maintain their viability. Measurements were carried out on samples which were less than one day old.
3. Procedure
The experimental set-up consists of a transmission type S-band rectangular cavity resonator, HP 8714 ET network analyser. The cavity resonator is a transmission line with one or both ends closed. The numbers of resonant frequencies are determined by the length of the resonator. The resonator in this set-up is excited in the TE10ρ mode. The sample holder which is made of glass in the form of a capillary tube flared to a disk shaped bulb at the bottom is placed into the cavity through the non-radiating cavity slot, at broader side of the cavity which can facilitate the easy movement of the holder. The resonant frequency fo and the corresponding quality factor Qo of the cavity at each resonant peak with the empty sample holder placed at the maximum electric field are noted. The same holder filled with known amount of sample under study is again introduced into the cavity resonator through the nonradiating slot. The resonant frequencies of the sample loaded cavity are selected and the position of the sample is adjusted for maximum perturbation (i.e. maximum shift of resonant frequency with minimum amplitude for the peak). The new resonant frequency fs and the quality factor Qs are noted. The same procedure is repeated for other resonant frequencies.
The experimental set-up consists of a transmission type S-band rectangular cavity resonator, HP 8714 ET network analyser. The cavity resonator is a transmission line with one or both ends closed. The numbers of resonant frequencies are determined by the length of the resonator. The resonator in this set-up is excited in the TE10ρ mode. The sample holder which is made of glass in the form of a capillary tube flared to a disk shaped bulb at the bottom is placed into the cavity through the nonradiating cavity slot, at broader side of the cavity which can facilitate the easy movement of the holder. The resonant frequency fo and the corresponding quality factor Qo of the cavity at each resonant peak with the empty sample holder placed at the maximum electric field are noted. The same holder filled with known amount of sample under study is again introduced into the cavity resonator through the non-radiating slot. The resonant frequencies of the sample loaded cavity are selected and the position of the sample is adjusted for maximum perturbation (i.e. maximum shift of resonant frequency with minimum amplitude for the peak). The new resonant frequency fs and the quality factor Qs are noted. The same procedure is repeated for other resonant frequencies.
4. Theory
When a material is introduced into a resonant cavity, the cavity field distribution and resonant frequency are changed which depend on shape, electromagnetic properties and its position in the fields of the cavity. Dielectric material interacts only with electric field in the cavity According to the theory of cavity perturbation, the complex frequency shift is related as [13]
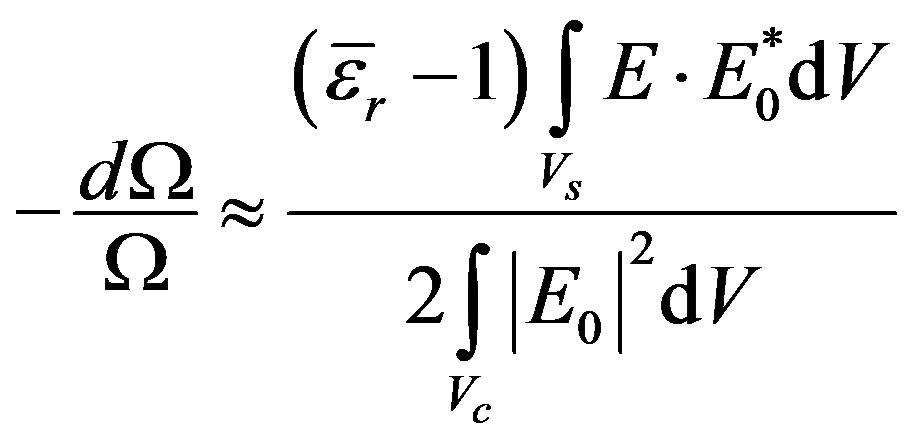 (1)
(1)
But
 (2)
(2)
Equating (1) and (2) and separating real and imaginary parts results
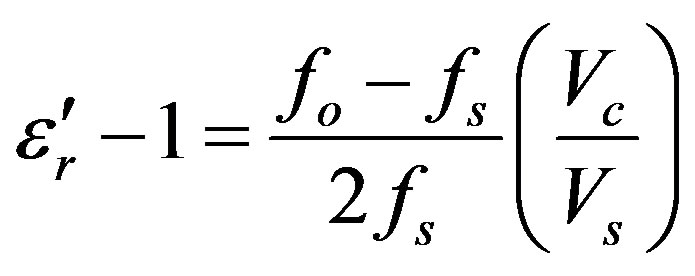 (3)
(3)
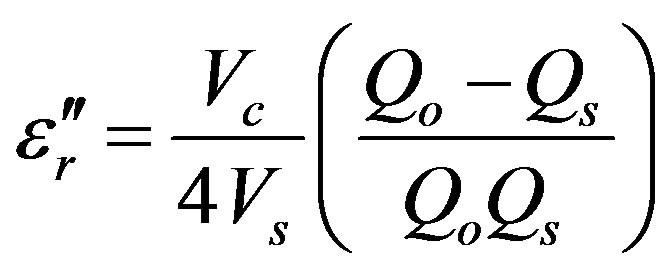 (4)
(4)
Here,  ,
,  is the relative complex permittivity of the sample,
  is the real part of the relative complex permittivity, which is known as dielectric constant.
  is the imaginary part of the relative complex permittivity associated with the dielectric loss of the material. Vs and Vc are corresponding volumes of the sample and the cavity resonator. The conductivity can be related to the imaginary part of the complex dielectric constant as
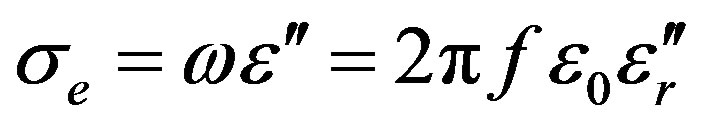 (5)
(5)
5. Results and Discussions
Blood samples are collected from the healthy donors as well as from patients having thyroid abnormalities. The medical laboratories perform the clinical tests to obtain the necessary clinical parameters. The clinical laboratory parameters and the dielectric constant of blood are compared in order to obtain a relation. In a normal blood sample glucose level is the order of 80 - 120 mg/dl while in thyroid abnormal blood samples it is in the order of 40 - 70 mg/dl and the clinical results are tabulated in the Table 1. From these results shows a remarkable and noticeable variation in blood glucose level in normal and thyroid abnormal blood samples. Table 2 indicates the limits of Lipid Profile in the normal and thyroid abnormal blood samples and there is considerable variation in between the two types of blood samples. Table 3 is the Lipid Profile results in the normal and thyroid abnormal blood samples obtained in the clinical analysis. Lipid
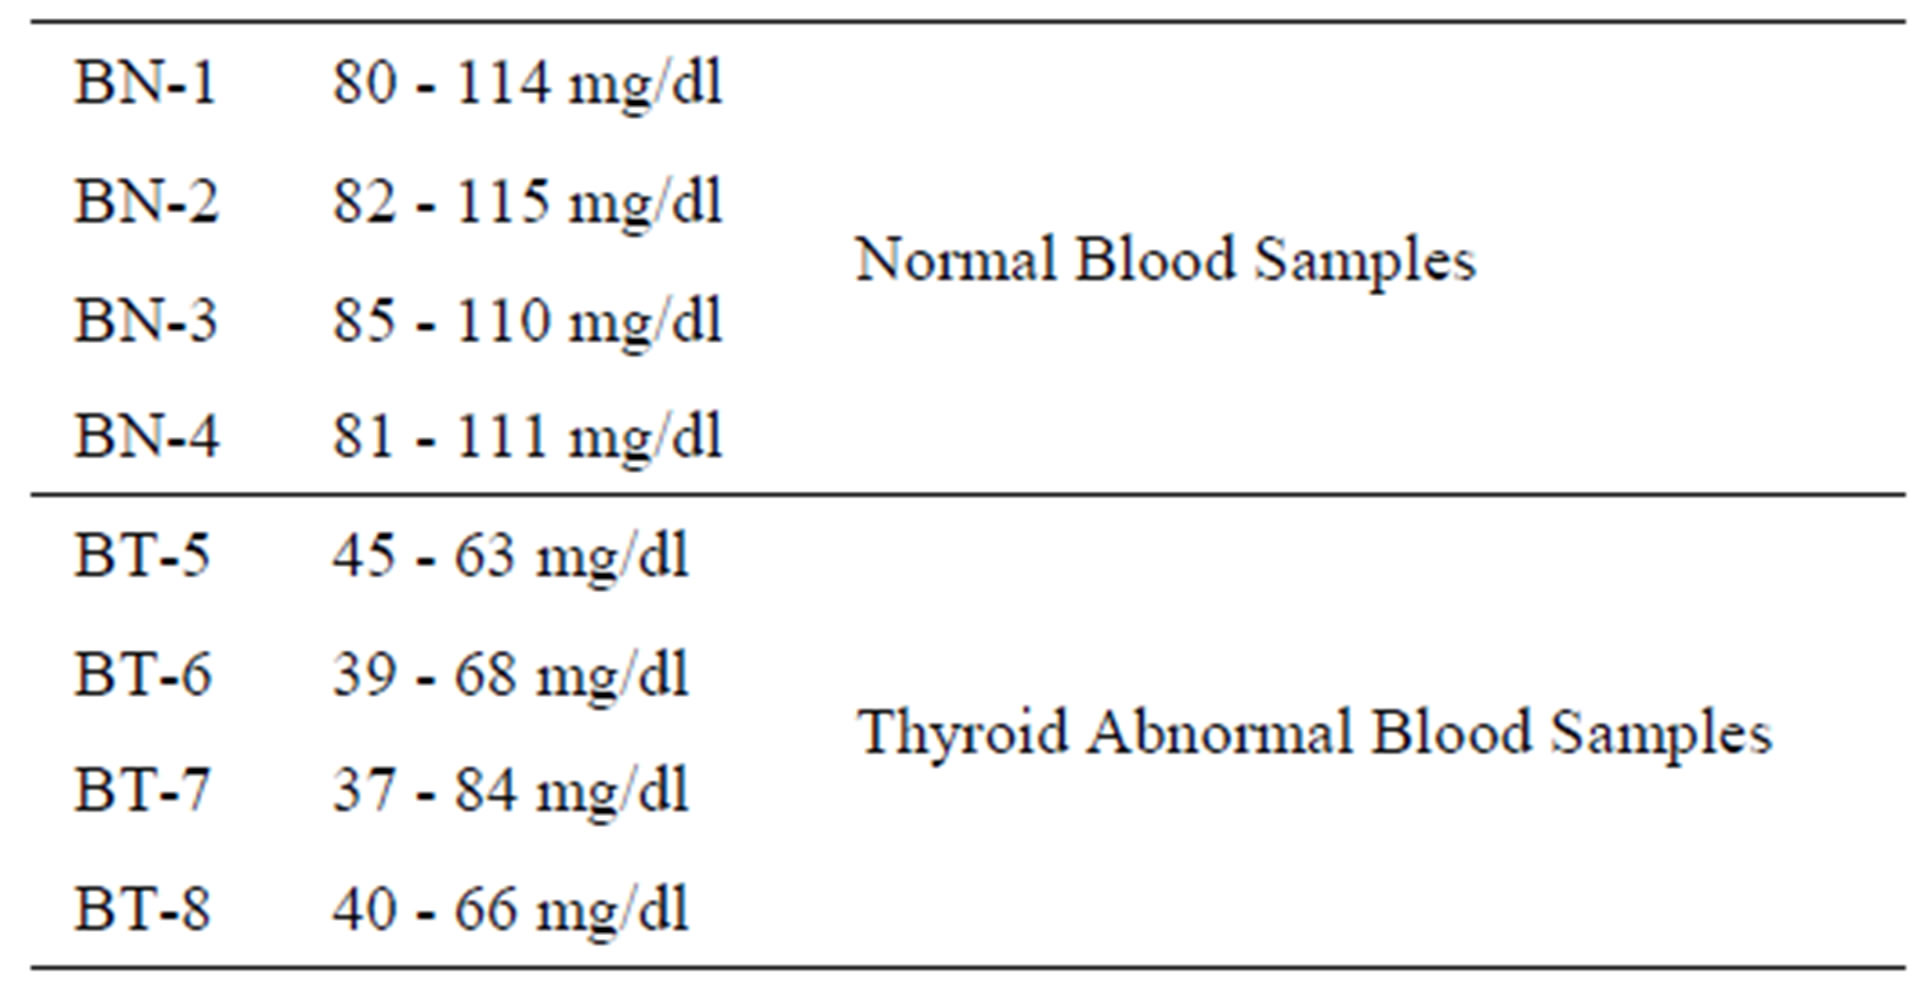
Table 1. Variation glucose in constant in normal blood samples and thyroid abnormal blood samples.
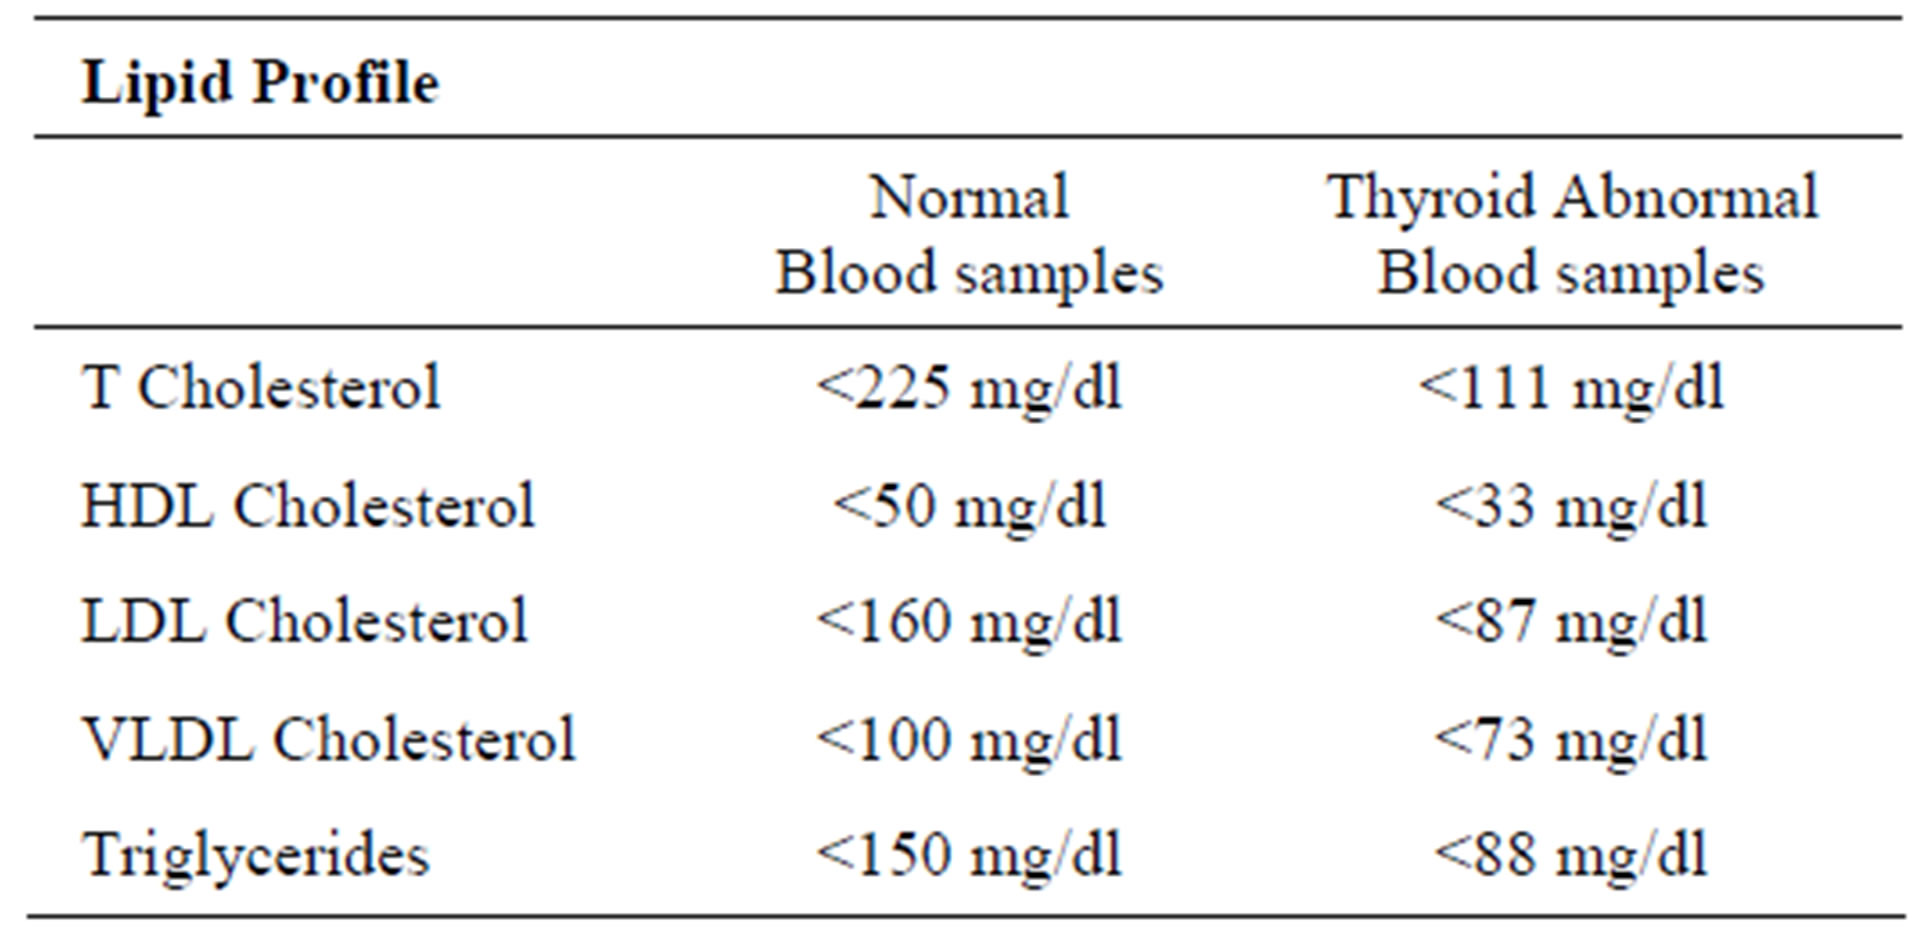
Table 2. Variation limits of lipid profile constant in normal blood samples and thyroid abnormal blood samples.
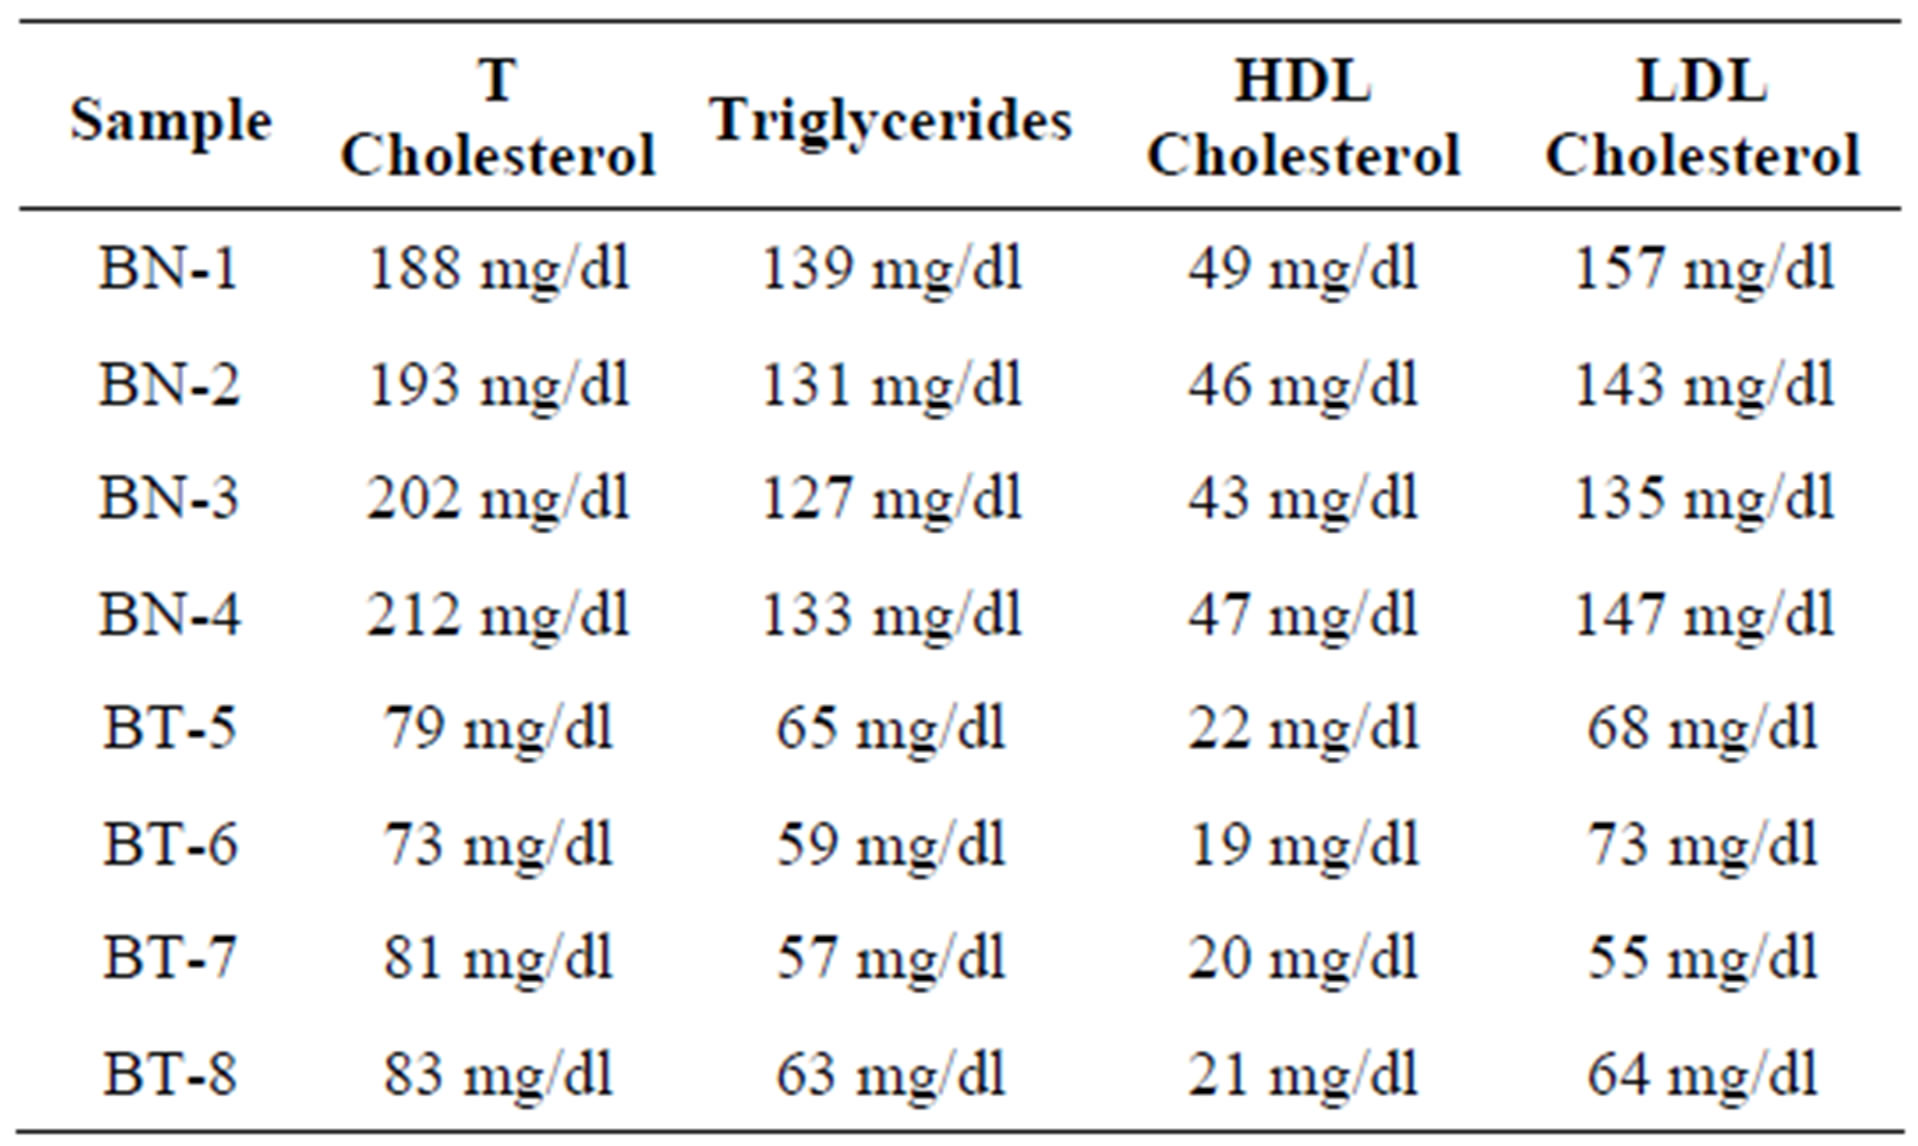
Table 3. Variation of lipid profile in normal blood samples and thyroid abnormal blood samples.
Profile results also shows a remarkable variation between the normal and thyroid abnormal blood samples. The Electrolyte Profile in the normal and thyroid abnormal blood samples is tabulated in Table 4 and it shows a variation between the two types of blood samples. Figure 1 shows the Dielectric Constant variation in Normal and thyroid abnormal blood samples and the dielectric constant is more in the thyroid abnormal blood samples than the normal blood samples. This is attributed due to increased concentration levels of glucose, and electrolyte in the normal blood samples. Figure 2 shows that conductivity of thyroid abnormal blood samples is more than that of normal blood samples and this increased level of conductivity is due to the presence of HDL Cholesterol, VLDL Cholesterol, and Triglycerides. It is observed that an appreciably change in the dielectric properties of thyroid abnormal blood samples with the normal healthy samples and this measurements are in good agreement with clinical results. This study shows a great correlation between the laboratory results and blood diagnosis using microwaves.
The microwave studies of pericardial fluid samples were done using cavity perturbation technique collected from healthy donors as well as from the patients and the
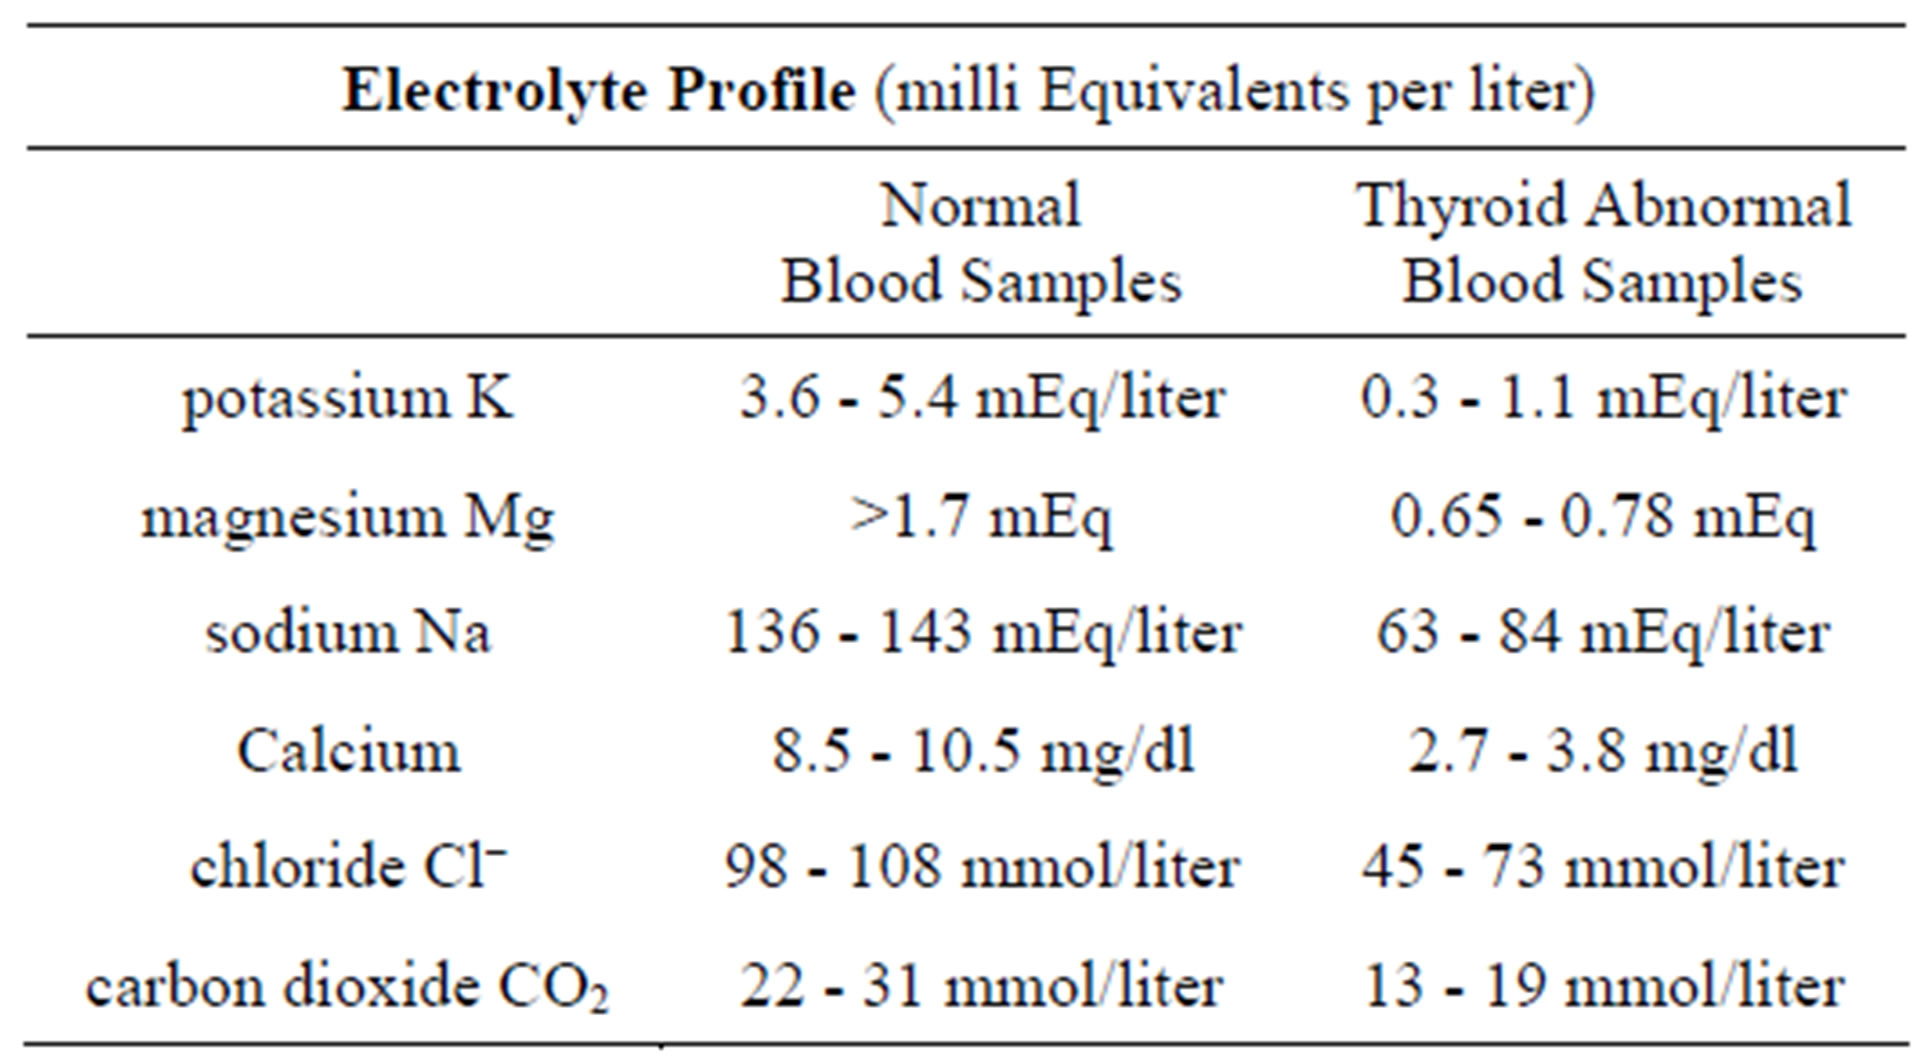
Table 4. Variation of electrolyte profile in normal blood samples and thyroid abnormal blood samples.
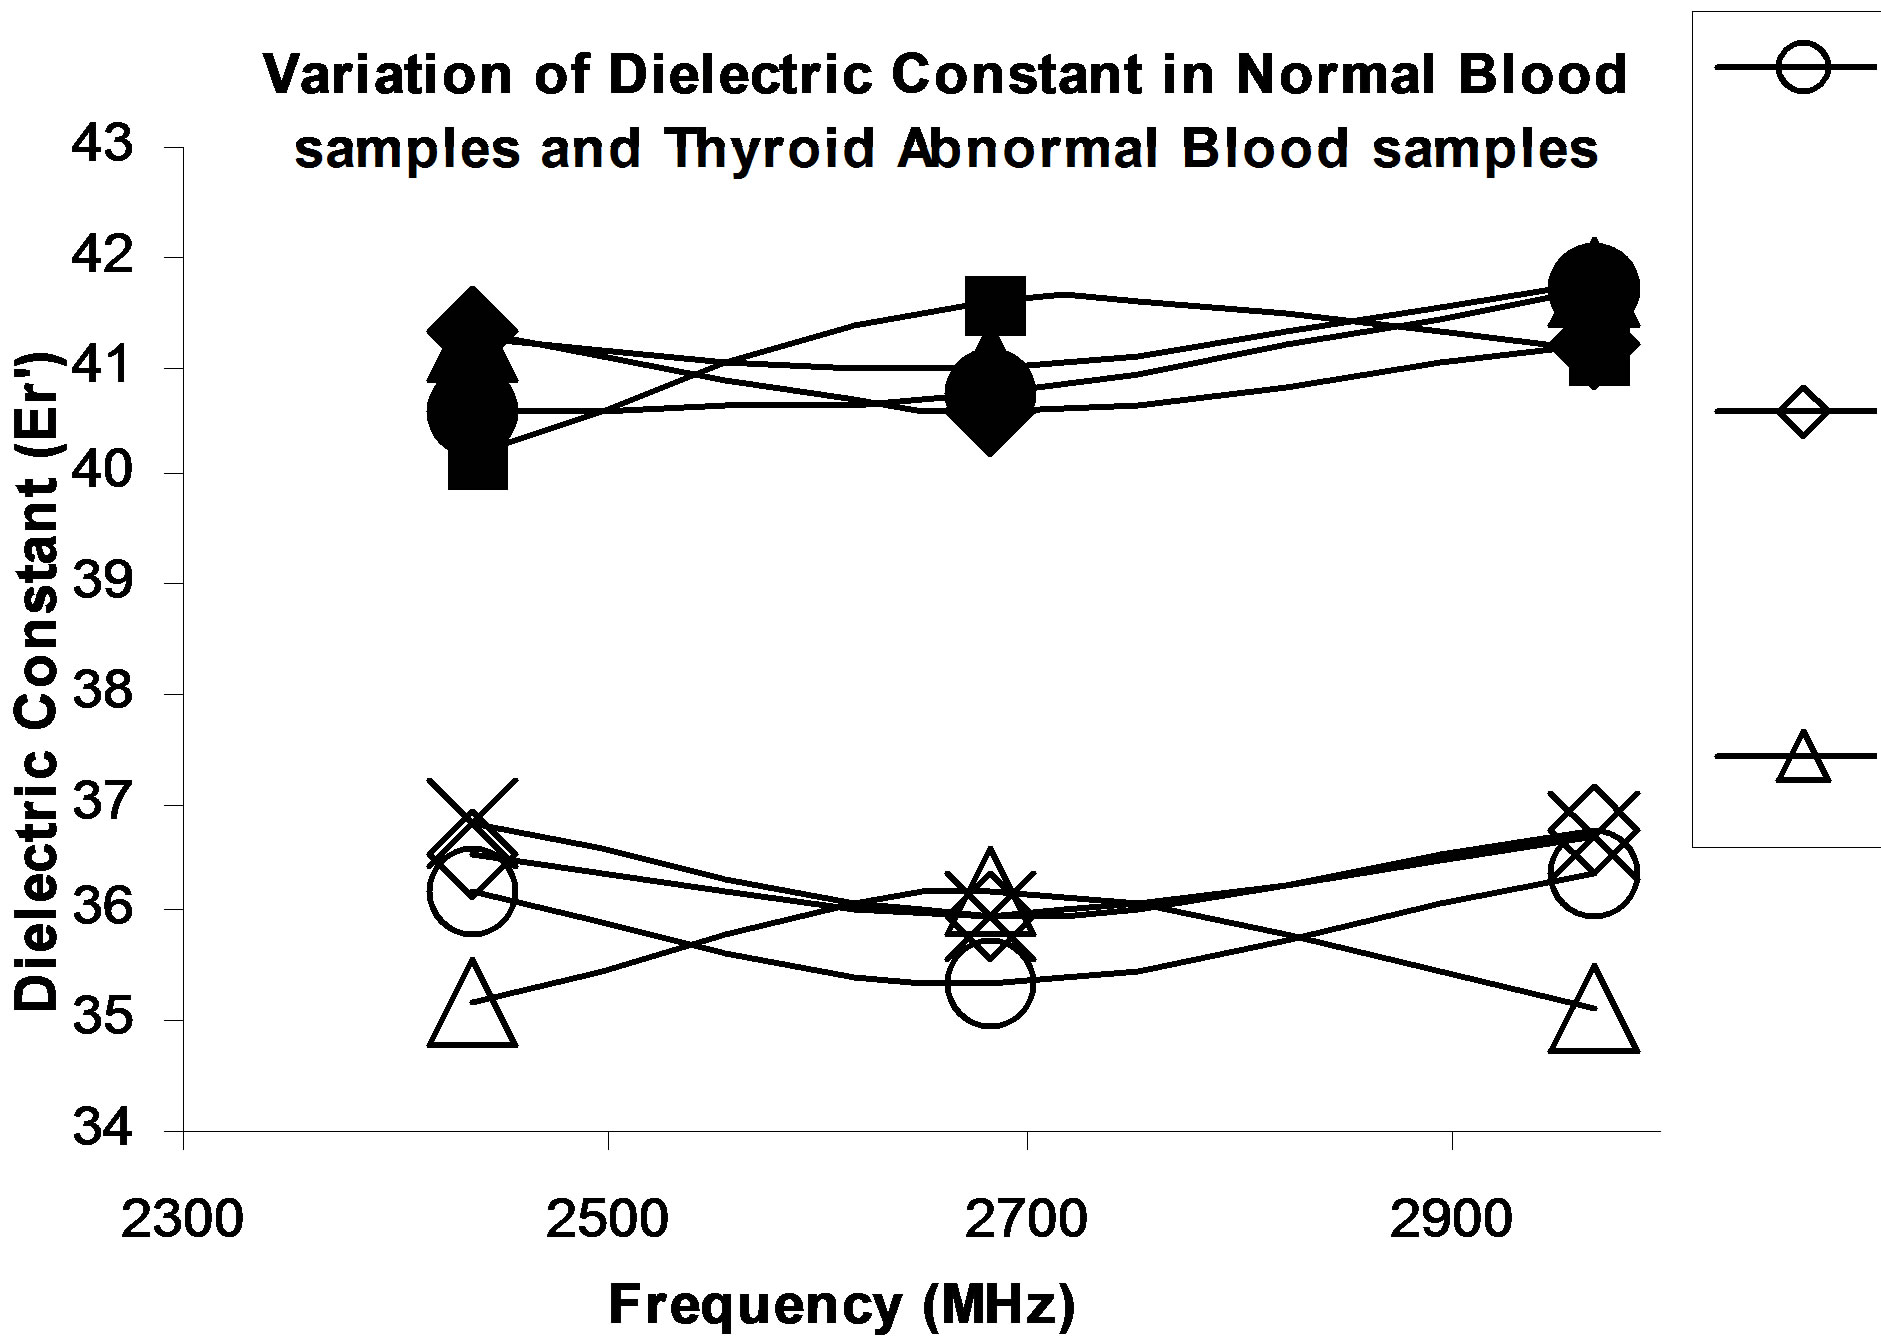
Figure 1. Variation of dielectric constant in normal blood samples and thyroid abnormal blood samples.

Figure 2. Variation of conductivities constant in normal blood samples and thyroid abnormal blood samples.
results are shown in Figures 1 to 2. These results are novel using microwave techniques for the case of pericardial fluid. Clinical evaluation of the pericardial fluid samples is also done and the results are tabulated in Table 1. They found it was relatively rich in lactate dehydrogenase, low in protein and high in lymphocytes and monocytes. From Figure 1 it is noticed that the bleeeding samples exhibit a higher dielectric constant than that of the normal samples. In Figure 2 the variation of conductivity of normal and bleeding samples are plotted. It can be found that distinct variation in the conductivities of normal samples and the bleeding samples. The increase in conductivity in bleeding samples is due to the presence of higher level of protein contents such as albumin and globulin as well as blood traces. Thus in the specified band of frequencies, normal pericardial and pericardial bleeding samples were studied and exhibit distinct variation of dielectric constant and conductivity with frequency.
6. Conclusion
The microwave characterisation of the normal blood samples as well as thyroid abnormal blood samples are done using cavity perturbation technique. The cavity perturbation technique is quick, simple, and accurate and it requires very low volume of sample for measuring the dielectric properties of tissue samples and biological fluids. It is observed that in the specified band of frequencies, there is an appreciably change in the dielectric properties of patient samples with that of normal healthy samples. These results indicate an alternative in-vitro method of diagnosing thyroid abnormalities using microwaves.
REFERENCES
- B. Yalçin and H. Ozan, “Detailed Investigation of the Relationship between the Inferior Laryngeal Nerve including Laryngeal Branches and Ligament of Berry,” Journal of the American College of Surgeons, Vol. 202, No. 2, 2006, pp. 291-296. doi:10.1016/j.jamcollsurg.2005.09.025
- S. Venturi, F. M. Donati, A. Venturi and M. Venturi, “Environmental Iodine Deficiency: A Challenge to the Evolution of Terrestrial Life?” Thyroid, Vol. 10, No. 8, 2000, pp. 727-729. doi:10.1089/10507250050137851
- A. Rosen and H. D. Rosen, “New Frontiers in Medical Device Technology,” Wiley, New York, 1995.
- P. M. Meaney, M. W. Fanning, D. Li, S. P. Poplack and K. D. Paulsen, “A Clinical Prototype for Active Microwave Imaging of the Breast,” IEEE Transactions on Microwave Theory and Techniques, Vol. 48, No. 11, 2000, pp 1841-1853.
- A. Von Hippel, “Dielectric and Waves,” Artech House, 1995.
- S. Gabriel, R. W. Lau and C. Gabriel, “The Dielectric Properties of Biological Tissues: II. Measurements on the Frequency Range 10 Hz to 20 GHz Literature Survey,” Physics Medicine Biology, Vol. 41, No. 11, 1996, pp. 2251-2269. doi:10.1088/0031-9155/41/11/002
- H. F. Cook, “Dielectric Behavior of Human Blood at Microwave Frequencies,” Nature, Vol. 168, 1951, pp. 247-248. doi:10.1038/168247a0
- H. F. Cook, “The Dielectric Behavior of Some Types of Human Tissues at Microwave Frequencies,” British Journal of Applied Physics, Vol. 2, No. 10, 1951, pp. 295-300. doi:10.1088/0508-3443/2/10/304
- D. K. Ghodgaonkar, V. V. Varadan and V. K. Varadan, “Free Space Measurement of Complex Permittivity and Complex Permeability of Magnetic Materials at Microwave Frequencies,” IEEE Transactions on Instrumentation and Measurement, Vol. 39, No. 2, 1990, pp. 387-394. doi:10.1109/19.52520
- D. K. Ghodgaonkar, V. V. Varadan and V. K. Varadan, “A Free Space Method for Measurement of Dielectric Constant and Loss Tangents at Microwave Frequencies,” IEEE Transaction on Instrumentation and Measurement, Vol. 38, No. 3, 1989, pp. 789-793. doi:10.1109/19.32194
- W. Barry, “A Broadband, Automated, Stripline Technique for the Simultaneous Measurement of Complex Permittivity and Complex Permeability,” IEEE Transaction on Microwave Theory and Techniques, Vol. 34, No. 1, 1986, pp. 80-84. doi:10.1109/TMTT.1986.1133283
- Z. Abbas, R. D. Pollard and R. W. Kelsall, “A Rectangular Dielectric Waveguide Technique for Determination of Permittivity of Materials at W-Band,” IEEE Transactions on Microwave Theory and Techniques, Vol. 46, No. 12, 1998, pp. 2011-2015. doi:10.1109/22.739275
- K. T. Mathew, “Perturbation Theory,” Encyclopedia of RF and Microwave Engineering, Vol. 4, Wiley-Interscience, New York, 2005, pp. 3725-3735. doi:10.1002/0471654507.eme309