Journal of Electromagnetic Analysis and Applications
Vol. 2 No. 6 (2010) , Article ID: 2149 , 4 pages DOI:10.4236/jemaa.2010.26048
Measurement and Analysis of Temperature Dependent Resistance of La0.67Ca/Sr0.33MnO3 CMR Samples Using LabVIEW
![]()
1Department of Applied Physics, Birla Institute of Technology, Mesra, India; 2Institute of High Pressure Physics of the Russian Academy of Sciences, Troitsk, Russia.
Email: s_keshri@bitmesra.ac.in, sskeshri@rediffmail.com
Received February 3rd, 2010; revised April 7th, 2010; accepted April 22nd, 2010.
Keywords: CMR, Manganites, Magneto-Transport Properties, LabVIEW Program, Virtual Instrument
ABSTRACT
In this paper we report design of one virtual instrument for the measurement of resistance as a function of temperature. The program has been developed using the National Instruments’ graphical programming language ‘LabVIEW’ and has been run for the measurement of magnetoresistance of some colossal magnetoresistive (CMR) compounds, .
.
1. Introduction
LabVIEW [1] is graphical programming software developed by National Instruments. Using LabVIEW, readymade virtual instrument (VI) can be developed for various applications. It is a graphical programming language and hence all programming is made with blocks representing functions, icons representing variables and lines representing path of the variables [2]. The LabVIEW graphical development environment creates flexible and scalable design, control, and test applications. With LabVIEW, one can interface several equipments with computer together for precise measurements, analyze data for meaningful information and share results through intuitive displays. Many exciting experiments can be designed and demonstrated by integrating these VI technology products in a flexible laboratory environment with enormous possibilities of expansion and experimentation. Aim of our present instrumentation was to design programs for the measurement of resistance with the variation of temperature.
In this paper we report the magneto-transport behaviours of some colossal magnetoresistive (CMR) compound [3,4] using the above-said instruments coupled by VI designed using LabVIEW program. These materials have been widely studied because of their potential applications [3,4] and interesting properties like metal-insulator (M-I) transition, paramagnetic-ferromagnetic (PMFM) transition, large negative magnetoresistance (MR) over a wide temperature range, spin polarization etc. It has been recognized that the CMR effect typically exhibits in the vicinity of M-I transition temperature accompanied by a simultaneous paramagnetic to ferromagnetic transition at the Curie temperature [5,6]. For the present work,  (LCMO/ LSMO) have been synthesized and characterized for structural and magnetoresistive behaviors.
2. Experimental
Polycrystalline samples of LSMO and LCMO were prepared by the conventional solid state route. The stoichiometric amount of ,
,  and
and  were taken. The powdered samples were first sintered at 9000C for 24 hrs and then at 11000C for 18 hrs with intermediate grindings. The powder thus obtained was pelletized and annealed at 12500C for 12 hrs with intermediate grinding and repelletization and finally furnace cooled to room temperature. Structural properties of these prepared samples have been found to be similar with previous results [7,8].
For the measurement of resistivity, the prepared pellet was cut into rectangular shape. Four thin copper wires, attached to the sample by means of conducting silver epoxies, act as current and voltage leads. Current was supplied through the outer two leads and inner two were used for sensing developed voltage using sourcemeter (Keithley 2400), as shown in Figure 1. The sample was arranged inside a closed cycle He-cryostat (Oxford Instruments), controlled by ITC temperature controller (Oxford Instruments 503S). An electromagnet was placed across the sample as shown in the same figure. We have measured the dc electrical resistivity of the samples for the temperature range 10 to 300 K, with zero and 1 T applied magnetic field.
3. Labview Application
LabVIEW is a graphical programming consisting of three important components involved in the test and measurement applications, namely 1) Data acquisition, 2) Data analysis, and 3) Data visualization.
Figure 2 represents the front panel of the VI developed for four probe resistivity measurement. The VI draws data from parallel running temperature controller and sourcemeter and feed it into the computer through RS232 cables. The right part of the front panel is designed for visualization of input and output data and left part is made to visualize the plot corresponding to output (resistance versus temperature) data. The input data required to run the VI consists of path of the file (txt format) where data are to be stored, the value of compliance, temperature interval required, next temperature and the current supplied, as shown in the right upper part. The output data comprise of output voltage, estimated resistance of the sample and the standard deviation associated with the measurement. Using this VI we take data for either of heating or cooling cycles as shown in the right lower part of the front panel.
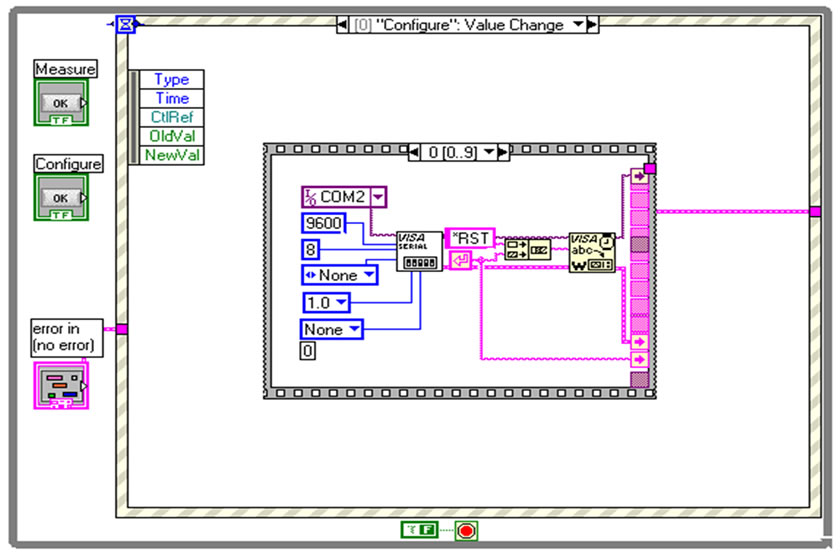
The corresponding circuit diagrams of three important parts of the same VI are shown in Figures 3(a)-3(c). Figure 3(a) shows the block for configuring the sourcemeter at the parameters defined by the user. “Configure” button sets the sourcemeter to the given condition and “Measure” button makes it ready for measuring the voltage developed. The program offers the flexibility to set input current value and compliance limit suitable for the sample under test. Figure 3(b) is the block diagram for four probe resistance measurement. Voltage is recorded by reversing the polarity of the current. This eliminates the instrumental error. Figure 3(c) is the temperature recording block. It senses the temperature and according to the given interval when the temperature controller attains the next temperature, the data is displayed and stored. The value of the temperature interval is to be added or subtracted to the present temperature value corresponding to heating and cooling cycles respectively. For both the cycles, data can be stored in a fixed temperature interval. VI can set the minimum interval of 0.1 K during heating as well as cooling cycles.
4. Results and Discussions
Figure 4 demonstrates the temperature dependent resistance of the samples measured using the above said VI in presence of magnetic field of strength 0 and 1 Tesla. In absence of magnetic field, both the samples LSMO and LCMO show broad humps corresponding to M-I transitions at temperatures 273.0 K and 201.6 K respectively. With the application of 1 Tesla magnetic field, resistivity of both the samples decreases whereas M-I transition temperature increases towards higher values 280.5 K and 203.2 K respectively, as also reported by many other researchers [9-12]. MR is defined as
 , where
  and
and  are resistivity values in zero and applied fields respectively. MR as a function of temperature measured in the presence of 1 T magnetic field is presented for both the samples in Figure 5(a)-(b). The nature of temperature dependent MR plot is in agreement with some previous reports [9,12].
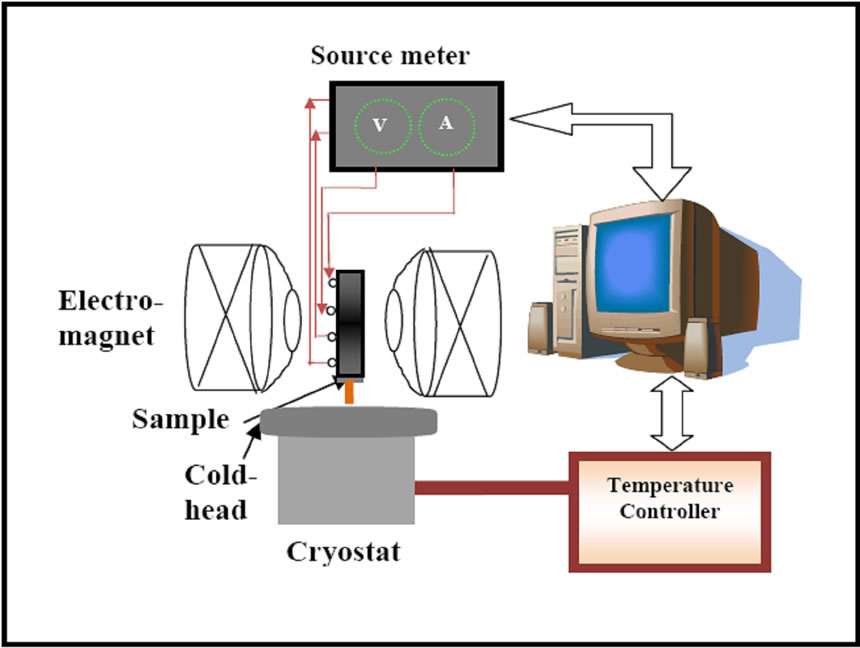
Figure 1. Schematic diagram of four-probe set up for resistance and magnetoresistance measurement (not according to scale)
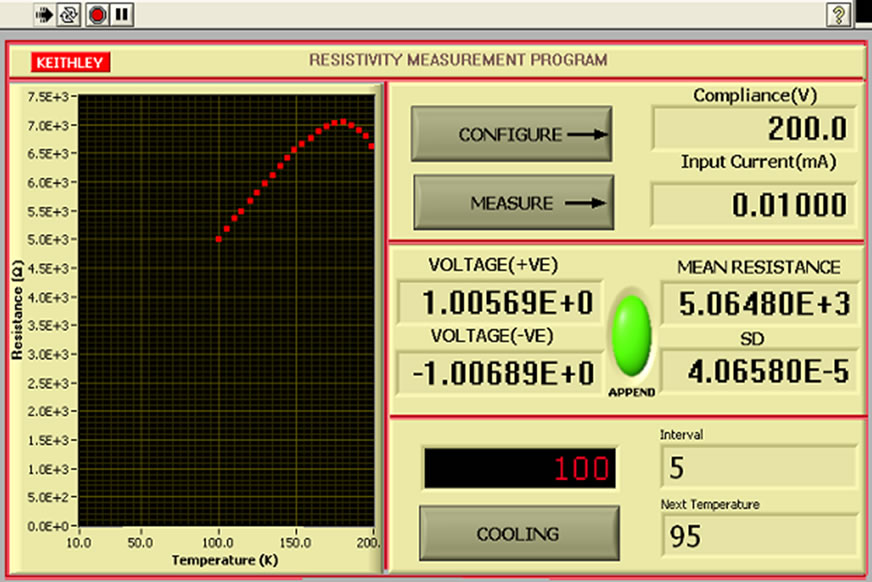
Figure 2. Front panel of VI for resistivity measurement
 (a)
(a) (b)
(b) (c)
(c)
Figure 3. Block Diagram of the VI-circuit for (a) configuring the sourcemeter; (b) four wire resistance measurement and (c) temperature recording
In one of the previous reports [13] we find that the data of such samples can be fitted well assuming random network of resistances with two types of resistivities. According to them, the  data can be analysed assuming random network of resistances with two types of resistivities–one more resistive (
 ) than the other (
 ) as considered by Rao et al. [13]. These two resisivities,
  [14] and
  [15], are temperature dependent but independent of each other. Total resistivity
  can be expressed as:
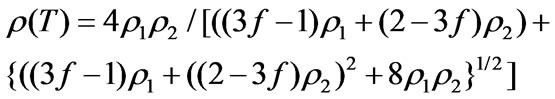 (1)
(1)
For these samples as the broad hump observed in  is due to a bond percolation because of the broken
  linkage, it could be well described by a temperature independent metallic volume fraction (
 ). The corresponding best fit line is shown by red colour in Figures 4(a)-(b). It is observed that the metallic behaviour dominates in the lower temperature region whereas the insulating behaviour, in the higher temperature region. A crossover is occurred at an intermediate temperature resulting in a M-I transition.
5. Conclusions
The authors have designed VI for measuring temperature

Figure 4. Resistivity and MR as a function of temperature at 0 and 1 T applied field. Solid symbols represent the data points while best fitted curves using “(1)” are shown by red colour
dependent resistance using LabVIEW program. In order to verify the measured data of some standard CMR samples using this VI, a systematic study of electrical resistivity of LCMO and LSMO was undertaken as a function of temperature (10–300 K) and in presence of magnetic field of strength 0 T and 1 T. The results obtained by the VI are satisfactory. Such automation allows the users to run the tests without human assistance and includes high efficiency since human errors are avoided and repeatability is more easily achieved.
6. Acknowledgements
S. Keshri gratefully acknowledges University Grants Commission, India and Department of Science and Technology, India for financial assistance. L. Joshi and S. K. Mukherjee also gratefully acknowledge Council of Scientific and Industrial Research, India for providing fellowship.
REFERENCES
- National Instruments Application Notes, LabVIEW. http://www.ni.com/LabVIEW
- J. Travis and J. Kring, “LabVIEW for Everyone: Graphical Programming Made Easy and Fun,” 3rd Edition, Prentice Hall, Berlin, 2006.
- R. von Helmolt, J. Wecker, B. Holzapfel, L. Schulz and K. Sammer, “Giant Negative Magnetoresistance in Perovskitelike La2/3Ba1/3MnOx Ferromagnetic Films,” Physical Review Letters, Vol. 71, No. 14, 1993, pp. 2331-2333.
- C. N. R. Rao and B. Raveau, “Colossal Magnetoresistance, Charge Ordering and Related Properties of Manganese Oxides,” World Scientific, Singapore, 1998.
- P. Schiffer, A. P. Ramirez, W. Bao and S.-W. Cheong, “Low Temperature Magnetoresistance and the Magnetic Phase Diagram of La1-xCaxMnO3,” Physical Review Letters, Vol. 75, No. 18, 1995, pp. 3336-3339.
- S. P. Isaac, N. D. Mathur, J. E. Evetts and M. G. Blamire, “Magnetoresistance of Artificial La0.7Sr0.3MnO3 Grain
- Boundaries as a Function of Misorientation Angle,” Applied Physics Letters, Vol. 72, No. 16, 1998, pp. 2038-2040.
- V. Dayal and S. Keshri, “Structural and Magnetic Properties of La0.67Ca0.33Mn(1-x)FexO3 (x= 0-0.07),” Solid State Communications, Vol. 142, No. 1-2, 2007, pp. 63- 66.
- J.-H. Miao, S.-L. Yuan, G.-M. Ren, G.-Q. Yu, Y.-Q. Wang and S.-Y. Yin, “Enhancement of Room Temperature Magnetoresistance in (1−x)La0.67Sr0.33 MnO3/xSb2O5 Composites,” Journal of Physics D: Applied Physics, Vol. 39, No. 14, 2006, pp. 2897-2901.
- C.-H. Yan, Y.-H. Huang, X. Chen, C.-S. Liao and Z.-M. Wang, “Improvement of Magnetoresistance over a Wide Temperature Range in La2/3Sr1/3MnO3/Polymer Composites,” Journal of Physics: Condensed Matter, Vol. 14, No. 41, 2002, pp. 9607-9614.
- V. Kulkarni, K.R. Priolkar, P.R. Sarode, R. Rawat, A. Banerjee and S. Emura, “Effect of Ti4+ Substitution on Structural, Transport and Magnetic Properties of La0.67 Sr0.33Mn1−xTixO3,” Journal of Physics: Condensed Matter, Vol. 20, No. 7, 2008, pp. 1-12.
- L. Malavasi, M. C. Mozzati, C. B. Azzoni, G. Chiodelli and G. Flor, “Role of Oxygen Content on the Transport and Magnetic Properties of La1-xCaxMnO3+δ Manganites,” Solid State Communication, Vol. 123, No. 8, 2002, pp. 321-326.
- G. Venkataiah, V. Prasad and P. V. Reddy, “Effect of Sintering Temperature on Electrical Transport Properties of La0.67Ca0.33MnO3,” Journal of Alloys and Compounds, Vol. 429, No. 91, 2007, pp. 1-9.
- G. H. Rao, J. R. Sun, Y. Z. Sun, Y. L. Zhang and J. K. Liang, “Magnetoresistance Behaviour of La1−xCaxMnO3 Compounds,” Journal of Physics: Condensed Matter, Vol. 8, No. 29, 1996, pp. 5393-5400.
- G-M Zhao, V. Smolyaninova, W. Prellier and H. Keller, “Electrical Transport in the Ferromagnetic State of Manganites: Small-Polaron Metallic Conduction at Low Temperatures,” Physical Review Letters, Vol. 84, No. 26, 2000, pp. 6086-6089.
- T. Holstein, “Studies of Polaron Motion: Part II, The “Small” Polaron,” Annals of Physics, Vol. 8, No. 3, 1959, pp. 343-389.