Int'l J. of Communications, Network and System Sciences
Vol. 5 No. 5 (2012) , Article ID: 19485 , 8 pages DOI:10.4236/ijcns.2012.55036
Link Stress Reduction against Bursty Arrivals of Content Requests
Department of Computer Science and Engineering, Fukuoka Institute of Technology, Fukuoka, Japan
Email: ykenichi@facebook.com, oida@fit.ac.jp
Received March 5, 2012; revised March 29, 2012; accepted April 16, 2012
Keywords: Social Optimization; Content Delivery; Hypercube Overlay; Server Assignment; Link Stress
ABSTRACT
Content delivery networks are designed to extend the end-to-end transport capability of the Internet to cope with increases in video traffic. For further improvement, bursty request arrivals should be efficiently addressed. As opposed to previous approaches, in which the best client-server pair is individually selected (individual optimization), this paper proposes an algorithm for dealing with simultaneous arrival requests, in which client-server pairs are selected such that all requests receive good service (social optimization). The performance of the proposed algorithm is compared with that of the closest algorithm, an individual optimization algorithm, under the condition that a large number of requests arrive simultaneously. The evaluation criterion is the worst link stress, which is the largest number of streams per link. The numerical results show that the proposed algorithm is effective for large-scale networks and that the closest algorithm does not provide near-optimal solutions, especially when all requests arrive in a small part of the network or when there are many servers.
1. Introduction
Video traffic will be increasingly prevalent on the Internet. According to Cisco’s traffic forecast for 2009-2014, global IP traffic is expected to increase by 34% per annum, and much of the increase is attributed to the delivery of video data [1]. Video traffic typically consumes a large amount of network bandwidth for a long time. Furthermore, some video content providers such as YouTube have begun to provide high-definition video streaming services. It is fully anticipated that even more efficient and scalable video delivery schemes will be required.
The video delivery approach based on peer-to-peer (P2P) networking is currently popular since this yields several advantages such as resource scalability, network path redundancy, and self organization [2,3]. A large number of P2P-based video delivery techniques are now available, and some are used for commercial purposes [4,5]. Nevertheless, the P2P systems still pose some challenges such as resilience, underlay awareness, and security [6,7]. Meanwhile, content delivery networks (CDNs) have evolved to improve the scalability and reliability of Web sites, and their focus has shifted to media delivery. CDNs extend the end-to-end transport capability of the Internet by employing techniques designed to optimize content delivery. Typical techniques are Web caching, serverload balancing, and request routing [8]. This paper focuses on the CDN server assignment scheme that prevents congestion when bursts of requests arrive.
Most commercial CDN providers, such as Akamai and Limelight Networks, follow the overlay approach in which servers and caches distributed over the network manage content delivery. The underlay network components (e.g., routers) play no active role in content delivery. There are two classes of overlays: unstructured and structured [9]. Structured overlays, which are organized with specific topologies, are relatively complex, whereas routing and searching operations tend to be efficient. Some frequently used overlay topologies are trees [10], rings [11], meshes [12,13], and hypercubes [14,15]. The hypercube overlay considered in this paper has attractive topological properties for video delivery: low node degree, small network diameter, recursive construction, and independent paths [14].
Previous server assignment approaches are classified as individual optimization, which selects individually the best client-server pair in terms of the number of hops, the round-trip time, and/or the server and network loads [16- 19]. In the case of bursty request arrivals (flash crowd), however, individual optimization may not lead to social optimization, which provides good service quality for all requests. Some queueing models show that they do not agree under heavy loads [20-22]. This paper formulates an optimization problem and then proposes a social optimization algorithm. The numerical results show that the proposed algorithm is effective, especially when all requests arrive in a small part of the network or when there are many servers.
This paper is organized as follows: Section 2 defines the routing rules in the hypercube overlays. Section 3 specifies the content delivery model and then formulates the server assignment problem. Section 4 proposes a heuristic algorithm for the problem. Section 5 compares the performances of the proposed algorithm and an individual optimization algorithm under the condition that a large number of requests arrive simultaneously. Finally, Section 6 presents the conclusions.
2. Hypercube Routing
This section defines the routing in the hypercube overlays. The K-dimensional hypercube has 2K nodes and  edges [23]. Each node corresponds to a K-bit binary string (node ID), and two nodes are linked with an edge if their node IDs differ in precisely one bit. As a consequence, each node is adjacent to K other nodes, one for each bit position, and the number of hops between any two nodes does not exceed K. Figure 1 illustrates a three-dimensional hypercube. Another important feature of the hypercube is independent routes [24]. Let i and j be any two nodes of a K-hypercube. There are K independent paths between i and j, and their lengths are less than or equal to
 , where
  stands for the Hamming distance between nodes i and j.
Routing on the hypercube is simple and does not require routing tables. This is because any two nodes whose node IDs differ in one bit are connected. In the case of a three-dimensional hypercube, for example, if node 000 needs to transmit packets to node 011, since nodes 010 and 001 are directly connected to nodes 000 and 011, there are two shortest-hop paths: 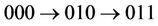 and
and 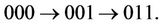 To fix a route for each pairing of source and destination, we assume that only the first path is used. In other words, if the node IDs of the source and destination are
  and
and , respectivelythen the source selects node
  for the next hop if
  and
and  for
for .
.
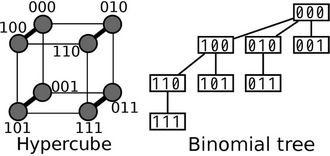
Figure 1. Three-dimensional hypercube and binomial tree rooted at node 000.
If all nodes obey this routing rule, routing paths from a source node to the other nodes are deterministically given. The binomial tree [25] in Figure 1 represents the routing paths from node 000 to all other nodes in the three-dimensional hypercube. The figure also shows that the number of hops does not exceed three along any path. Hereinafter, the term binomial tree refers to the routing paths from the root node to all other nodes. The binomial tree rooted at node 101 can be derived by XORing every node ID in Figure 1 with 101.
3. Server Assignment
3.1. Content Delivery Model
Let us consider a content delivery system consisting of origin servers and surrogate servers connected in a hypercube overlay. The origin servers have the definitive version of the content. The surrogate servers, which are located close to users and receive content requests, store a copy of the content. Through the interaction among the surrogates, one of the surrogates gives content to a user if possible; otherwise (i.e., for a cache miss), the requested content is delivered from an origin to the user via the surrogate that received the request.
In this model, at any instant in time, any node in the hypercube acts as one of the three types of servers:
1) An origin server
2) A surrogate server that is relaying a stream from an origin to a user or that has just received a request which causes a cache miss
3) A surrogate server that does not need to interact with origin servers.
Hereinafter, we refer to a server of the first type as a server, a server of the second type as a client, and a user request that causes a cache miss as a request (i.e., this paper regards a server of the second type as a client that is served by a server of the first type).
Let S and C denote sets of servers and requests, respectively. Simultaneous request arrivals are dealt with under the condition that , here
  and
and . The request partitioning problem considered is to assign requests to multiple servers in such a way that the quality of the assignment is maximized on the basis of the following assumptions:
1) Partitioned sets  are non-overlapping, where
  is a request set assigned to server i.
2) Servers may have different processing capabilities (see Subsection 3.3).
3) For each request, one stream is delivered from a server to the user via the client that received the request.
4) Requests may be preassigned to a server (see Subsection 3.3).
3.2. Worst Link Stress
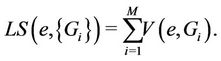
The quality of the assignment is measured using the worst link stress. Assume that  is given and that all requests in C are receiving delivery service. Then the number of streams on each hypercube link can be determined. Let
  be the number of streams on link e that originate from server i for serving all requests in
 . The link stress (LS) of link e represents the number of streams on the link and is given by
 (1)
(1)
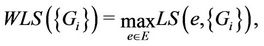
The worst link stress (WLS) is the greatest link stress of all links in the hypercube. Strictly, WLS is given by
 (2)
(2)
where E is the set of all links in the hypercube.
Let us calculate WLS using the binomial tree in Figure 1 under the condition that  and two requests arrive simultaneously at nodes 101 and 111. In this case,
  and
and . According to Figure 1, there are four links used for stream delivery:
 where
where  indicates the link between nodes i and j. Since
 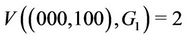 and
and
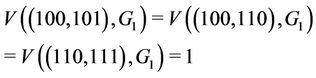
from (2) we have . The WLS indicates the degree of congestion since congestion typically occurs at links where a large number of streams are flowing. In order to obtain a small WLS value, traffic concentration on any single link must be avoided. Table 1 lists the definitions of symbols used frequently in this paper.
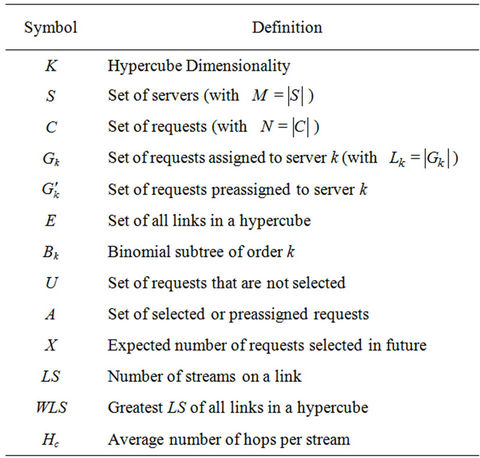
Table 1. Symbols used frequently in this paper.
3.3. Optimization Problem
The request partitioning problem P is formulated as follows:
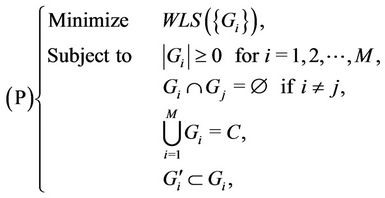 (3)
(3)
where  is the set of requests preassigned to server i.
When C has changed due to bursty arrivals, a new partition  must be calculated. If server k is providing service for request c when a new partition must be calculated, the partition is obtained under the condition that
 . The preassignment may also be used for reducing interdomain traffic.
Servers may not have the same processing capability. Let  be the number of requests assigned to server i (i.e.,
 ) and let
  be the processing capacity of server i. To balance the load among heterogeneous servers,
  should increase with
 . Therefore,
  should be determined such that
 .
.
4. Proposed Algorithm
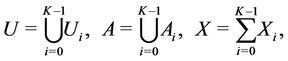
Each server k has two sets U and A, which are the set of requests not selected and the set of requests either selected by server k or preassigned to server k, respectively. Note that A depends on server k but U does not. The algorithm proposed for solving the optimization problem P is specified as follows:
1) At every server k in set S the algorithm starts with
 and
and .
.
2) Each server k in turn selects one request from set U in an arbitrary order according to Algorithm 4. If server k selects request c, then Algorithm 4 updates U and  such that c is removed from U and added to A.
3) After the selection, server k informs the other servers about what has been selected so that each uses the information to update its own set U.
4) The algorithm ends at server k if . At that point in time,
 .
.
Algorithm 4 is based on the following proposition:
Proposition 1. The WLS is the LS of a link connecting the root to a binomial subtree if .
.
Proof. Assume that the number of streams on link  in subtree B is greater than the number of streams from the root to the subtree. Then, at least one of the streams on link
  does not stem from the root. This contradicts the third assumption in Subsection 3.1.
Figure 2 shows binomial subtrees  where
where  (a binomial subtree of order k) is a k-dimensional hypercube rooted at a node that is directly connected to the root (node 0000). The proposition suggests that WLS be produced by one of the four links connecting the root produced by one of the four links connecting the root and the subtrees. Therefore, traffic load should be balanced among these links. The load balancing, however, is not easy since a decision made by one server affects the other servers’ decisions.
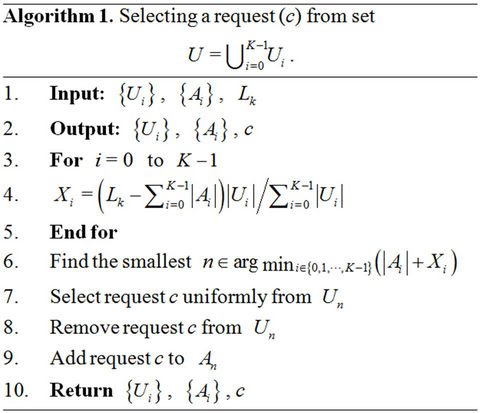
The following explains Algorithm 4: Let X be the number of requests that server k is expected to select in future. Tuple  is partitioned into K tuples
 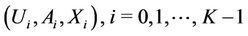 , based on where requests come from (see Figure 3). Therefore,
 (4)
(4)
where  and
and  if
if . Note that each server has different K tuples
 .
.
The expected number  is obtained as follows: Assume that server k uniformly selects
  requests at a time. Then, the number of selected requests from subtree
  has a hypergeometric distribution with mean
  . We adopt the mean as
 ; that is, for
 ,
,
 (5)
(5)
To balance the load, Algorithm 4 selects a request from  if
if
 (6)
(6)
The load balancing means that ,
,  , are almost the same when the algorithm finishes execution. If (6) holds, the final
  value is probably small; therefore, the server immediately raises
  before
  becomes an empty set. If two or more integers n satisfy (6), the smallest integer is used.
5. Performance Comparisons
This section compares the performances of three algorithms: the random, closest, and proposed algorithms. In all of these algorithms, each server k in set S in turn selects one request in an arbitrary order until the number of requests that server k must serve reaches . In the random algorithm, one request is selected uniformly from those not selected yet. In the closest algorithm, each server selects a request coming from the closest client, where the distance between server s and client c is measured by the number of hops from s to c. If there is more than one such request, a request from a client in the lowest order subtree is selected.
The closest algorithm is an individual optimization algorithm since it yields the closest client-server pairs one by one. In this simultaneous arrival scenario, the term closest indicates not only the lowest hop count but also the lowest round-trip time, since there are no ongoing streams when requests arrive.
Table 2 lists the default parameter values. For each 3- tuple , 10,000 calculations are performed. All of the algorithms are impartially evaluated by using the same node IDs for the M servers and N clients that receive user requests. These IDs are uniformly selected unless otherwise mentioned. Every server handles the same number of requests (i.e.,
 ) and there are no preassigned requests (i.e.,
  for all k).
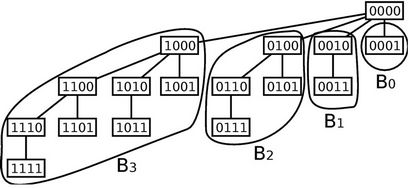
Figure 2. A binomial tree in the four-dimensional hypercube includes four binomial subtrees: B0, B1, B2, B3.
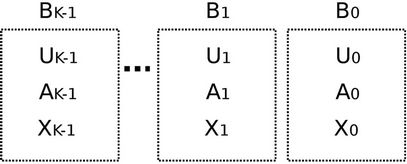
Figure 3. Tuple (U, A, X) is partitioned into K tuples (Ui, Ai, Xi) based on where requests come from.
5.1. Dimensionality
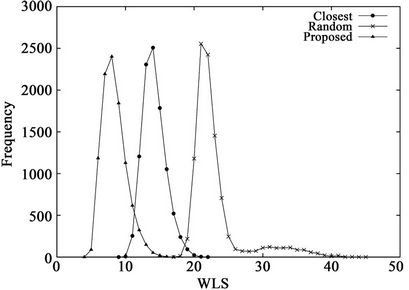
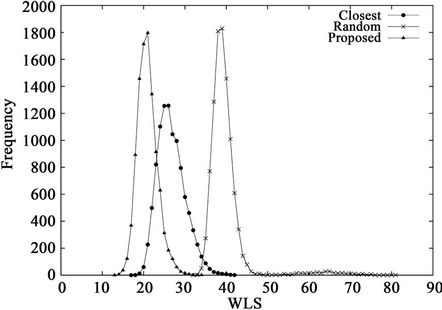
Figure 4 shows the frequency distributions of 10,000 calculated WLS values and Table 3 lists the means and standard deviations of the WLS distributions. These results demonstrate the effects of the dimensionality on the performance of the three algorithms. From Table 2, the percentages of the numbers of servers and clients in a hypercube are independent of the dimensionality K. From the figure, the proposed algorithm outperforms the other two algorithms, regardless of K. From Table 3, the mean and standard deviation of the random algorithm increase with K, while those of the closest algorithm stay roughly the same. In contrast, by using the proposed algorithm, the mean and standard deviation decrease with K. As a result, the largest WLS of the proposed algorithm also decreases with dimensionality K, as shown in Figure 4. These results indicate that the proposed algorithm is effective for large-scale hypercubes.
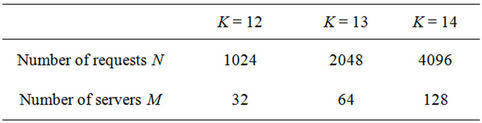
Table 2. Default parameter values used in calculations.
 (a)
(a)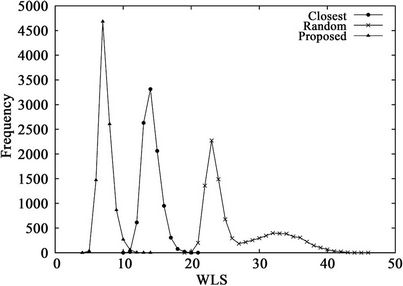 (b)
(b)
Figure 4. WLS distributions for three algorithms when (a) K = 12 or (b) K = 14.
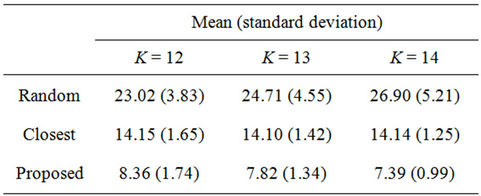
Table 3. Means and standard deviations of WLS distributions.
 (a)
(a)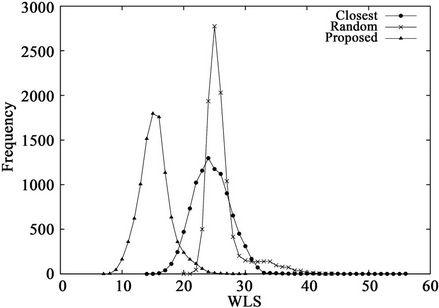 (b)
(b)
Figure 5. WLS distributions for three algorithms when K = 12 and the request set is (a) C1 or (b) C3.
5.2. Client Distribution
Let  be the number of hops from node
  to the client that receives request c. Let us consider three request sets
 ,
,  , and
, and  that satisfy
  and the following conditions:
•  if
if .
.
•  if
if .
.
•  if
if .
.
All requests in  arrive at clients that are located close to node
 .
.
Figure 5 shows the WLS distributions and Table 4 lists their means and standard deviations for the three sets. From the table, the proposed algorithm yields the smallest means and standard deviations for all request sets. By contrast, the WLS of the closest algorithm is highly sensitive to the request set. As shown in Table 5, when set  is used, the means for the random and closest algorithms are very similar. Furthermore, as shown in Figure 5(b), the largest WLS of the closest algorithm is greater than that of the random algorithm. This result suggests that individual optimization strategies are vulnerable to spatially irregular arrivals.
5.3. Number of Servers
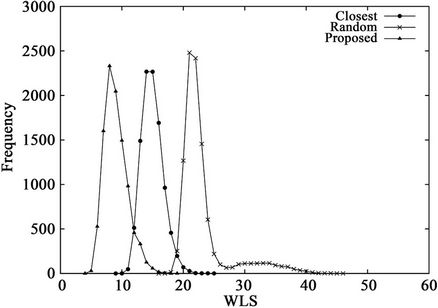
Figure 6 and Table 5 show the results when the number of servers M is varied. The results demonstrate that as M increases, the proposed algorithm becomes more useful than the closest algorithm. Note that all three algorithms are identical when . As M increases, the number of candidates of solution to problem P increases. The closest algorithm does not provide a near-optimal solution when a large number of candidates exist.
5.4. Resource Utilization
For efficient link resource utilization, the number of hops per stream should be as small as possible. We evaluate the three algorithms based on the average number of hops per stream ( ), which is given by
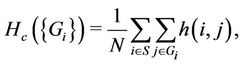 (7)
(7)
where  denotes the number of hops from server i to the client that receives request j. Table 6 lists the averages of 100 values of
 . For all three algorithms, the same server and request sets
  are used to obtain the average hop count
 .
.
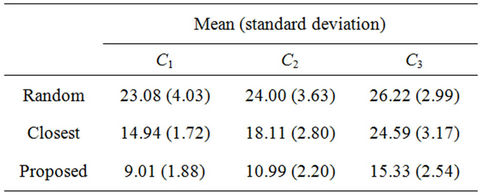
Table 4. Means and standard deviations of WLS distributions when K = 12.
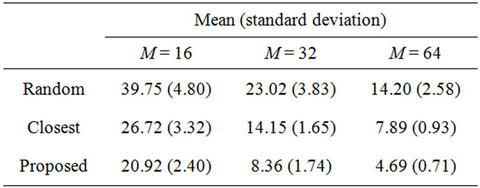
Table 5. Means and standard deviations of WLS distributions when K = 12.
 (a)
(a)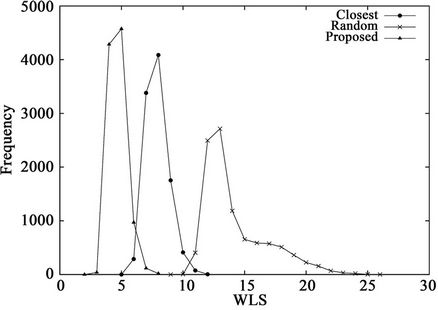 (b)
(b)
Figure 6. WLS distributions for three algorithms when K = 12 and (a) M = 16 or (b) M = 64.
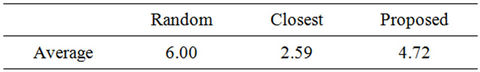
Table 6. Averages of 100 values of Hc when K = 12.
The hop count  for the closest algorithm indicates the lower bound. From the table, the average hop counts of the proposed and random algorithms are greater than that of the closest algorithm by 2.12 and 3.41 hops, respectively. In other words, the number of resources used by the proposed or random algorithm is 1.82 or 2.32 times larger, respectively, than that used by the closest algorithm.
Figure 7 shows the histogram of the average of 100 link stresses. Figure 7 and Table 6 are obtained under the same conditions; i.e., the same server and request sets  are used. From the figure, the essential difference between the proposed and closest algorithms is that the number of low-stress links (e.g.,
 ) of the closest algorithm is significantly smaller than that of the proposed algorithm. This result indicates not only how the closest algorithm achieves the low average hop count
  but also that the algorithm does not make good use of a large number of low-stress links.
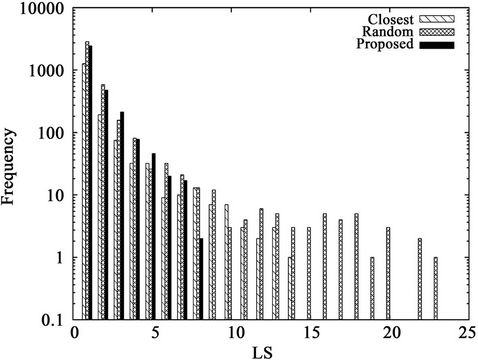
Figure 7. A histogram of the average link stress.
6. Conclusions
Video traffic on the Internet is expected to continue to grow in the near future, making the development of more scalable video delivery schemes indispensable. In particular, bursty request arrivals should be efficiently addressed. Previous server assignment approaches in the content delivery networks can be classified as individual optimization; i.e., the best client-server pair is individually selected. This paper considered the assignment problem with hypercube overlays from the viewpoint of social optimization, which provides good service quality for all simultaneous arrival requests. We first formulated an optimization problem and then derived a heuristic algorithm for the problem.
We compared the performances of three algorithms (the proposed, closest, and random algorithms) based on the worst link stress (WLS), which indicates the degree of network congestion. To clarify the advantages of the social optimization approach, we considered the case in which a large number of requests arrive simultaneously. In this arrival scenario, the closest algorithm is an individual optimization algorithm in terms of not only the hop count but also the round-trip time. The following results were obtained through evaluations:
• The proposed algorithm was effective for large-scale networks because both the mean and standard deviation of the WLS distribution decreased as the hypercube dimensionality increased.
• The closest algorithm did not provide near-optimal solutions when all requests arrived in a small part of the network or when there were many servers.
• The number of low-stress links of the closest algorithm was significantly less than that of the proposed algorithm. This result indicates that the algorithm does not make good use of a large number of lowstress links.
REFERENCES
- “Cisco Visual Networking Index: Forecast and Methodology, 2009-2014,” 2012. http://www.slideshare.net/jimkaskade/cisco-visual-networking-index-forecast-and-methodology-200914
- N. Ramzan, E. Quacchio, T. Zgaljic and F. Rovati, “Peer-to-Peer Streaming of Scalable Video in Future Internet Applications,” IEEE Communications Magazine, Vol. 49, No. 1, 2011, pp. 128-135. doi:10.1109/MCOM.2011.5723810
- K. Pussep, S. Oechsner, O. Abboud, M. Kantor and B. Stiller, “Impact of Self-Organization in Peer-to-Peer Overlays on Underlay Utilization,” 4th International Conference on Internet and Web Applications and Services, Venice, 24-28 May 2009, pp. 84-89. doi:10.1109/ICIW.2009.20
- PPlive Website, 2011. http://www.pplive.com/
- Zattoo Website, 2011. http://www.zattoo.com/
- O. Abboud, K. Pussep, K. Mohr, A. Kovacevic, S. Kaune and R. Steinmetz, “Enabling Resilient P2P Video Streaming: Survey and Analysis,” Multimedia Systems, Vol. 17, No. 3, 2011, pp. 177-197. doi:10.1007/s00530-011-0229-x
- S. Tonnies, B. Kohncke, P. Hennig, I. Brunkhorst and W.-T. Balke, “A Service Oriented Architecture for Personalized Universal Media Access,” Future Internet, Vol. 3, No. 2, 2011, pp. 87-116. doi:10.3390/fi3020087
- R. Buyya, M. Pathan and A. Vakali, “Content Delivery Networks,” 1st Edition, Springer Publishing Company, Incorporated, Berlin, 2008. doi:10.1007/978-3-540-77887-5
- S. Tarkoma, “Overlay Networks,” CRC Press, London, 2010. doi:10.1201/9781439813737
- C. G. Plaxton, R. Rajaraman and A. W. Richa, “Accessing Nearby Copies of Replicated Objects in a Distributed Environment,” Proceedings of the 9th Annual ACM Symposium on Parallel Algorithms and Architectures, New York, 22-25 June 1997, pp. 311-320.
- I. Stoica, R. Morris, D. Liben-Nowell, D. R. Karger, M. F. Kaashoek, F. Dabek and H. Balakrishnan, “Chord: A Scalable Peer-to-Peer Lookup Protocol for Internet Applications,” IEEE/ACM Transactions on Networking, Vol. 11, No. 1, 2003, pp. 17-32. doi:10.1109/TNET.2002.808407
- A. Rowstron and P. Druschel, “Pastry: Scalable, Decentralized Object Location and Routing for Large-Scale Peer-to-Peer Systems,” Proceedings of the 18th IFIP/ ACM International Conference on Distributed Systems Platforms, Heidelberg, 12-16 November 2001, pp. 329- 350.
- B. Y. Zhao, J. Kubiatowicz and A. D. Joseph, “Tapestry: An Infrastructure for Fault-tolerant Wide-Area Location and Routing,” Computer Science Division (EECS), University of California, Oakland, 2001.
- E. Anceaume, F. Brasileiro, R. Ludinard and A. Ravoaja, “PeerCube: A Hypercube-Based P2P Overlay Robust against Collusion and Churn,” 2nd IEEE International Conference on Self-Adaptive and Self-Organizing Systems, Ann Arbor, 3-7 October 2008, pp. 15-24. doi:10.1109/SASO.2008.44
- S. C. Han and Y. Xia, “Network Load-Aware Content Distribution in Overlay Networks,” Computer Communications, Vol. 32, 2009, pp. 51-61. doi:10.1016/j.comcom.2008.09.021
- A. Shaikh, R. Tewari and M. Agrawal, “On the Effectiveness of DNS-Based Server Selection,” Proceedings of IEEE INFOCOM 2001 20th Annual Joint Conference of the IEEE Computer and Communications Societies, Anchorage, Vol. 3, 22-26 April 2001, pp. 1801-1810.
- S. Ratnasamy, M. Handley, R. M. Karp and S. Shenker, “Topologically-Aware Overlay Construction and Server Selection,” 21st Annual Joint Conference of the IEEE Computer and Communications Societies, New York, Vol. 3, 23-27 June 2002, pp. 1190-1199.
- M. Hofmann and L. R. Beaumont, “Content Networking: Architecture, Protocols, and Practice,” Morgan Kaufmann Publishers, San Francisco, 2005, pp. 129-134.
- C. M. Chen, Y. Ling, M. Pang, W. Chen, S. Cai, Y. Suwa and O. Altintas, “Scalable Request-Routing with NextNeighbor Load Sharing in Multi-Server Environments,” Proceedings of the 19th International Conference on Advanced Information Networking and Applications, IEEE Computer Society, Washington, 28-30 March 2005, pp. 441-446.
- C. E. Bell and S. Stidham Jr., “Individual versus Social Optimization in the Allocation of Customers to Alternative Servers,” Management Science, Vol. 29, No. 7, 1983, pp. 831-839. doi:10.1287/mnsc.29.7.831
- S. Shenker and A. Weinrib, “The Optimal Control of Heterogeneous Queueing Systems: A Paradigm for LoadSharing and Routing,” IEEE Transactions on Computers, Vol. 38, 1989, pp. 1724-1735. doi:10.1109/12.40850
- K. Oida and S. Saito, “A Packet-Size Aware Adaptive Routing Algorithm for Parallel Transmission Server Systems,” Journal of Parallel and Distributed Computing, Vol. 64, No. 1, 2004, pp. 36-47. doi:10.1016/j.jpdc.2003.07.008
- F. T. Leighton, “Introduction to Parallel Algorithms and Archtectures: Arrays, Trees, Hypercubes,” Morgan Kaufmann Publishers, Waltham, 1992.
- Y. Saad and M. Schultz, “Topological Properties of Hypercubes,” IEEE Transactions on Computers, Vol. 37, No. 7, 1988, pp. 867-872. doi:10.1109/12.2234
- T. H. Cormen, C. E. Leiserson, R. L. Rivest and C. Stein, “Introduction to Algorithms,” 3nd Edition, The MIT Press, Cambridge, 2001.