Int'l J. of Communications, Network and System Sciences
Vol.3 No.1(2010), Article ID:1172,5 pages DOI:10.4236/ijcns.2010.31005
Neural Network Based Missing Feature Method for Text-Independent Speaker Identification
Department of Electronic Science and Technology, University of Science and Technology of China, Hefei, China
E-mail: hapgel@mail.ustc.edu.cn, luwei@ustc.edu.cn
Received September 17, 2009; revised October 25, 2009; accepted November 29, 2009
Keywords: Speaker Identification, Missing Feature Reconstruction, Mask Estimation, Neural Network
Abstract
The first step of missing feature methods in text-independent speaker identification is to identify highly corrupted spectrographic representation of speech as missing feature. Most mask estimation techniques rely on explicit estimation of the characteristics of the corrupting noise and usually fail to work with inaccurate estimation of noise. We present a mask estimation technique that uses neural networks to determine the reliability of spectrographic elements. Without any prior knowledge of the noise or prior probability of speech, this method exploits only the characteristics of the speech signal. Experiments were performed on speech corrupted by stationary F16 noise and non-stationary Babble noise from 5dB to 20 dB separately, using cluster based reconstruction missing feature method. The result performs better recognition accuracy than conventional spectral subtraction mask estimation methods.
1. Introduction
Text-independent speaker identification performs well when background is free of noise. However, when the background noise increases, the recognition accuracy degrades. Many methods are proposed to deal with this problem.
Noisy speech recognition experiment shows that when corrupted element of speech is ignored, the recognition accuracy can increase. [1] Missing feature method has been proposed and shown promising performance compensating for additive noise regardless of its stationary [2,3]. The main idea of this method is that noise can affect time-frequency region of speech differently and the relative energy of speech and noise at each time-frequency will also differ. The region with high SNR is assumed as “reliable” while region with low SNR “corrupted” also called “missing”. We label the degree of reliability of all components in a spectrographic display of speech before recognition. This step plays a vital role in the final recognition.
Many mask estimation methods have shown good performance when the noise is stationary or varies slowly with time. One of them, spectral subtraction based mask estimation methods are used through estimation of local SNR from noise model [4]. However, this method fails with inaccurate estimation of noise.
In speech recognition, M. L. Seltzer proposed a Bayesian classifier for spectrographic mask estimation which can be free of assumption about the corrupting noise and resulted significant improvements over conventional noise estimation based mask techniques [5]. However, their mask estimator is performing sub-optimally as a result of assumptions made for the sake of expediency. For example, both voiced and unvoiced speech segment use a single prior probability to avoid computation costly.
In this paper we present neural network based mask estimation in the text-independent speaker identification that uses only the characteristics of speech to identify the reliability of each spectrographic element without any priority of the noise or prior probability of speech. As a result, masks can be obtained directly from neural networks which are trained from speech feature vectors.
This paper is organized as follows. In Section 2, we review one kind of missing feature methods used in this paper briefly. In Section 3, speech features are abstracted, and our proposed missing feature method is introduced. The experimental procedures and results are presented and discussed in Section 4. Finally, we summarize our works.
2. Missing Feature Methods
There are two main missing feature methods used today [6,7]. The first method is feature compensation method, which needs estimates of the corrupted components before recognition. The second one marginalization, a classifier compensation method, only uses incomplete logspectral vectors.
In this paper, we use cluster-based reconstruction [6], one of feature compensation methods, to evaluate our mask estimation performance.
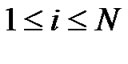
In the cluster-based reconstruction, the log-spectral vectors (Mel sub-band vectors) of a training corpus of clean speech are grouped into N cluster with K-means [8]. The distribution of each cluster is assumed to be Gaussian, as shown in (1):
 (1)
(1)
where y is the vector represents cluster i, d is the dimension of y and μ, θ are the mean and covariance of cluster i.
The steps of cluster-based reconstruction are as follows:
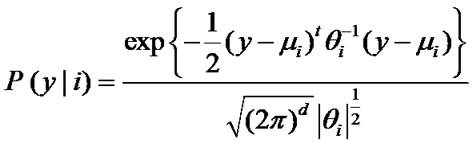
1) Identify to which cluster each corrupted log-spectral vectors belongs, that is, to each Gaussian model, compute the marginal probability of the reliable vector X0, as (2).
 (2)
(2)
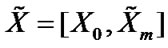
where P(k) is the prior probability of each cluster, Vector X0 is composed of the reliable elements of vector X; while vector Xm is composed of corrupted elements of X. P(X0|k) is the marginal probability of Gaussian model k.
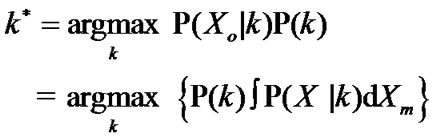
2) Combined with the parameters μk, Θkof the cluster k*, using the MAP to estimate the missing elements to get the vector 
 (3)
(3)
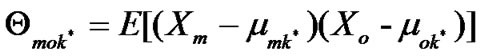
where μok*,Θook* represent the mean and covariance of the reliable elements in cluster k*, in the same cluster k*, μmk* is the mean of the corrupted elements, andΘmok* is the covariance of the reliable and unreliable elements.
 (4)
(4)
3) Replace the missing vectors with , we can get the whole vectors.
 (5)
(5)
Once the missing features are reconstructed, Mel-Frequency Cepstrum Coefficients (MFCC) can be extracted from the complete log-spectral vectors and pass them to the recognition system.
Before reconstruction, masks labeling the reliability of spectrographic elements of speech should be estimated accurately, which can affect reconstruction process and the final recognition accuracy. The reliable elements are labeled as “1”, while the corrupted ones are labeled as “0”. We reconstruct these corrupted spectrographic elements of speech with the above cluster-based reconstruction method.
3. Neural Network Based Missing Feature Method
In order to estimate masks without any priority of the noise or prior probability of speech, we use several speech features which can represent the characteristics of speech signal, to describe the effect of noise to speech. Since one kind of speech feature can not measure this effect accurately in each sub-band, we use four kinds of features to form a single vector in each frame and each sub-band of each voiced speech. In the following discussion, we can see that there are some relationships between the effect of noise and the reliability of spectrographic elements of speech. To link these relationships, we train a neural network to estimate the masks directly.
The mask estimation process consists of two main parts: 1) Feature extraction stage, where four features representing the incoming noisy speech are abstracted. 2) Classification stage, where a neural network is trained with feature vectors and ‘oracle’ masks.
3.1.1. Comb Filter Ratio
Voiced speech features in its harmonicity, while additive noise not. When speech is corrupted with noise, the ratio of the signal energy at the harmonics (voiced speech plus noise) and in between (noise) can measure the corrupted degree of clean speech.
We use an IIR comb filter to capture the harmonics of pitch and a kind of speech processing software Praat to get pitch accurately [9,10].
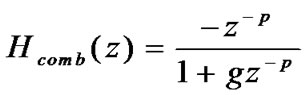 (6)
(6)
where p is the filter order, we get it by dividing sampling frequency (8 kHz) by the fundamental frequency; g is to regulate the sharpness of the comb filter. It was set to 0.7 empirically.
A shifted comb filter is to capture the energy between the harmonics.
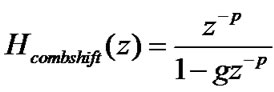 (7)
(7)
Noisy through these two filters, we can get the ratio of them [5]:
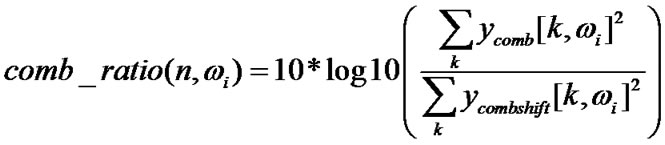
(8)
Ratio of the energy at harmonics and in between can indicate the noise in the speech, as shown in Figure 1.
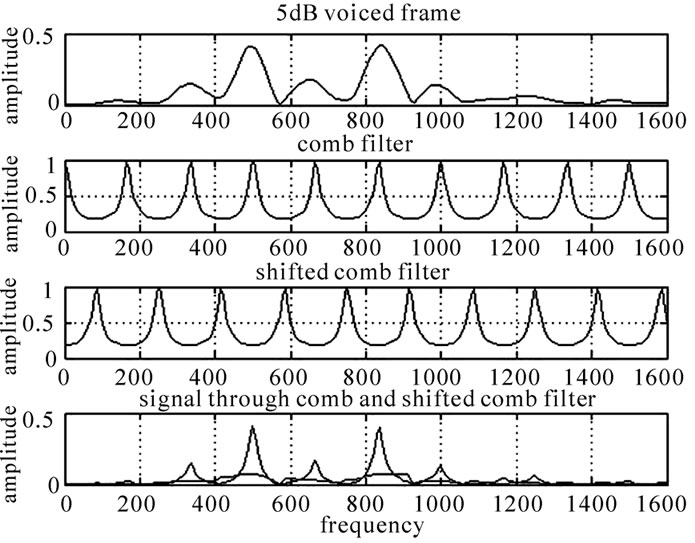
Figure 1. A 5dB voiced frame is corrupted by Babble noise. The first graph shows its amplitude spectrum, and the second one shows the comb filter which has peaks at harmonics with pitch 166.171Hz. The third one is a shifted filter. The last graph presents the voiced frame through comb (blue line) and shifted comb filter (red line).
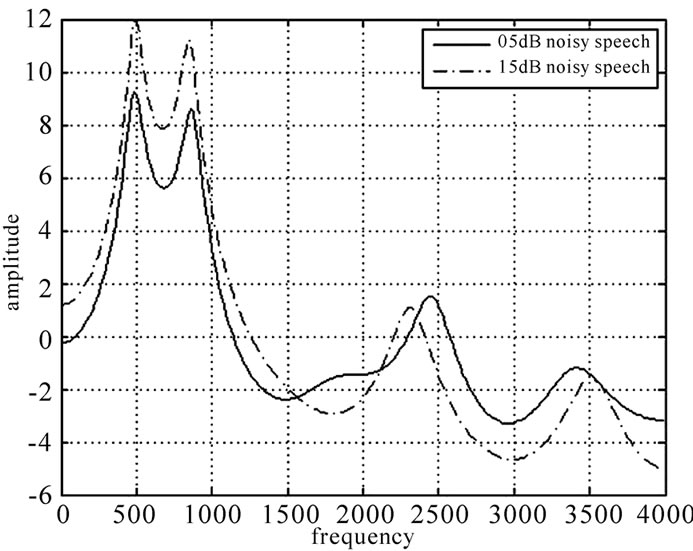
Figure 2. The spectrum of 05 dB (solid) and 15 dB (dotted) Babble corrupted voiced frame from LPC coefficients.
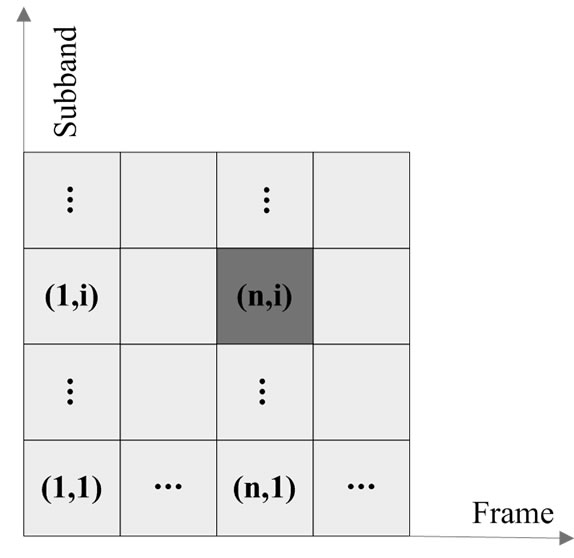
Figure 3. The spectrographic representation of speech.
3.1.2. Energy Ratio
Voiced speech has a certain spectral shape, a high energy at low frequency and low energy at high frequency. When it is corrupted by noise, its spectral shape will change. As shown in Figure 2, noise has more important effect on the valleys of spectrum than on the peaks. We can use the ratio of sub-band energy to full band energy to measure this effect.
3.1.3. Flatness
In Figure 2, we can also see that the valley in the spectrum of 5 dB noisy speech is flatter than cleaner one. For a given spectrographic location, we use eight neighboring areas to describe this variance [5]. The spectrographic representation of speech is described in Figure 3.
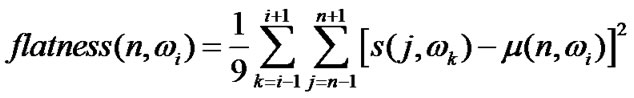 (9)
(9)
For the feature in the frame n and sub-band ωi, s(j,ωk) is the energy in frame j and sub-bandωk, and μ(n,ωi) is mean energy in this nine areas.
3.1.4. Kurtosis
Speech can be regarded as a super-Gaussian signal. When two super-Gaussian signals are combined, the kurtosis drops down [11]. In this paper, the clean speech and noise speech are assumed to have different kurtosis. We define kurtosis as following, where x is the speech signal in each frame of each sub-band [12].
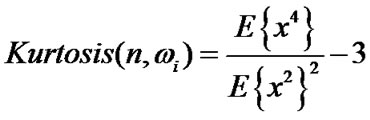 (10)
(10)
3.2. Neural Network Classification
Fours features abstracted above can be assumed to carry important information of reliability of speech. The classification of reliability is considered as a pattern recognition problem. A back-propagation neural network is applied. It consists of an input layer with four neurons (a vector composed of four features), a hidden layer with 7 neurons and an output layer with one neuron.
For training the neural network, mixtures of clean speech and noise were generated. The ‘oracle’ mask {1, 0} obtained from clean speech and noises are served as targets activities for output neuron. For cluster-based reconstruction, the SNR threshold for reliability is set to -5dB [7].
In order to evaluate the performance of neural network classifier, we compare our mask with ‘oracle’ and spectral subtraction mask. MSE in Figure 4 shows that for the 5dB Babble noisy speech, mask obtained from the trained neural network is better than the spectral subtraction technology. Thus this classification method is promising.
In the testing process, features abstracted from noisy
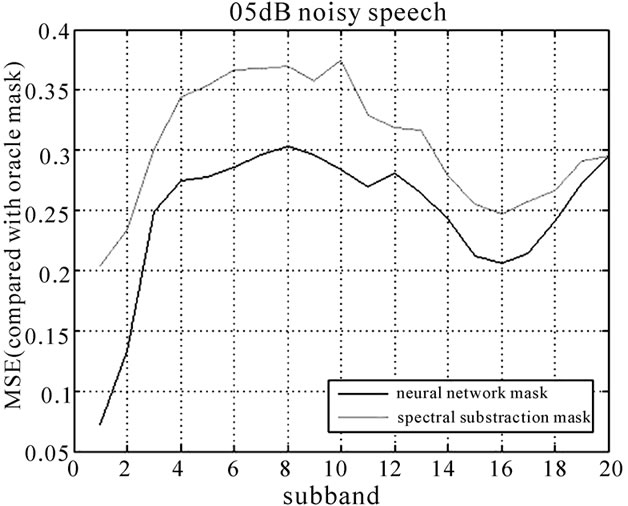
Figure 4. For 5dB Babble noisy speech, the comparison of mean square error (MSE) in each sub-band. Green line represents MSE between network mask and ‘oracle’ mask. Red line is MSE between spectral subtraction based mask and ‘oracle’ mask.
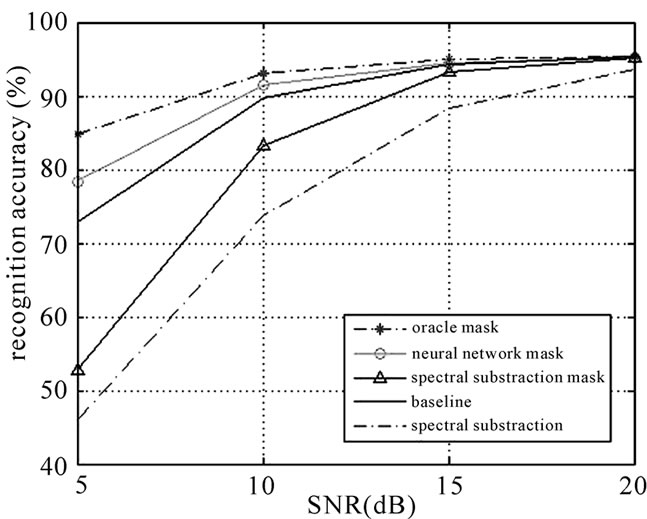
Figure 5. Recognition accuracy (Babble).
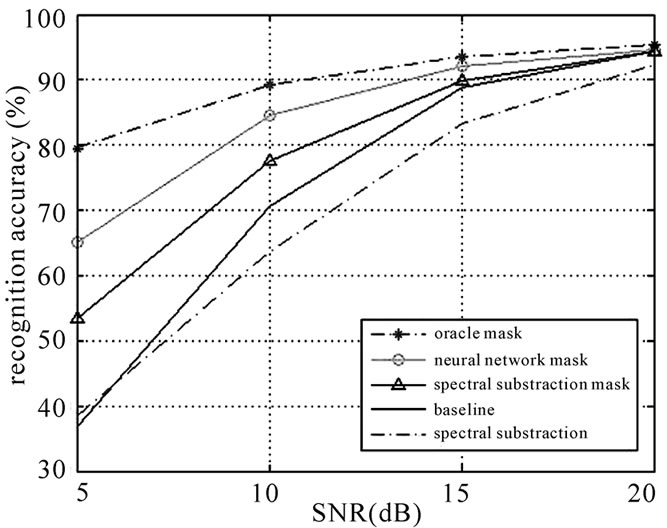
Figure 6. Recognition accuracy (F16).
testing speech were put into the trained neural network, and the output probabilistic mask with high value (>0.5) is labeled as reliable (1), and low value (≤0.5) as missing (0). Thus, we get our neural network mask only with the characteristics of speech, and without any assumption of noise and speech.
4. Experimental Results
We use the YOHO database to evaluate the performance of the proposed method in text-independent identification [13]. YOHO database is recorded in the office environment, each speech contains three lists and each list contains two numbers ( for example”32_43_89”).
The clean training corpus contains 58 people; each has 96 speeches (about 4-5 minutes). The clean testing corpus contains 55 people which are the same people in the training corpus; each person has 40 different speeches outside the training corpus. The original clean speech is used to get the ‘oracle’ mask. Both clean training and testing speeches are corrupted by stationary F16 noise and non-stationary Babble noise, from the NOISE92, to SNR at 5dB, 10dB, 15 dB and 20 dB levels.
Each speech is framed with 20ms Hamming windows and pre-emphasized filter to lifter the high frequency components, the overlap is 10ms. The silence and unvoiced frames of speeches are removed beforehand. After through FFT and 20 Mel filters, we can put abstracted features to trained neural network to estimate the mask of the noisy speech. Then, the reliable components of the speech are labeled to reconstruct the unreliable areas.
GMMs were trained with 32 dimensions MFCC including 16 MFCC and 16 delta MFCC using clean speeches in the training database. Each people’s GMM model has a mixture of 64 with diagonal covariance matrix. In the cluster-based reconstruction missing feature method, the number of the clusters is set to 128.
Noisy speeches used for the neural network training are selected by dividing 58 people’s noisy speeches into four parts, which are with local SNR 5dB, 10dB, 15dB, 20dB separately.
For Babble and F16 noise, baseline system is using only MFCC without missing feature theory. Spectral subtraction is used to compare the reconstruction missing feature method. It can improve the recognition accuracy, but in higher SNR ratio and non-stationary noisy environment, it is even worse than baseline. Cluster-based reconstruction missing feature method can improve the recognition ratio greatly.
We use a single system to evaluate the performance of proposed method. Three kinds of masks, ‘oracle’ mask, ‘neural network mask’ and ‘spectral subtraction mask’, are all combined with the cluster-based reconstruction mentioned in Section 2 respectively.
The recognition accuracy is shown in Figure 5, where we can see that for non-stationary Babble noise, not only spectral subtraction based mask is useless, but also is the spectral subtraction methods. While our proposed method is promising and close to ‘oracle’ mask. And for stationary F16 noise in Figure 6, spectral subtraction performs worse than baseline in higher SNR. And our proposed method still has better performance compared with spectral subtraction mask.
But when local SNR is close to 20dB, it can not effectively improve system performance, since the threshold which determines the reliability of speech is set to a lower value. This can make more components to be labeled as reliable, which is obviously corrupted by noise.
5. Conclusions
We use the neural network to estimate mask for missing feature reconstruction method in text independent speaker identification. Four features representing speech are discussed to train the neural network. The result shows that our proposed method can be free of any assumption about speech and noise, and it can be helpful in stationary F16 and non-stationary Babble noisy environment. This can provide us with a promising direction in the improvement of missing feature methods.
Further researches in this method can be carried on. Many other classifiers can be used in this situation, which can have different performances. And also, more features obtained from speech can be explored to characterize speech more precisely. These are our future works.
6. References
[1] M. P. Cooke, A. Morris, and P. D. Green, “Recognition occluded speech,” ESCA Tutorial and Workshop on Auditory Basis of Speech Perception, Keele University, July 15–19, 1996.
[2] A. Vizinho, P. Green, M. P. Cooke, and L. Josifovski, “Missing data theory, spectral subtraction and signal-tonoise estimation for robust ASR: An integrated study [C],” Proceedings of Sixth European Conference on Speech Communication and Technology, Eurospeech, Budapest, pp. 2407–2410, 1999.
[3] M. P. Cooke, P. Green, L. Josifovski, and A. Vizinho, “Robust automatic speech recognition with missing and uncertain acoustic data [J],” Speech Communication, pp. 267–285, 2001.
[4] A. Drygajlo and M. El-Maliki, “Speaker verification in noisy environments with combined spectral subtraction and missing feature theory [M],” Proceedings of IEEE ICASSP 98, Seattle, IEEE, USA, pp. 121–124, 1998.
[5] M. L. Seltzer, B. Raj, and R. M. Stern, “A Bayesian classifier for spectrographic mask estimation for missing feature speech recognition [J],” Speech Communication, Vol. 43, pp. 379–393, 2004.
[6] B. Raj, M. L. Seltzer, and R. M. Stern, “Reconstruction of missing features for robust speech recognition [J],” Speech Communication, Vol. 43, pp. 275–296, 2004.
[7] B. Raj, “Reconstruction of incomplete spectrograms for robust speech recognition [D],” Pittsburgh, ECE Department, USA, Carnegie Mellon University, 2000.
[8] Z. Q. Bian and X. G. Zhang, “Pattern recognition [M],” Tsinghua University, Beijing, pp. 235–237, 2000.
[9] R. J. Higgins, “Digital signal processing in VLSI, Englewood Cliffs,” Prentice Hall, NJ, 1990.
[10] http://www.fon.hum.uva.nl/praat/download_win.html
[11] J. P. Leblanc and P. L. De Leon, “Speech separation by kurtosis maximization,” Proceedings of ICASSP_98, 1998.
[12] J. P. Leblanc and P. L. De Leon, “Noise estimation techniques for robust speech recognition,” Proceedings of ICASSP’ 95, pp. 153–156, 1998.
[13] J. Campbell, “Testing with the YOHO CD-ROM voice verification corpus [C],” Proceedings of IEEE ICASSP. Detroit, USA, IEEE, pp. 341–344, 1995.