Journal of Water Resource and Protection
Vol.5 No.8(2013), Article ID:35837,15 pages DOI:10.4236/jwarp.2013.58081
DEM-Based GIS Algorithms and 3D Geospatial Mapping for Creation of Hydrogeological Models Data in Foussana Basin (Central Tunisia)
1Geomatic and Applied Structural Geology, Department of Geology, Faculty of Sciences of Tunis, University of Tunis El Manar, Tunis, Tunisia
2Minerals Resources and Environment Laboratory, Department of Geology, Faculty of Sciences of Tunis, Tunis El Manar, Tunisia
3Water, Energy and Environment Laboratory (LR3E), ENIS, Sfax, Tunisia 4Department of Geology, Faculty of Sciences of Meknès, University of Sciences of Moulay Ismail, Meknès, Maroc
Email: khemirisami_geo@yahoo.fr, chenini_ismail@yahoo.fr, salwa_saidi@yahoo.fr, baamar.grm@gmail.com, Abdallah.Benmammou@fst.rnu.tn, fouadzargouni@yahoo.fr
Copyright © 2013 Sami Khemiri et al. This is an open access article distributed under the Creative Commons Attribution License, which permits unrestricted use, distribution, and reproduction in any medium, provided the original work is properly cited.
Received June 1, 2013; revised July 1, 2013; accepted August 3, 2013
Keywords: DEM; GIS; Surface water; Groundwater; Modeling
ABSTRACT
There are many factors which affect the hydrological, geomorphologic and hydrogeological condition of the area. In order to better comprehend all processes, a Digital Elevation Model (DEM) was developed based on Geographical Information System. This latter appears as an essential tool to facilitate the decision support and can provide very important geological information. In fact, the use of the DEM is growing dramatically with the use of the GIS and the improvement of information extracted from elevation data such as mapping of floods, forest areas, erosion, and lineaments. The spatial distribution of topographic attributes can often be used as an indirect measure of the spatial variability of these processes and allows them to be mapped using relatively simple techniques. The main purpose of this study is to model the natural surface of the earth as the most accurate and the most precise. For this end we have tried in this work to develop various types of Digital Elevation Models DEM of the Foussana rift in Central Tunisia and to demonstrate the role of these models in geological, hydrogeological and hydrological study. The 3D model is also coupled in this study with piezometric and hydrochemistry study, so a new information’s plan was mapped by multiple GIS techniques like Spatial analysis and interpolation; in order 1) to comprehend the hydrodynamic of the aquifer, 2) to quantify surface and subsurface water resources and 3) to generate water management scenarios in the study area. To this end, several groundwater samples were collected and analyzed from wells and piezometers. Examining the corresponding physical and chemical parameters showed an increase in the concentrations of hydraulic conductivity in the center of the study area and it coincided with zones with high nutrient concentration. Recommendations are proposed in this zone.
1. Introduction
In recent years, the use of Geographical Information Systems (SIG) has increased considerably. Many researches were developed in order to represent the effects of threedimensional terrain on the flow processes and the spatial variability of hydrologic processes that affected the generation of stream flow in the Foussana Basin.
In particular, the Digital Elevation Model (DEM) is a determinant tool in the estimation of the distributed surface and subsurface characteristics. It can also reflect the flow characteristics and demonstrate the control exerted by topography on the movement of water within the landscape and the prediction of these flow characteristics.
In this study, we tend firstly to present a systematic treatment of digital elevation models, topographic and hydrographic mapping of Foussana watershed and the evolution of its water resources. GIS has allowed us a better understanding and effective use of the water cycle through the use and processing of contours, optical satellite images and radar. These maps and images are used for the generation of Digital Elevation Models by interpolation techniques and interferometry.
Mapping and management of accumulation zones of water runoff, drainage networks from DEMs have two objectives: on the one hand, the determination of descriptors topography (slopes, ridges, valleys, etc.), watersheds and their hydrologic parameters to map areas for runoff collection and their effective use; on the other hand, synthetic modeling of the geomorphology of watersheds and a better understanding and visualization of 3D geospatial aquifer levels Mio-Plio-Quaternary Foussana gap. This model can also predict the response of watershed and aquifer system to rainfall events and understand the evolution over time of its flow characteristics and quantification of water resources of Foussana basin. This is to direct future water management projects.
2. Presentation of the Study Area
The study area is located in the foreland of the Alps, in the western part of central Tunisia at the Tunisian Atlas [1]. It is limited in the East by Kasserine region; by Algeria in the west, by Sidi Bouzid region in the south and by Siliana region in the North.
This sector is characterized by a collapse basin due to tectonic phenomena essentially distensive phenomena in the bounding of this basin [2].
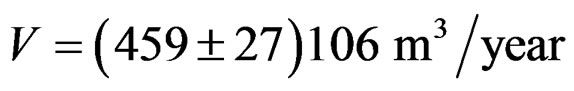
This basin is surrounded by folded structures, Jebel Semmama, Jebel Biréno, Jebel Hamra in the West [3], and Jebel Chambi in the East [4] (Figure 1).
The main outcrop that marks the watershed of Foussana is the quaternary alluvium which is surrounded by Cretaceous reef of deposits covering fold mountains bounding [5-8].
The Foussana watershed represents a part of the large set of hydrological Zroud Oued. This basin has a relatively streams, the most important is the Oued El Hatob which crosses the basin along its entire length and thus constitutes the main drain of this basin (Figure 2).
3. Methodology and Tools
DEM is a digital representation of the surface elevations [9]. It allows the evaluation of the altitude at any point. This assessment is based on an extrapolation of contours whose principle constituents are: the level lines are initially treated as a set of points, which each point is defined with an attribute elevation of the curve from which it comes. Then, by interpolation it is possible to determine the end of the altitude values between these points.
The interpolation is a way to generate information in zones which have no information about it [10]. It is the largest operation in the production of Digital Elevation Model. It determines, after a series of known values, the estimation of additional data in areas not sampled. This result is provided by the calculation and not by the observation.
According to Laurini (1991) [11], the Digital Elevation Model is the set of procedures to calculate the elevation (Z) of a point based on the neighboring points stored in a database.
For Aronoff (1993) [12], a Digital Elevation Model is defined as a set of locally distributed altimeter measurements over land surface, used for the analysis of the topographic surface.
The data needed to build a DEM can be derived from a variety of sources such as [13]:
• Measures of topography of land using the GPS• Scanning and digitizing topographic maps• Aerial photography• Imaging satellite.
There are four different representations of a Digital Elevation Model:
• Regular grid• Outlines• Triangulated grid• Triangulated Irregular Network (TIN).
A DEM can receive several shots of information from the main layer (altitudes), these plans concern mainly the geomorphology of the study area, the extraction of lineamentary network affecting this sector, hydrological parameters of the watershed, and the relationship between these factors. In this work we used two different GIS software:
The modules “space Analyst” and “3D Analyst” were used from to level of ArcGIS software to develop the DEM with a resolution of 10, 25, 50 and 100 m and then to choose the method of Triangulated Irregular Network TIN and used the method of “spline” that calculates the elevation between two points so as to minimize the curvature of the resulting surface.
A second DEM was developed under surfer Software who proposes an interpolation by kriging. It is a geostatistical method that is better for detecting the “trends” suggested by the terrain elevation data.
The accuracy of DEM has been accomplished by scanning feature points such as ratings points, peaks, ridges, valley bottoms and adapting the algorithms to the level of GIS software to force them to consider these points effectively as singular (Figure 3).
4. Acquisition and Results
4.1. Acquisition
The DEM was developed from digitized contour lines, spot heights and elevations of water points measured in the field by GPS. The used topographic maps are Berino, Semmama, Bou-Chebka and Kasserine at the scale of 1/50 000 that are scanned georeferenced and finally digitized. Then, GIS software has been used to interpolate the elevations to obtain the appropriate DEM.
Interpolation is the largest operation in the production
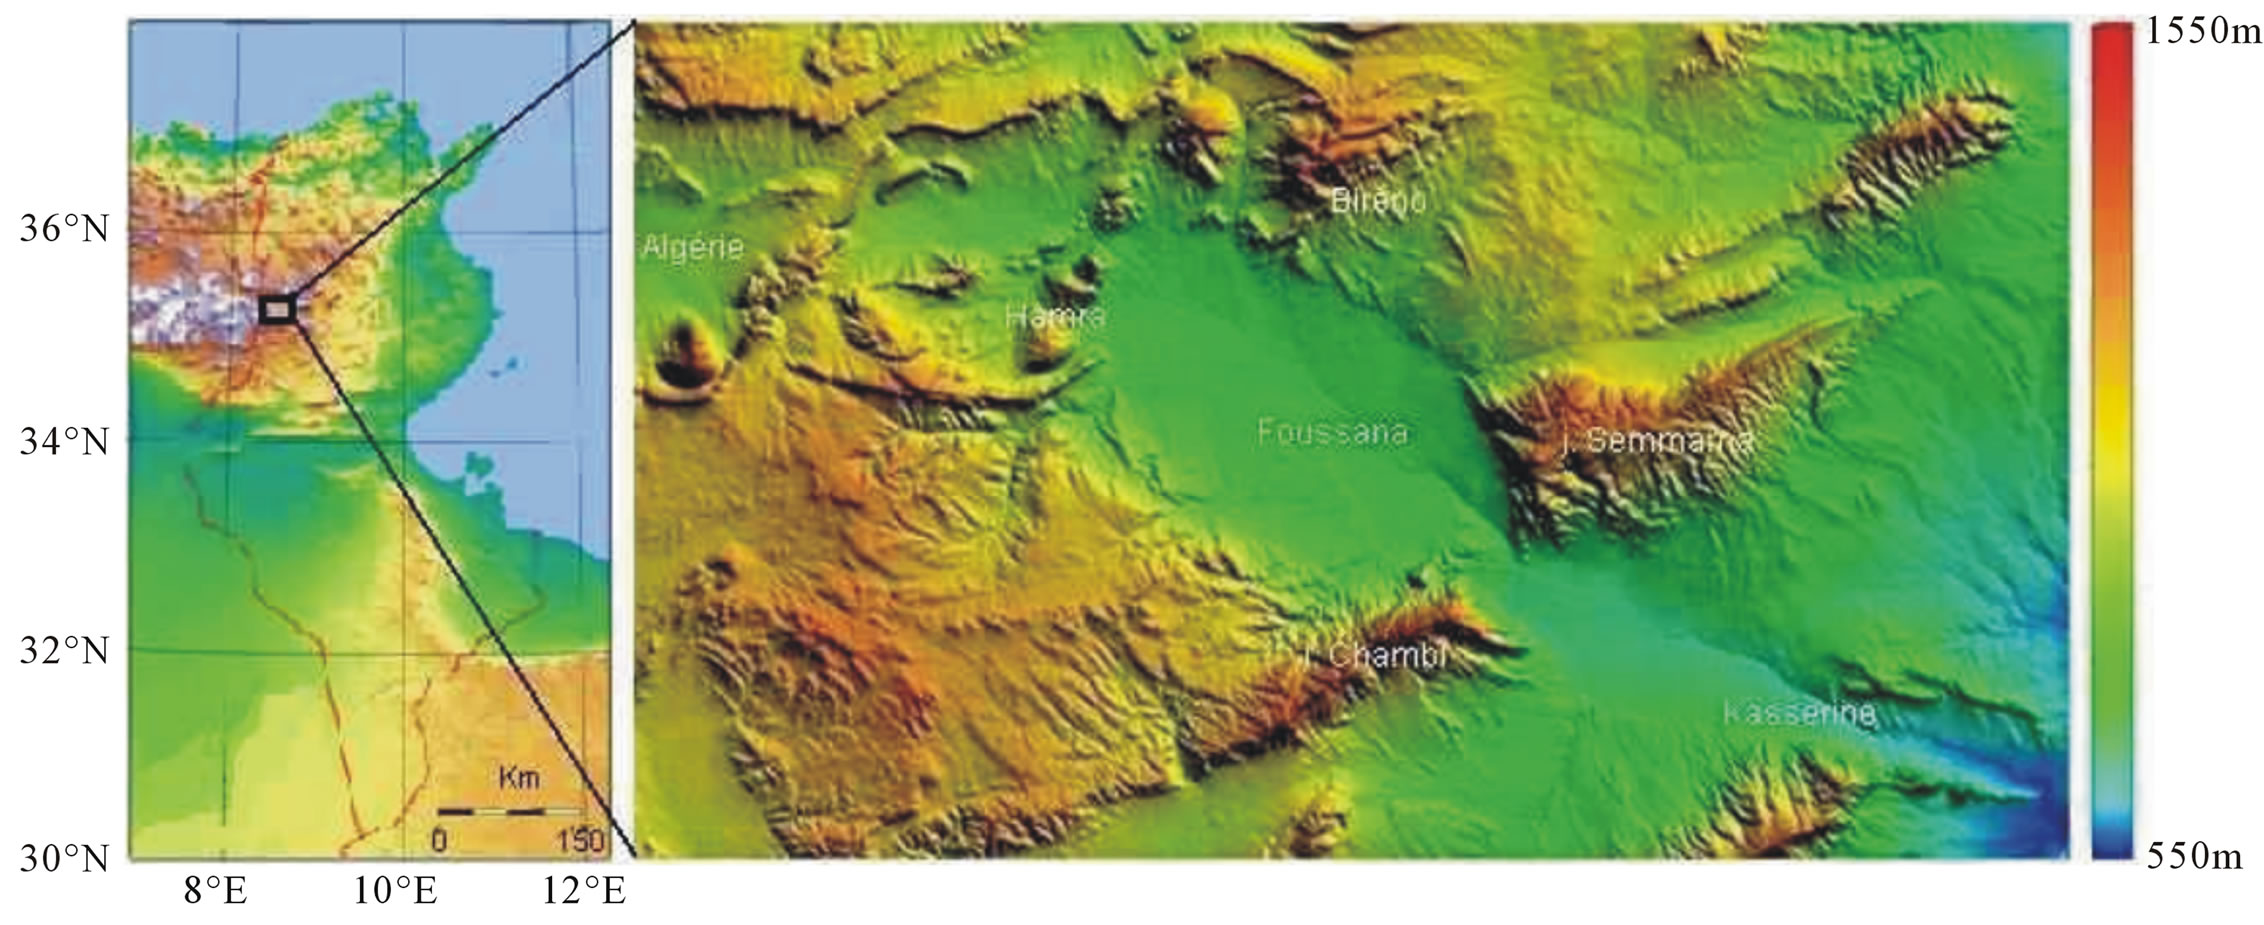
Figure 1. Study area.
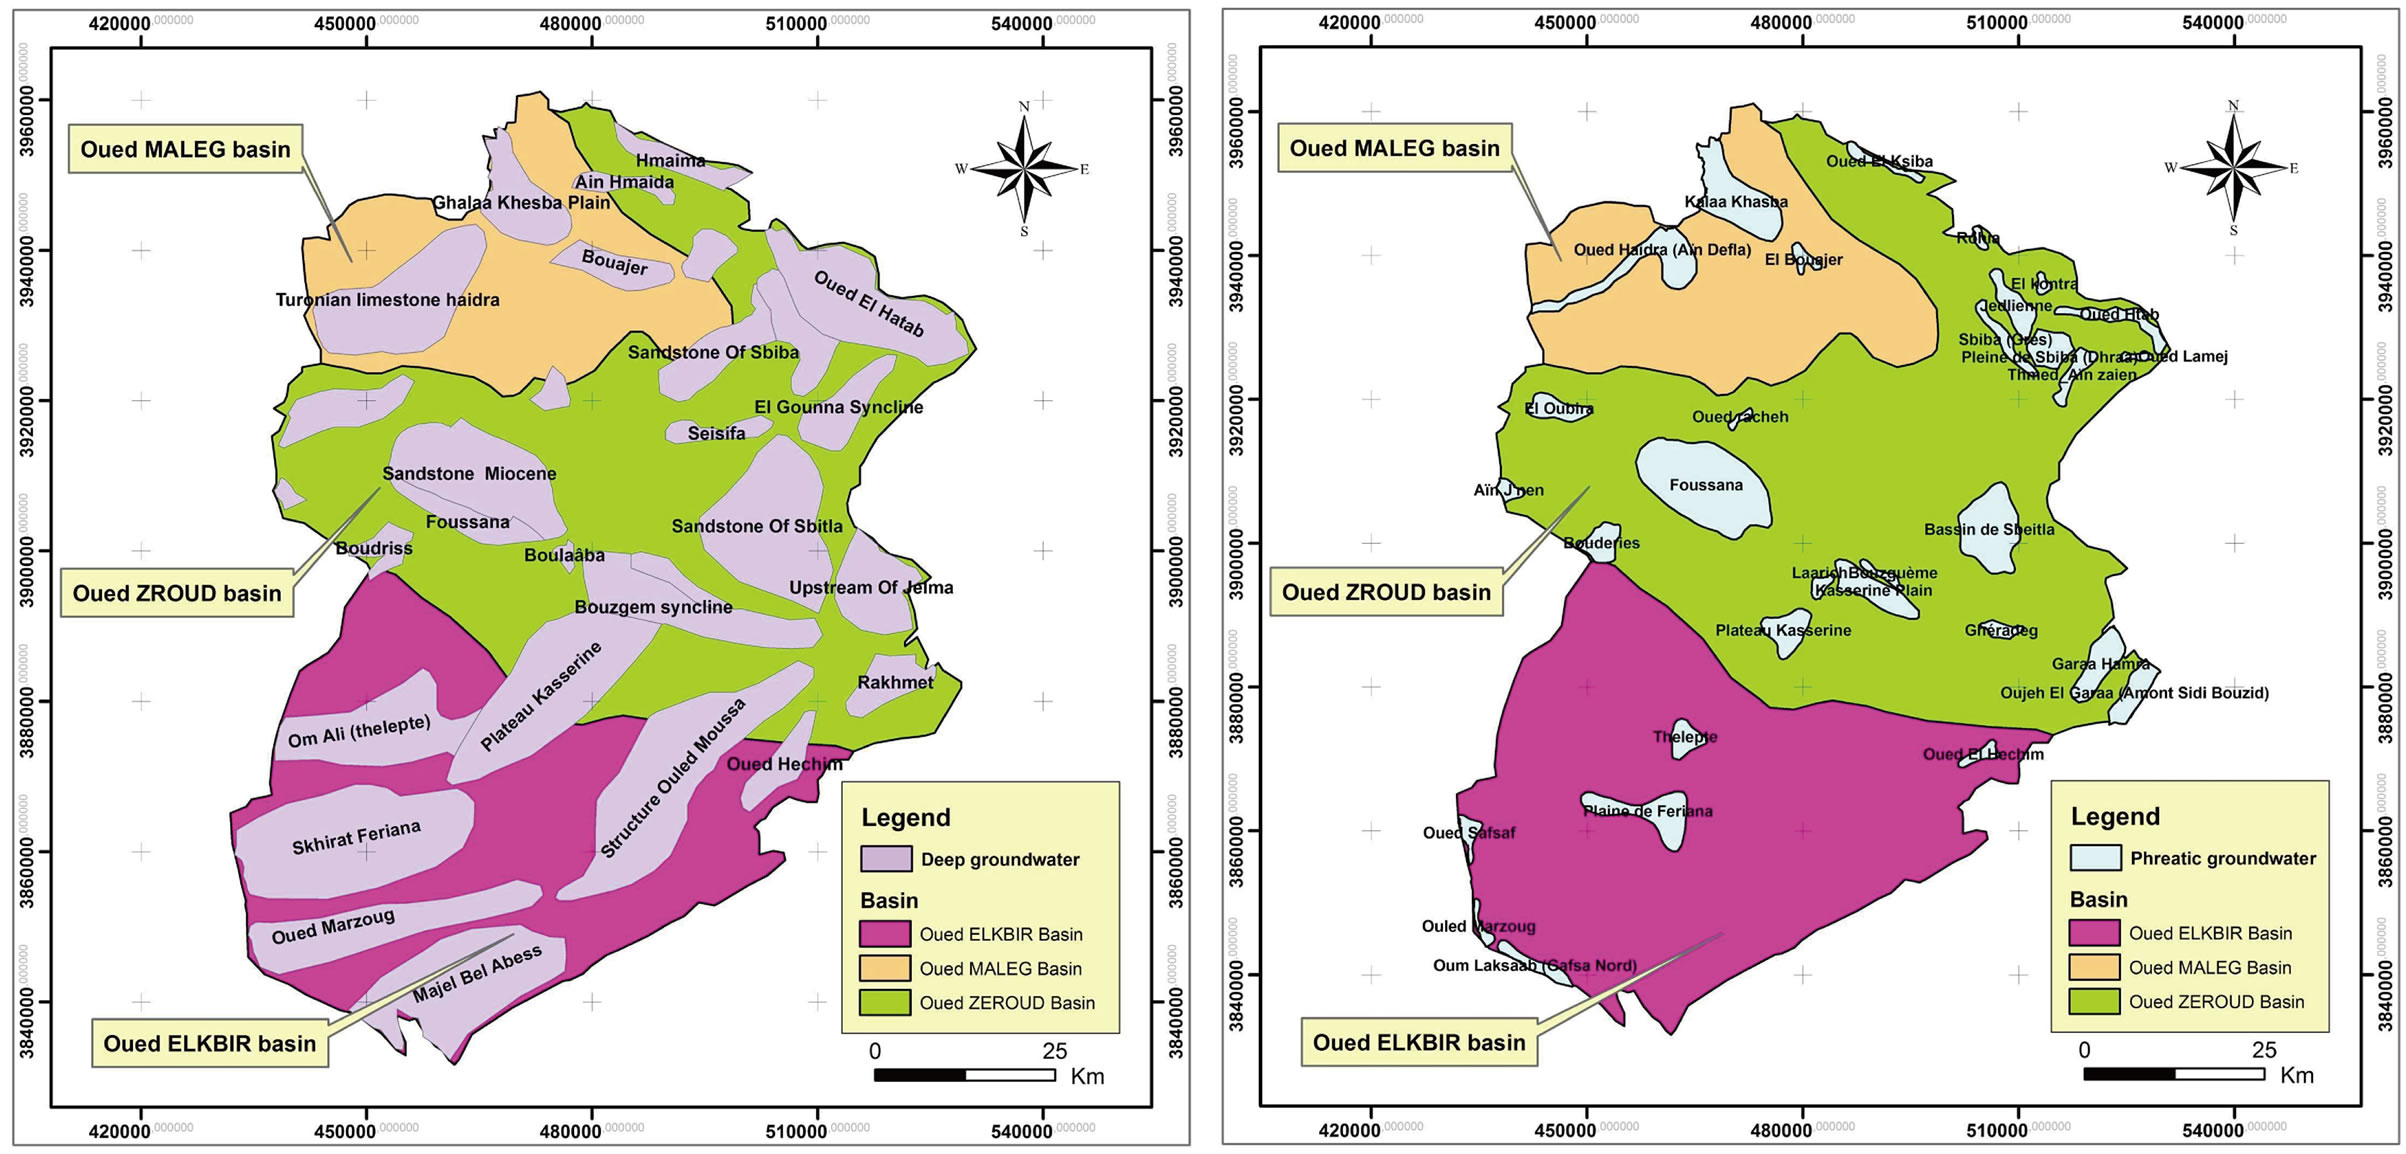
Figure 2. Foussana watershed.
of digital elevation models. It determines, after a series of known values, the estimation of additional data in areas not sampled [14]. This result is provided by calculation and not by observation.
In this work we chose to develop the most commonly types used DEM, grid type format Raster [15] and a second mode TIN vector.
Thought this work, we also use the Shuttle Radar Topographic Model (SRTM) and DEM mode was effective in extracting structural and hydrogeological data in the study area.
Another numerical model was developed by the interpolation algorithm using the “kriging” by surfer software. This Digital Elevation Model will serve in describing the geometry of the study area and therefore the development of the GRID for numerical simulations (Figure 4).
4.2. Results
4.2.1. Geomorphology of the Study Area
A DEM can get an idea about the morphology of the study area; it puts in relief anticlines, synclines, platforms. The topographic data relating to the relief describe faithfully the geometric domain in which carried runoff water (low pressure area, floodplain, river, canal artificial estuaries).
In the figure 4, the DEM developed under surfer software shows the form in “bowl” of the Foussana rift. This basin is surrounded by folded structures, Jebel Chambi in the south whose summit reached the record
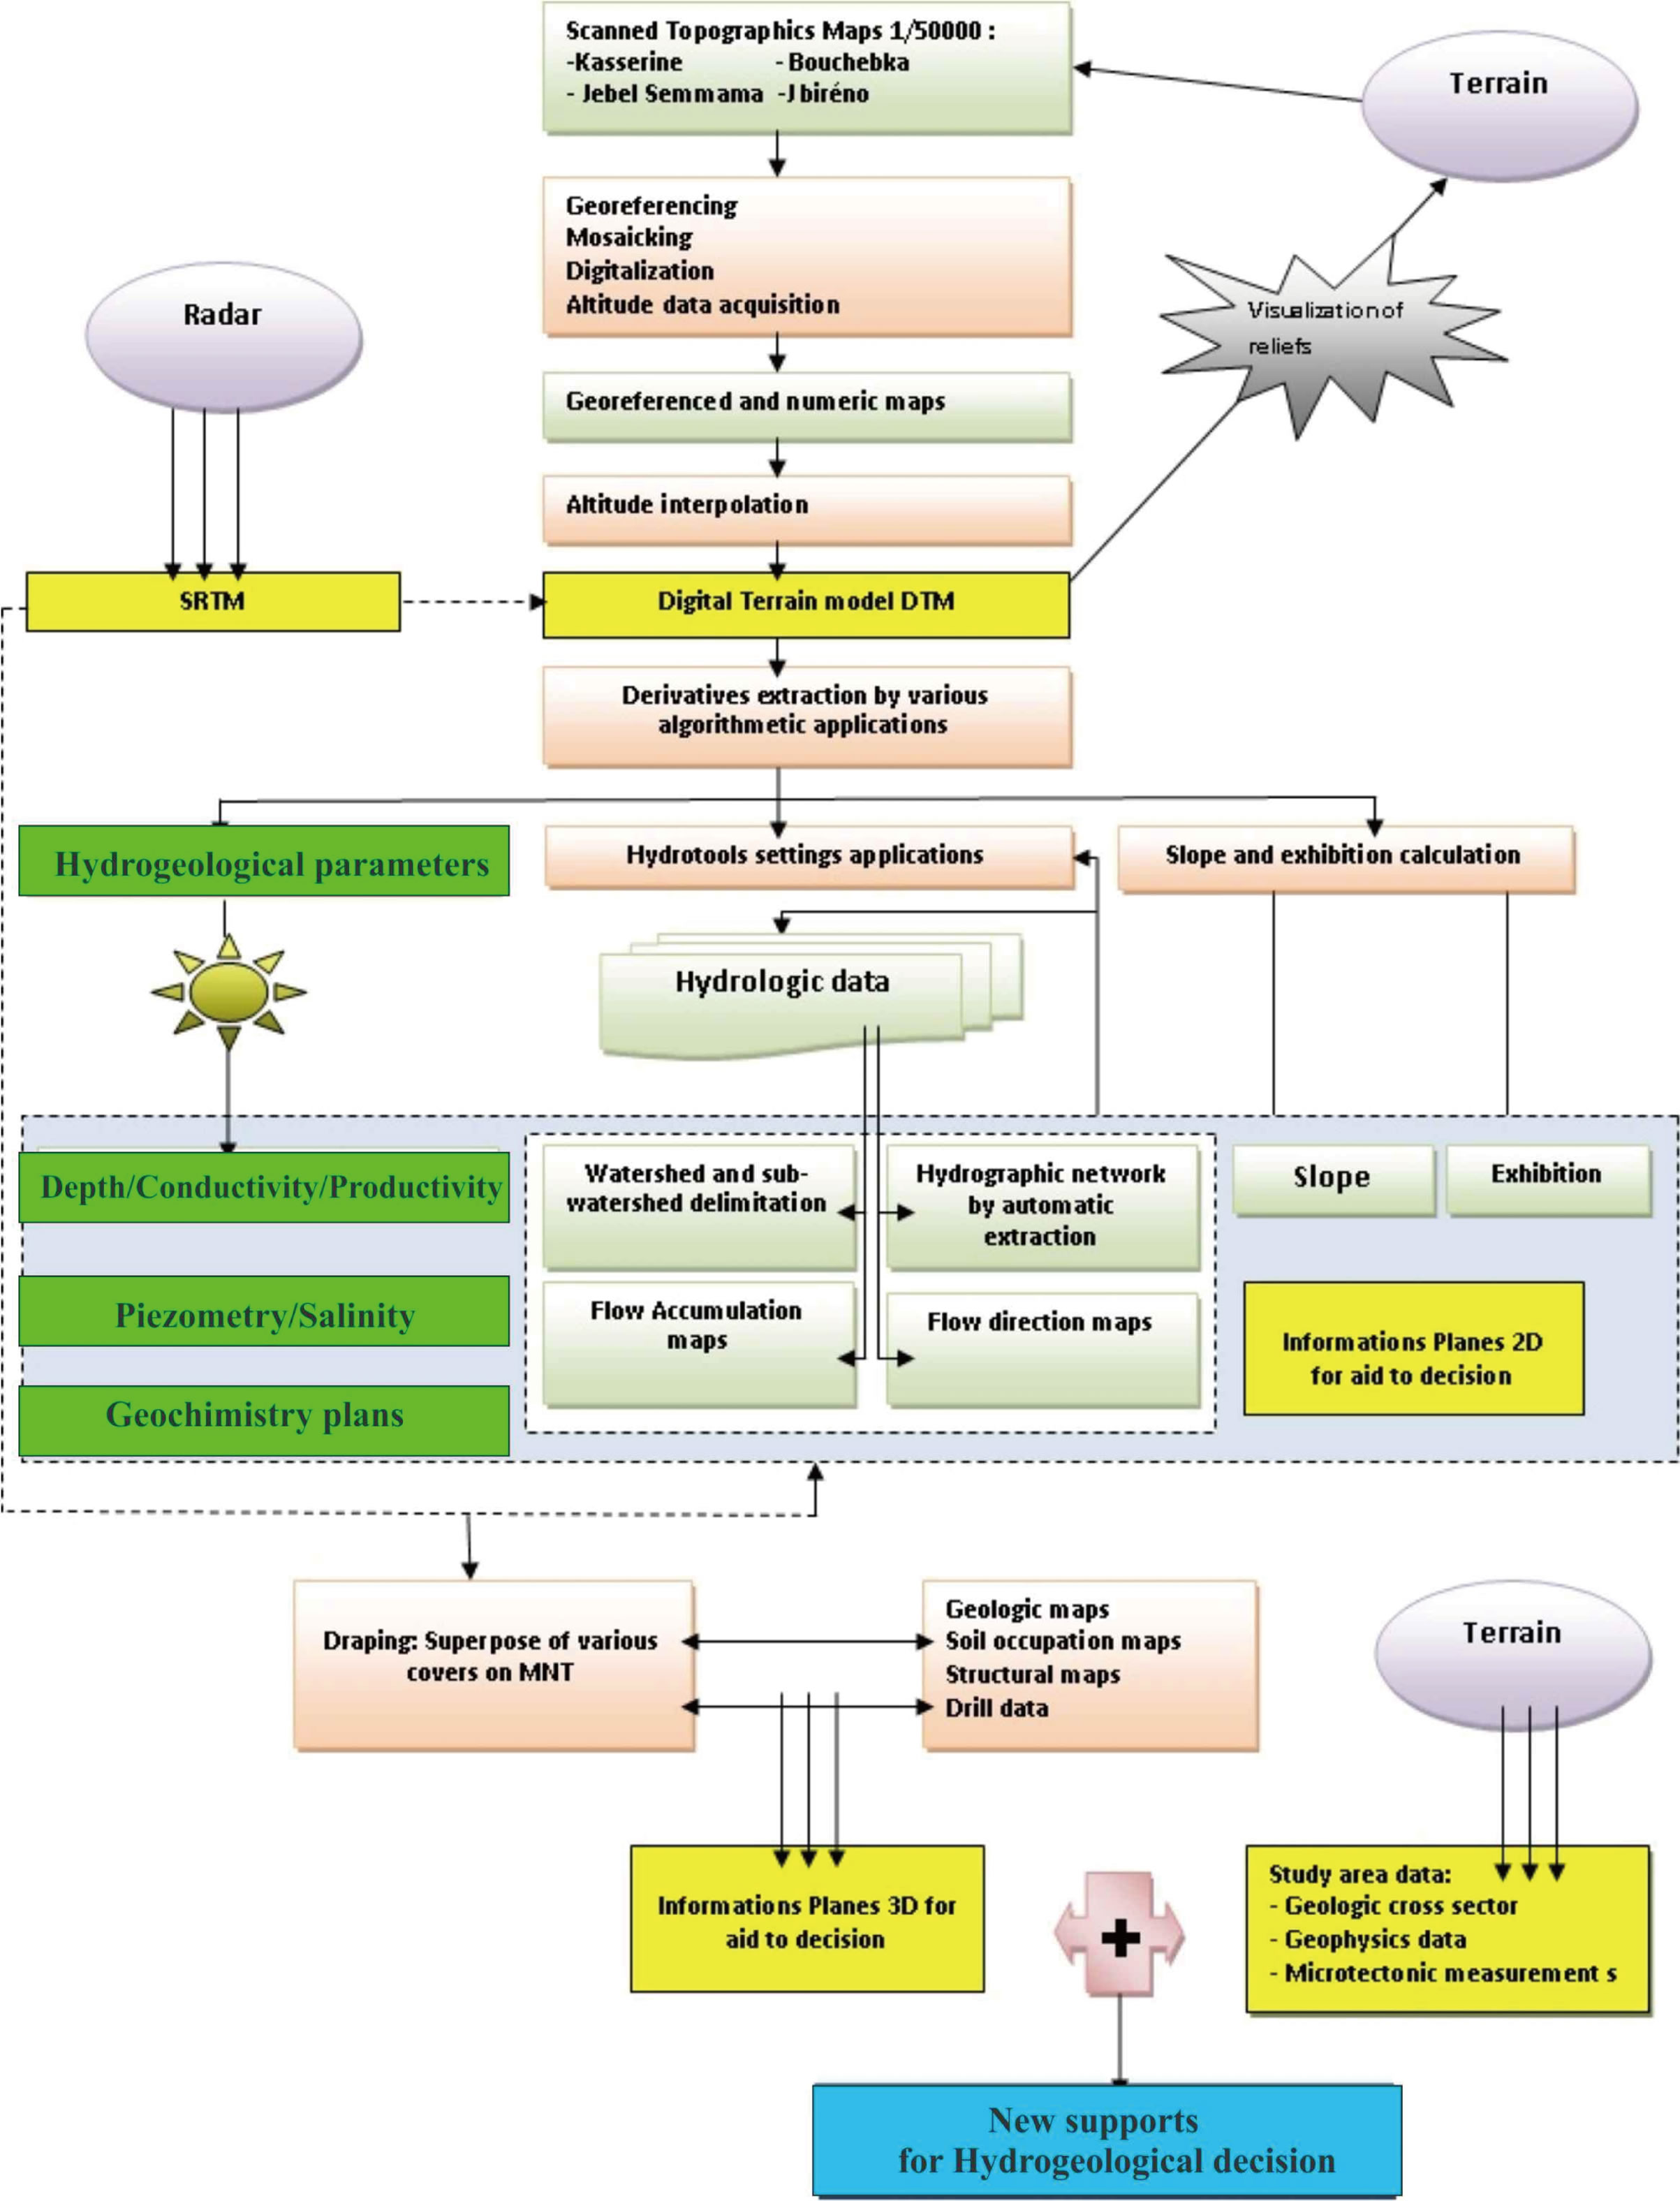
Figure 3. Flow chart explaining the steps of this work.
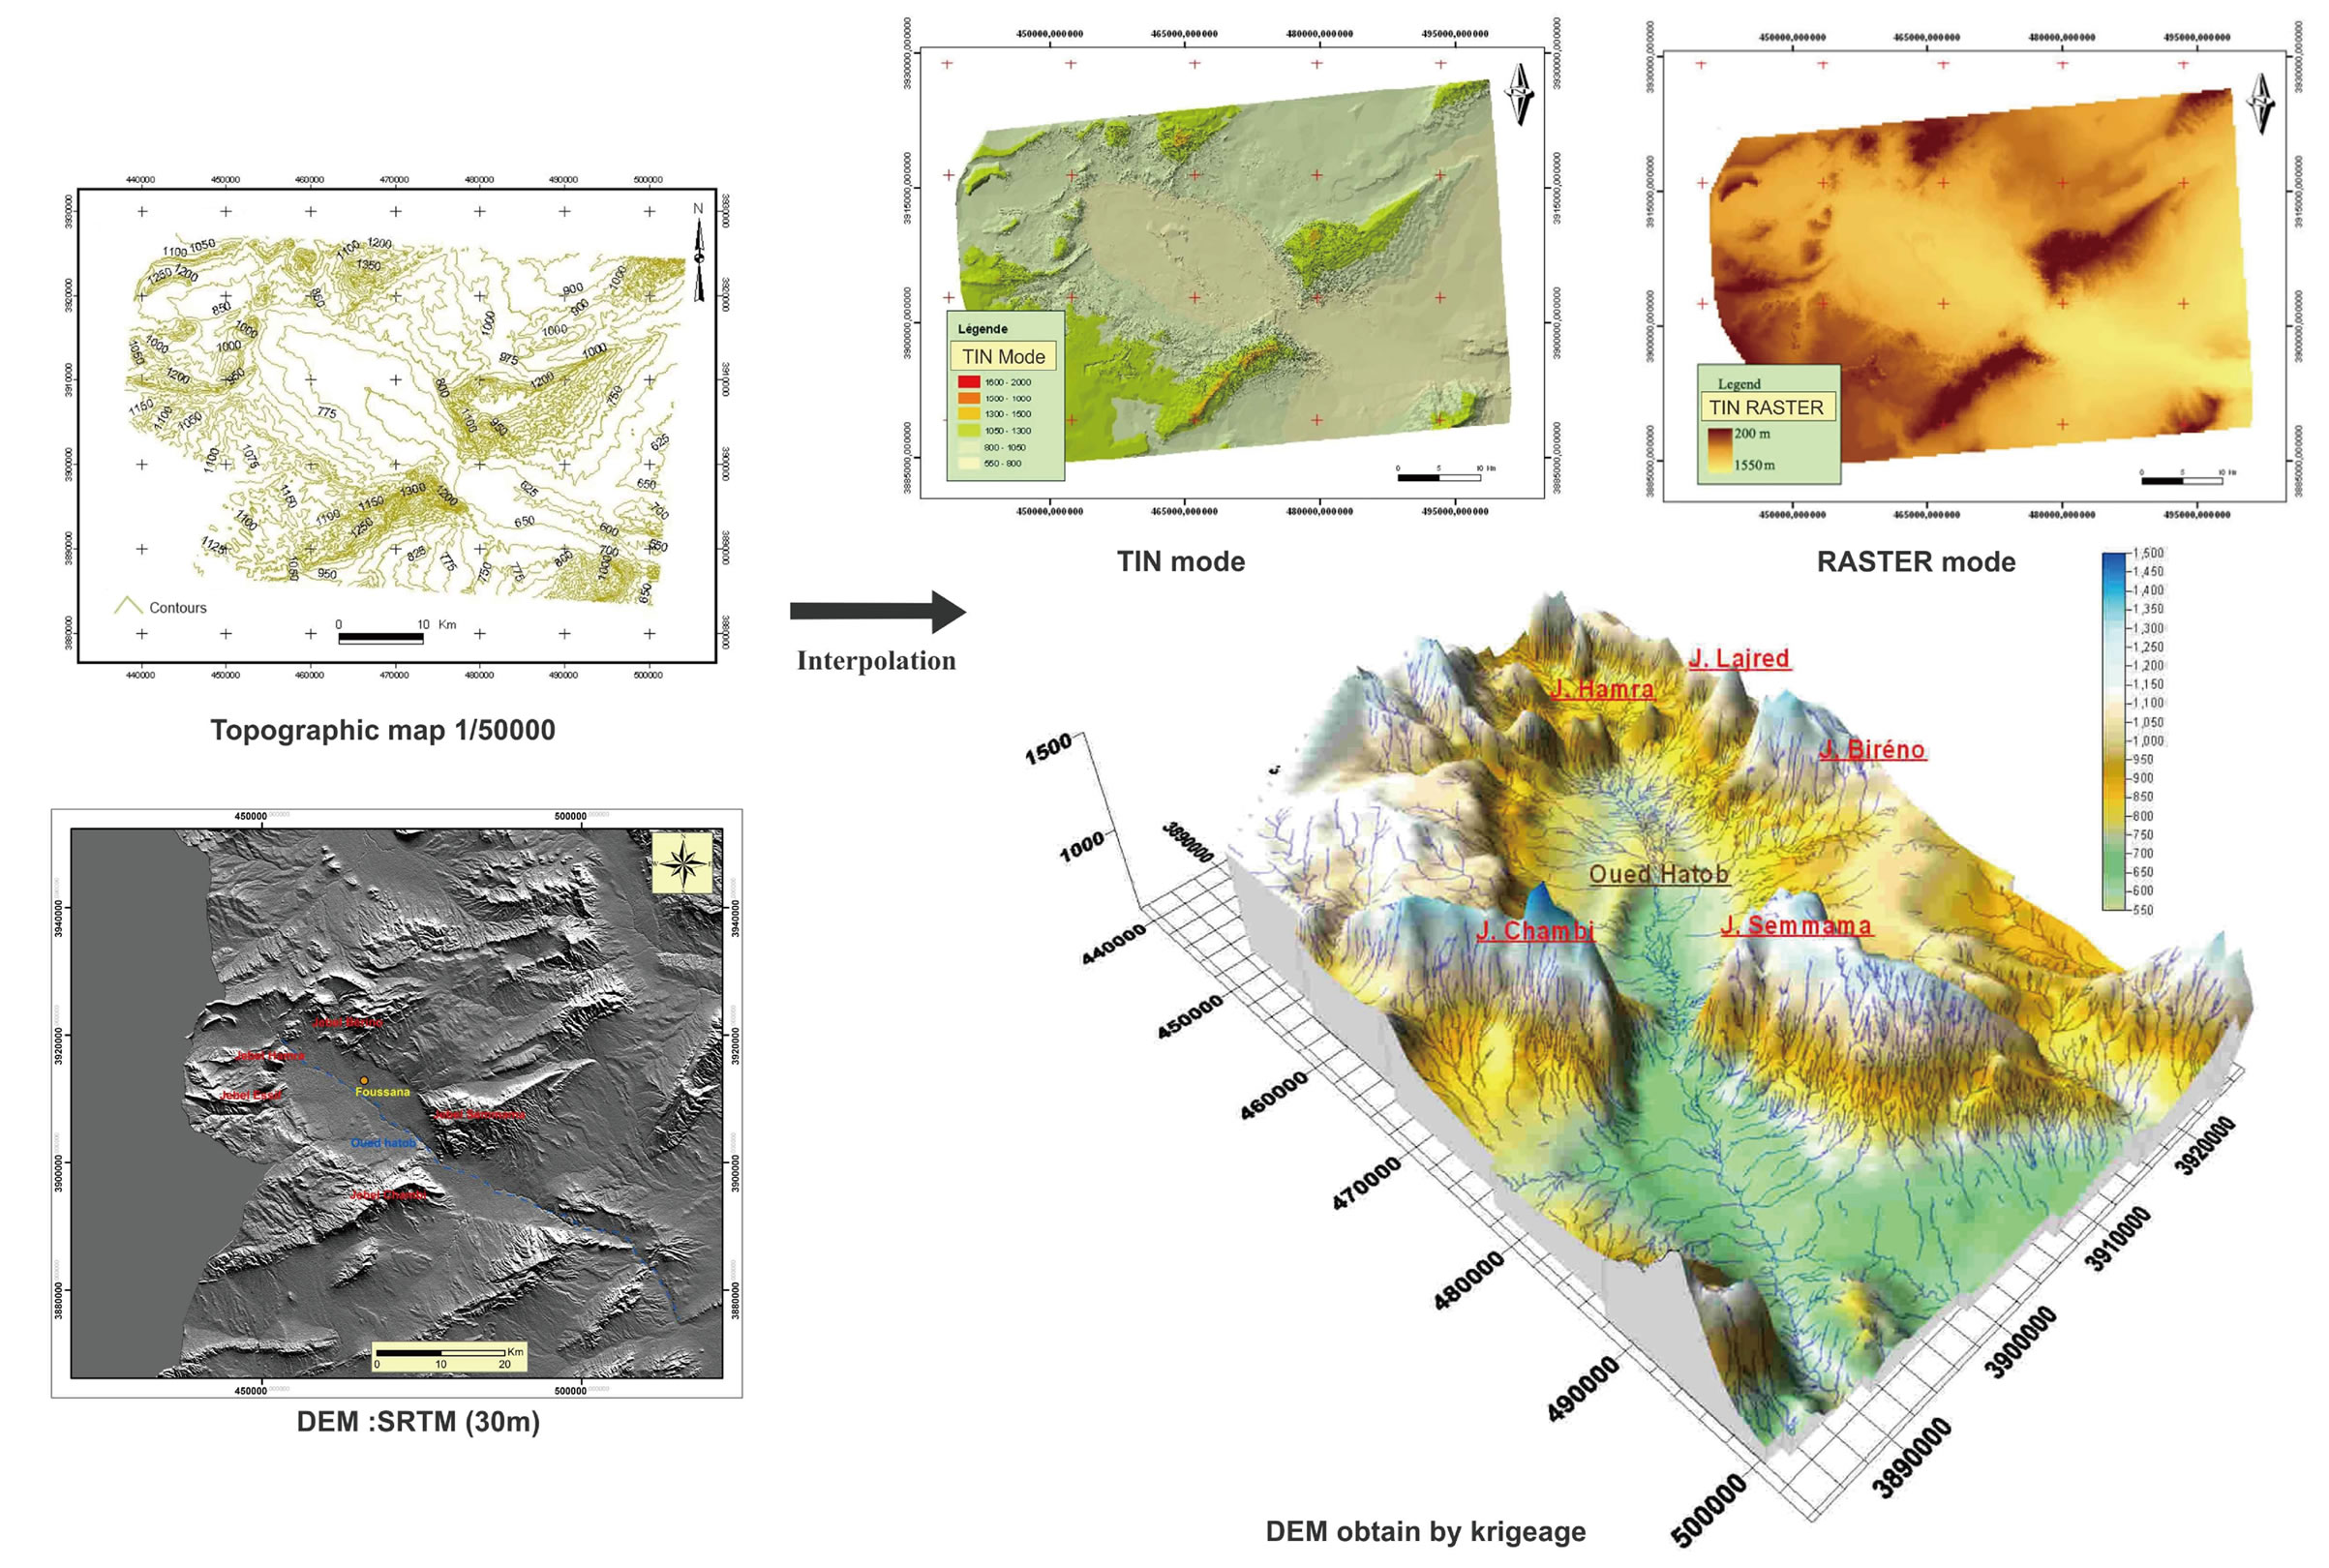
Figure 4. Different types of DEM used in this work.
altitude of 1440 m. Jebel Hamra with three moles and Jebel Lajred are respectively the limits west and northwest of the basin .The eastern boundary is represented by the Jebel Semmama which is relayed further to the north by Jebel Doulab, known as the main oil region.
Two areas have been marked, the first located in the west side and called Khanguet slougui between Jebel Hamra and Lajred is the upstream part, and the second one called Khanguet Boulaaba between the east side and Jebel Chambi and Semmama thus constituting the downstream portion of the basin outlet.
All these structures form the boundary of the watershed of Oued Hatob which is actually the upper basin of the river itself which is the southern branch of Oued Zeroud (central Tunisia).
The creation of the topographic profiles generated automatically by ArcGis allowed us to confirm this particular geometry and geomorphology of the Foussana basin with areas of strangulations of both sides of the ditch.
4.2.2. Slope Map
Measures of dips are essential data to the geologist and especially structural geologist and hydrogeologist [16]. They are used to quantify the geological objects observed at the surface at the end of the model. These measures may come from different dips direct or indirect sources: geological maps, ground or by DEM (Figure 5).
We notice from this map that most of the land is heading East-South implying its exposure to the sun during the first half day (Figure 6). In fact, all South anticlines flanks of Semmama, Chambi, Berino and Hamra are the most exposed which can playing a decisive role in the evaporation of surface water disposed; who was later directly relative impact in the reduction of water infiltration, thus inducing a reduction of underground water refill.
4.2.3. Hydrological Operating
Apart from highlighting in the study area, the DEM provides very important hydrological information [17].
1) Watershed Delineation According to the previous figure it was possible to delineate the watershed of Oued El Hatob. This basin is bounded to the north by the watershed of groundwater from Jebel Semmama to Jebel Biréno; at the eastern limit is formed by the anticlinal ridges of Jebel Semmama and Jebel Chambi, on the western boundary it passes across the Khanguet Slougui, while Jebel Nougueza and Jebel Essif forms the southern boundary.
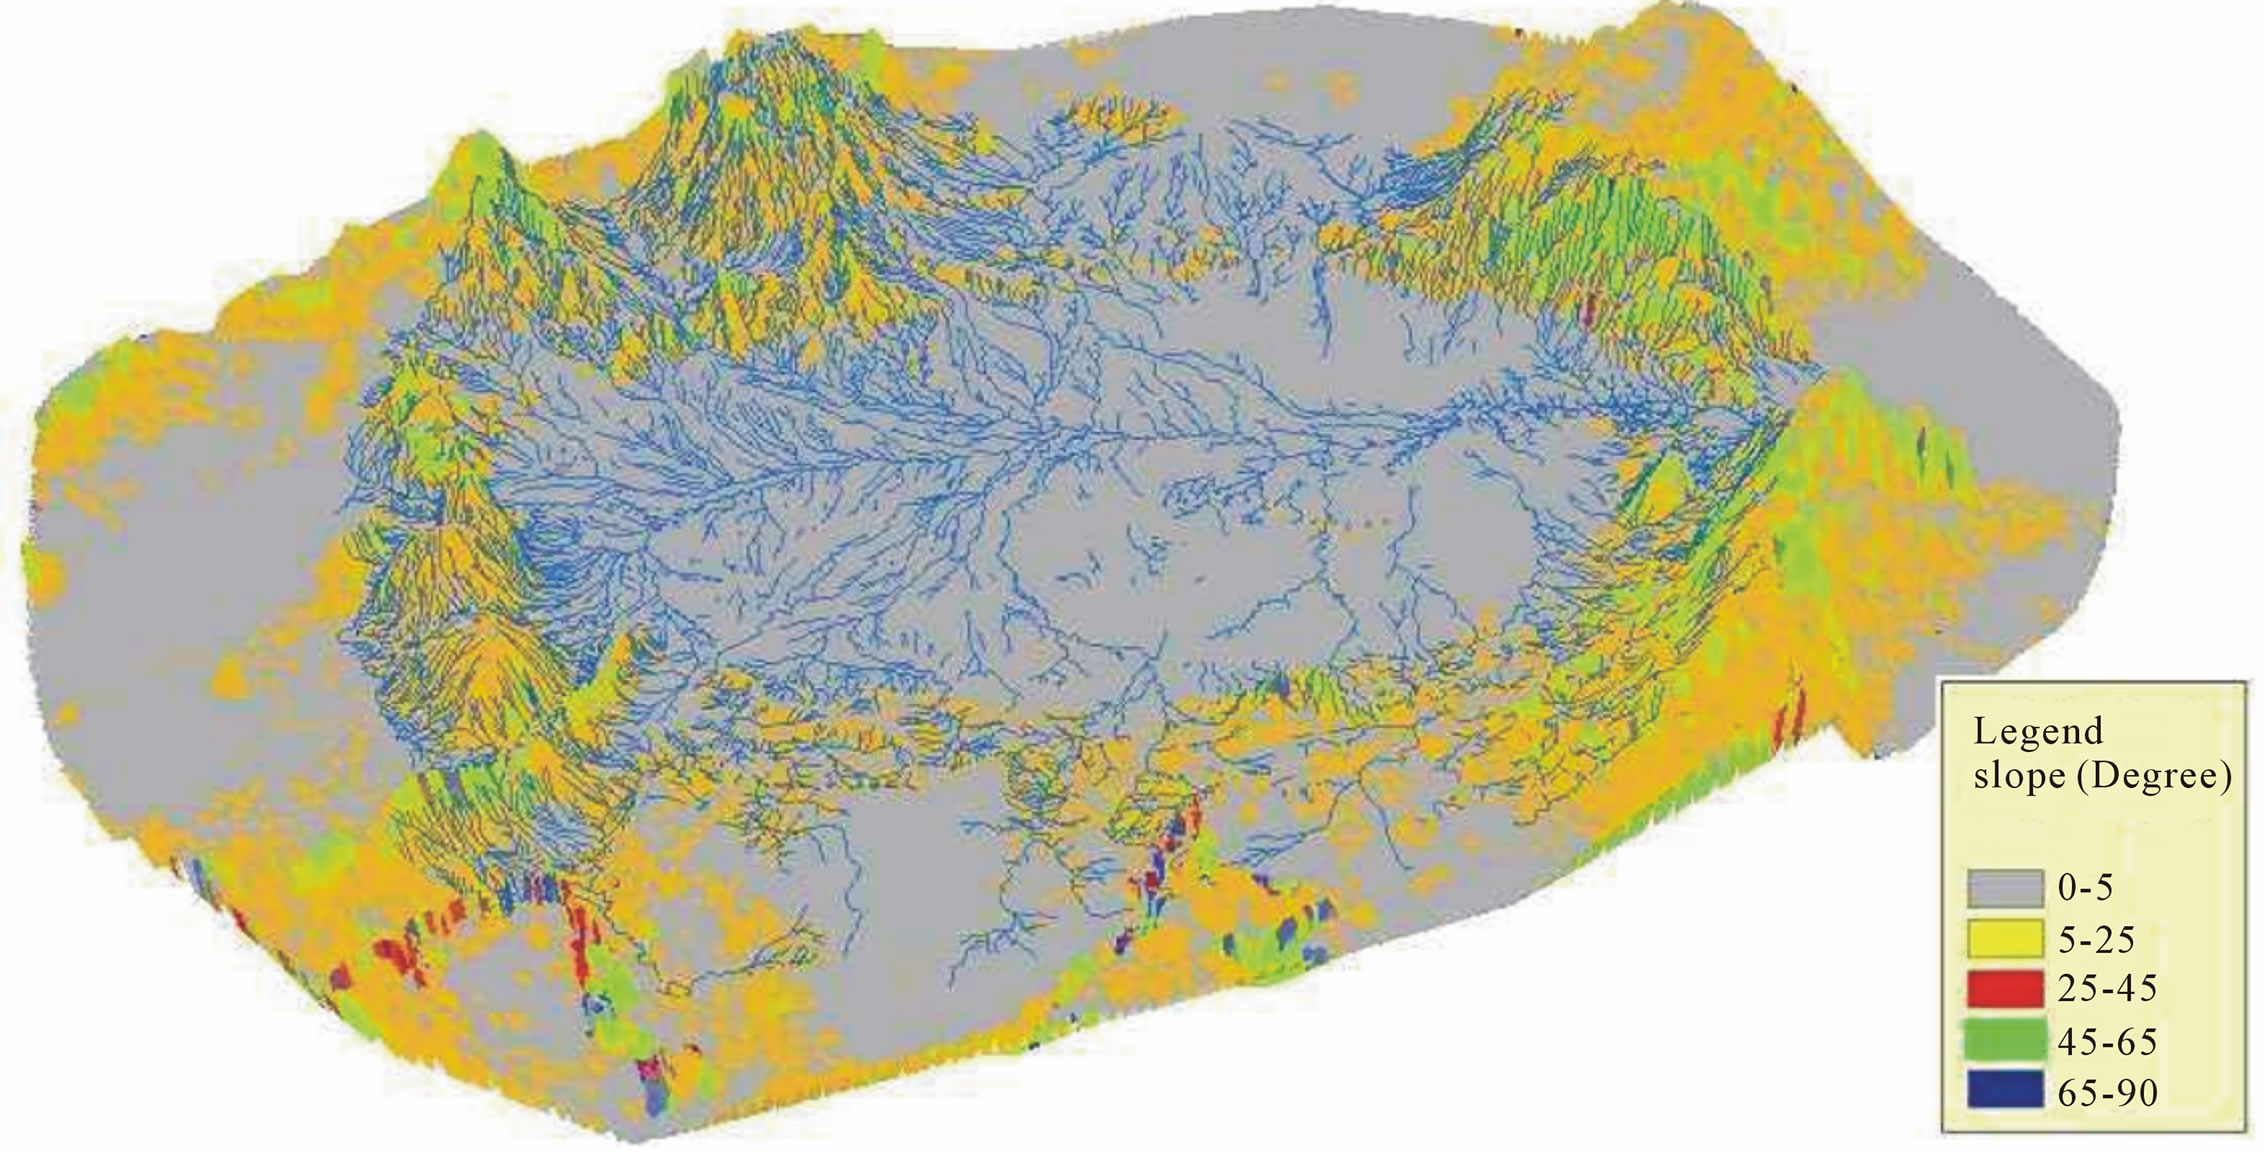
Figure 5. Slope map.
Area and perimeter
The development of digital elevation model mode “wire” (Figure 7), allowed us to automatically measure the area of the watershed by number of pixels or grid cells in this case it is equal to 34.450 (Table 1) cells that is the equivalent of 528 km2. While the perimeter (P) in this sector or the length of the contour line of the basin is about 95.04 km.
Hypsometric curve
Tracing the contour curve relates the heights and surfaces in the watershed as a frequency area below a given threshold (Table 1).
The shape of this curve shows the presence of:
o A low slope towards lower altitudes between 750 and 1050 m: the presence of plains wheat and Foussana Zafran corno A steep slope between 1050 and 1150: showing the high reliefo A very low slope to the coast above 1100: presence of high-bit extended relief Jebel Chambi, Jebel Bireno, Jebel Semmama, Jebel Es-sife.
o We note also that more than half of the basin (57%) is situated at an altitude above 900 m.
Form and Relief of Watershed
The study of the morphology of the basin has been inferred by the determination of some quantitatively parameters characterizing the shape and terrain of Oued El Hatob which are essentially:
*Index or coefficient of compactness (C) which is calculated by the following formula:

*The equivalent rectangle:
length
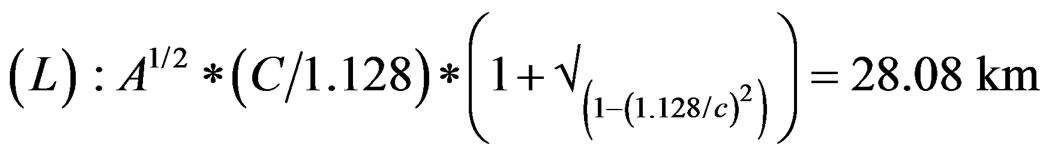
width
*Slope-Roche:
with: Bi = fraction of the total area of the basin between the ratings ai and ai-1
*Global slope index
- 
- (H5 = dimension limiting the 5% highest area = 1175)
- (H95 = 5% rating limiting area lowest = 775)
- (D = vertical rise is taken equal to 6 H5 H95 = 400)
- DSm = IG × A1/2 = D (1/L)1/2 = 415 m
- DS is the product of the slope by a coefficient D depending only on the compactness C of the basin; it can immediately compare the basins between them and establish classes of following relief.
Low relief
- DS < 10 m
- R1: Relief Low 10 < DS < 25 m
- R2: Relief relatively low 25 < DS < 0 m
- R3: Relief moderate 50 < DS < 100 m
- R4: Relief strong enough 100 < DS < 250 m
- R5: Relief Box 250 < DS < 500 m
- R6: Relief strong DS > 500 m Median altitude is the altitude with 50% of the basin
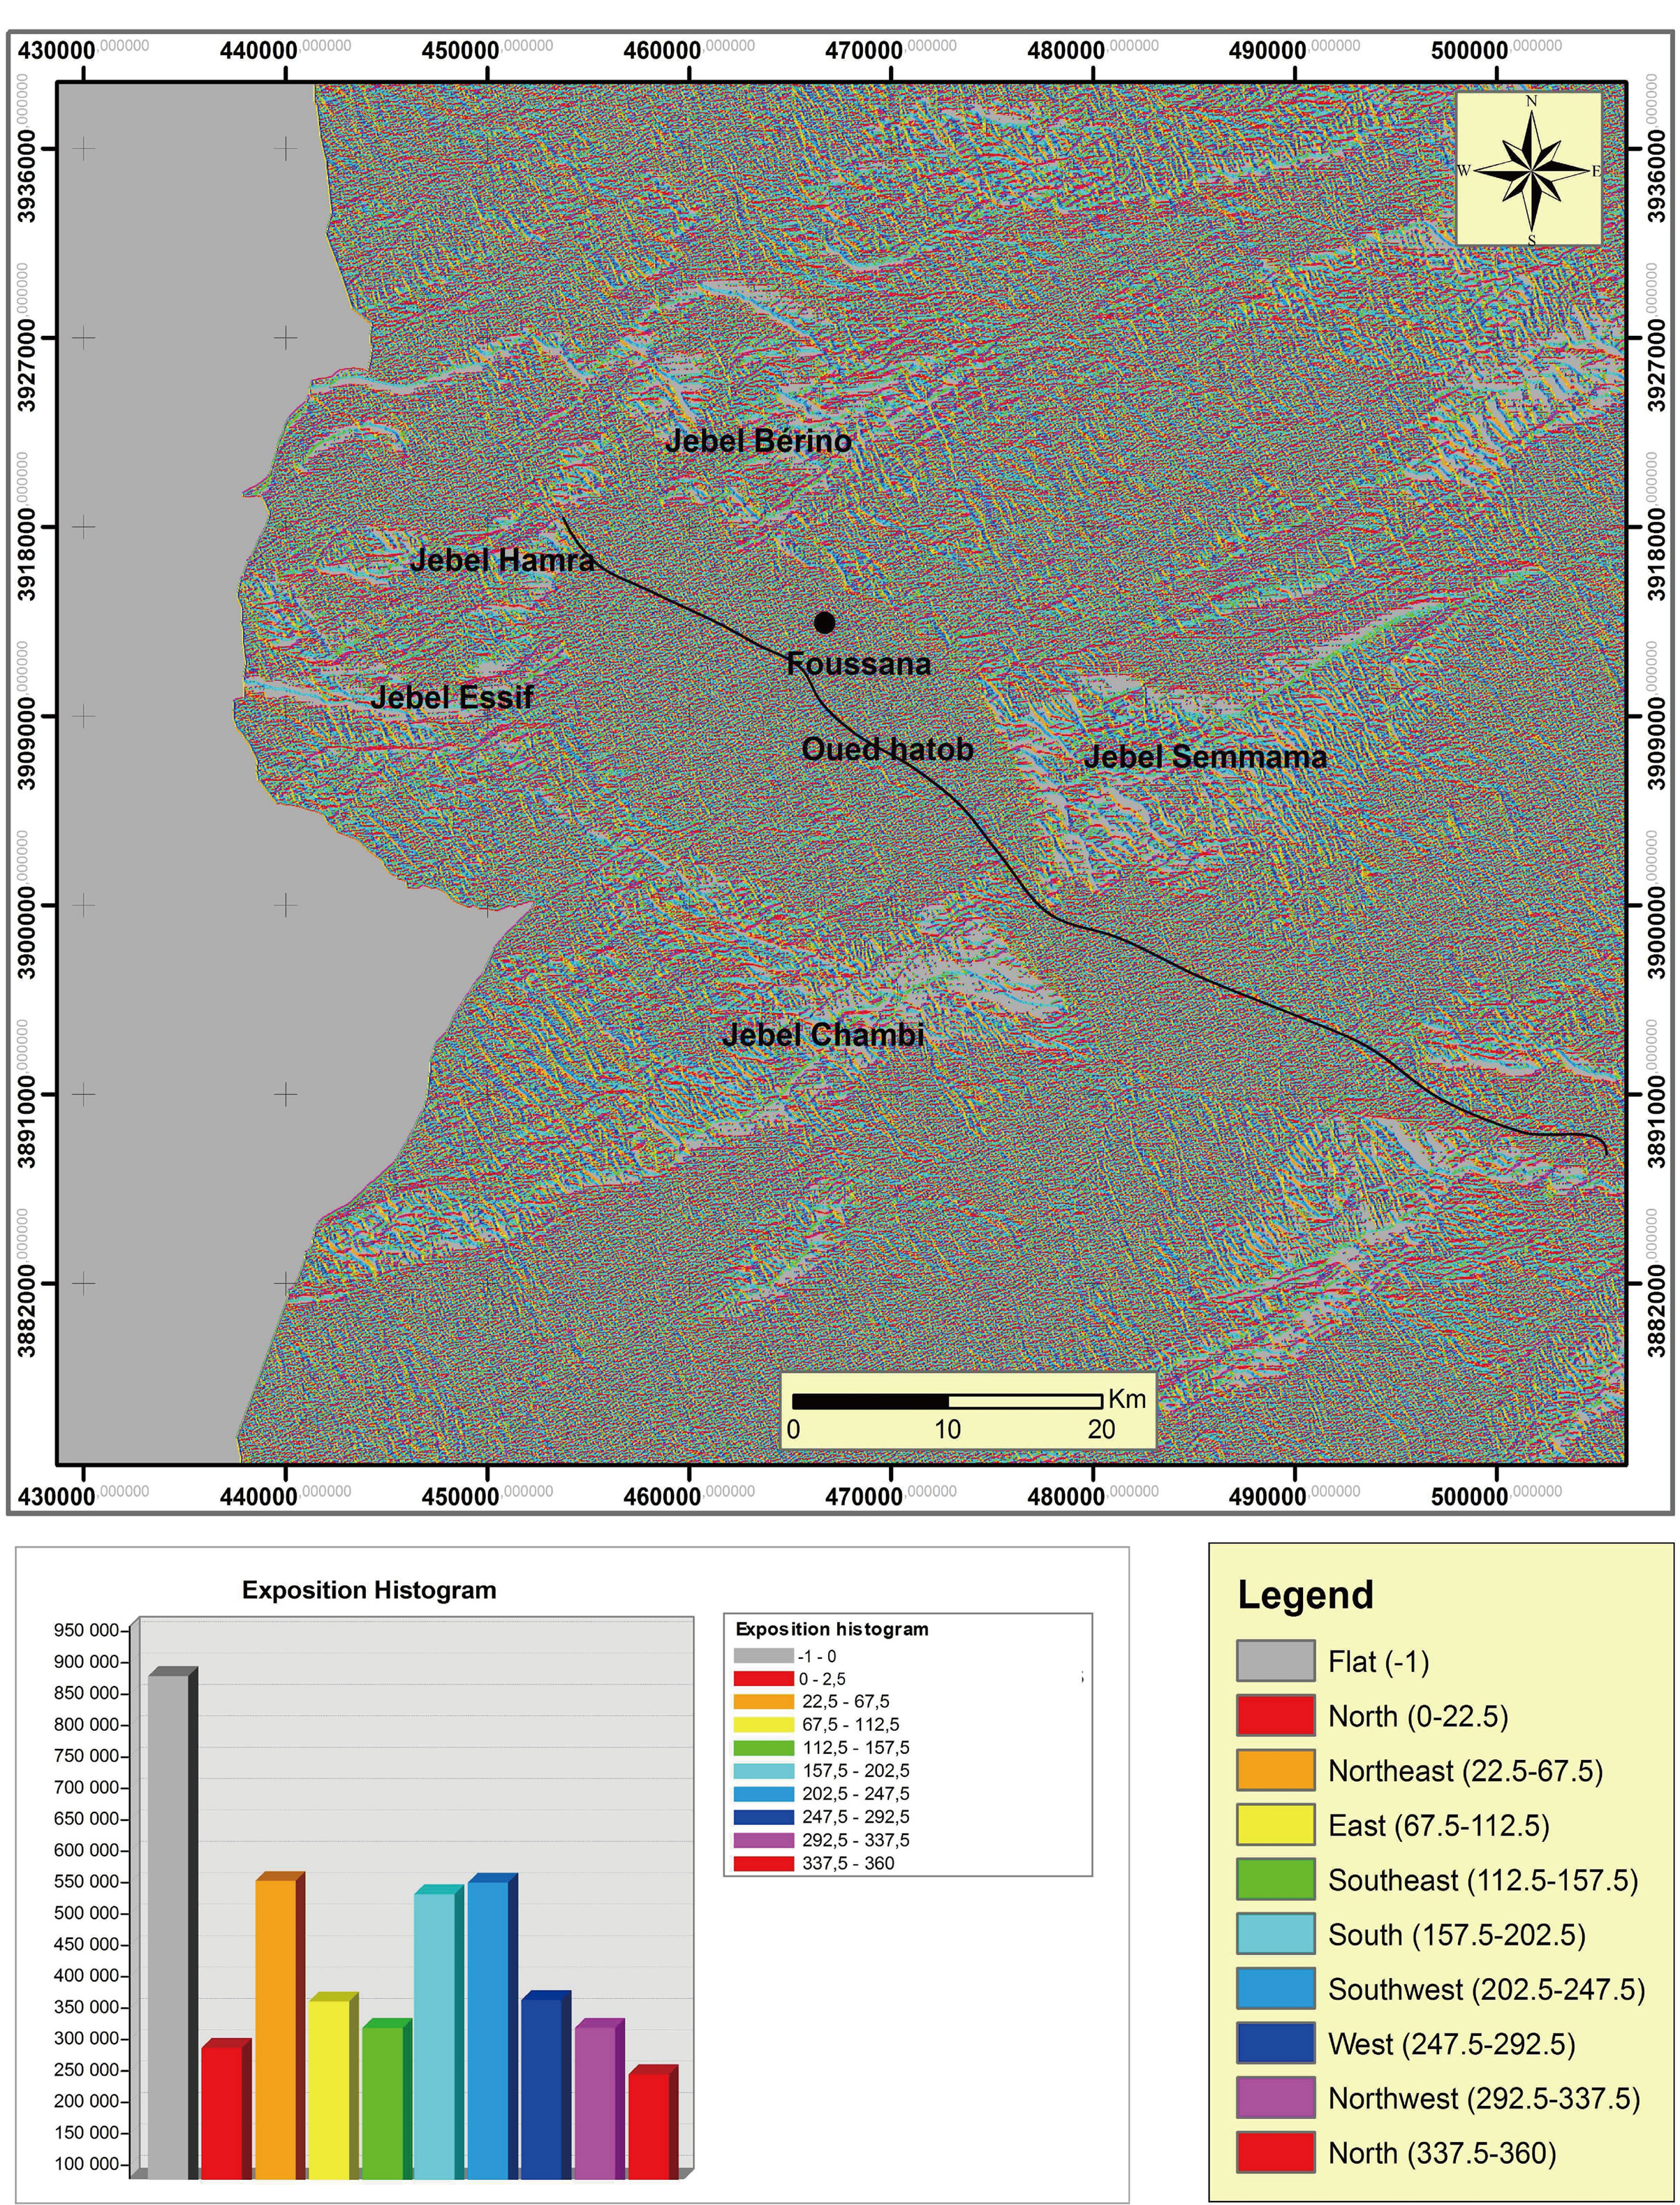
Figure 6. Slope exposition map.
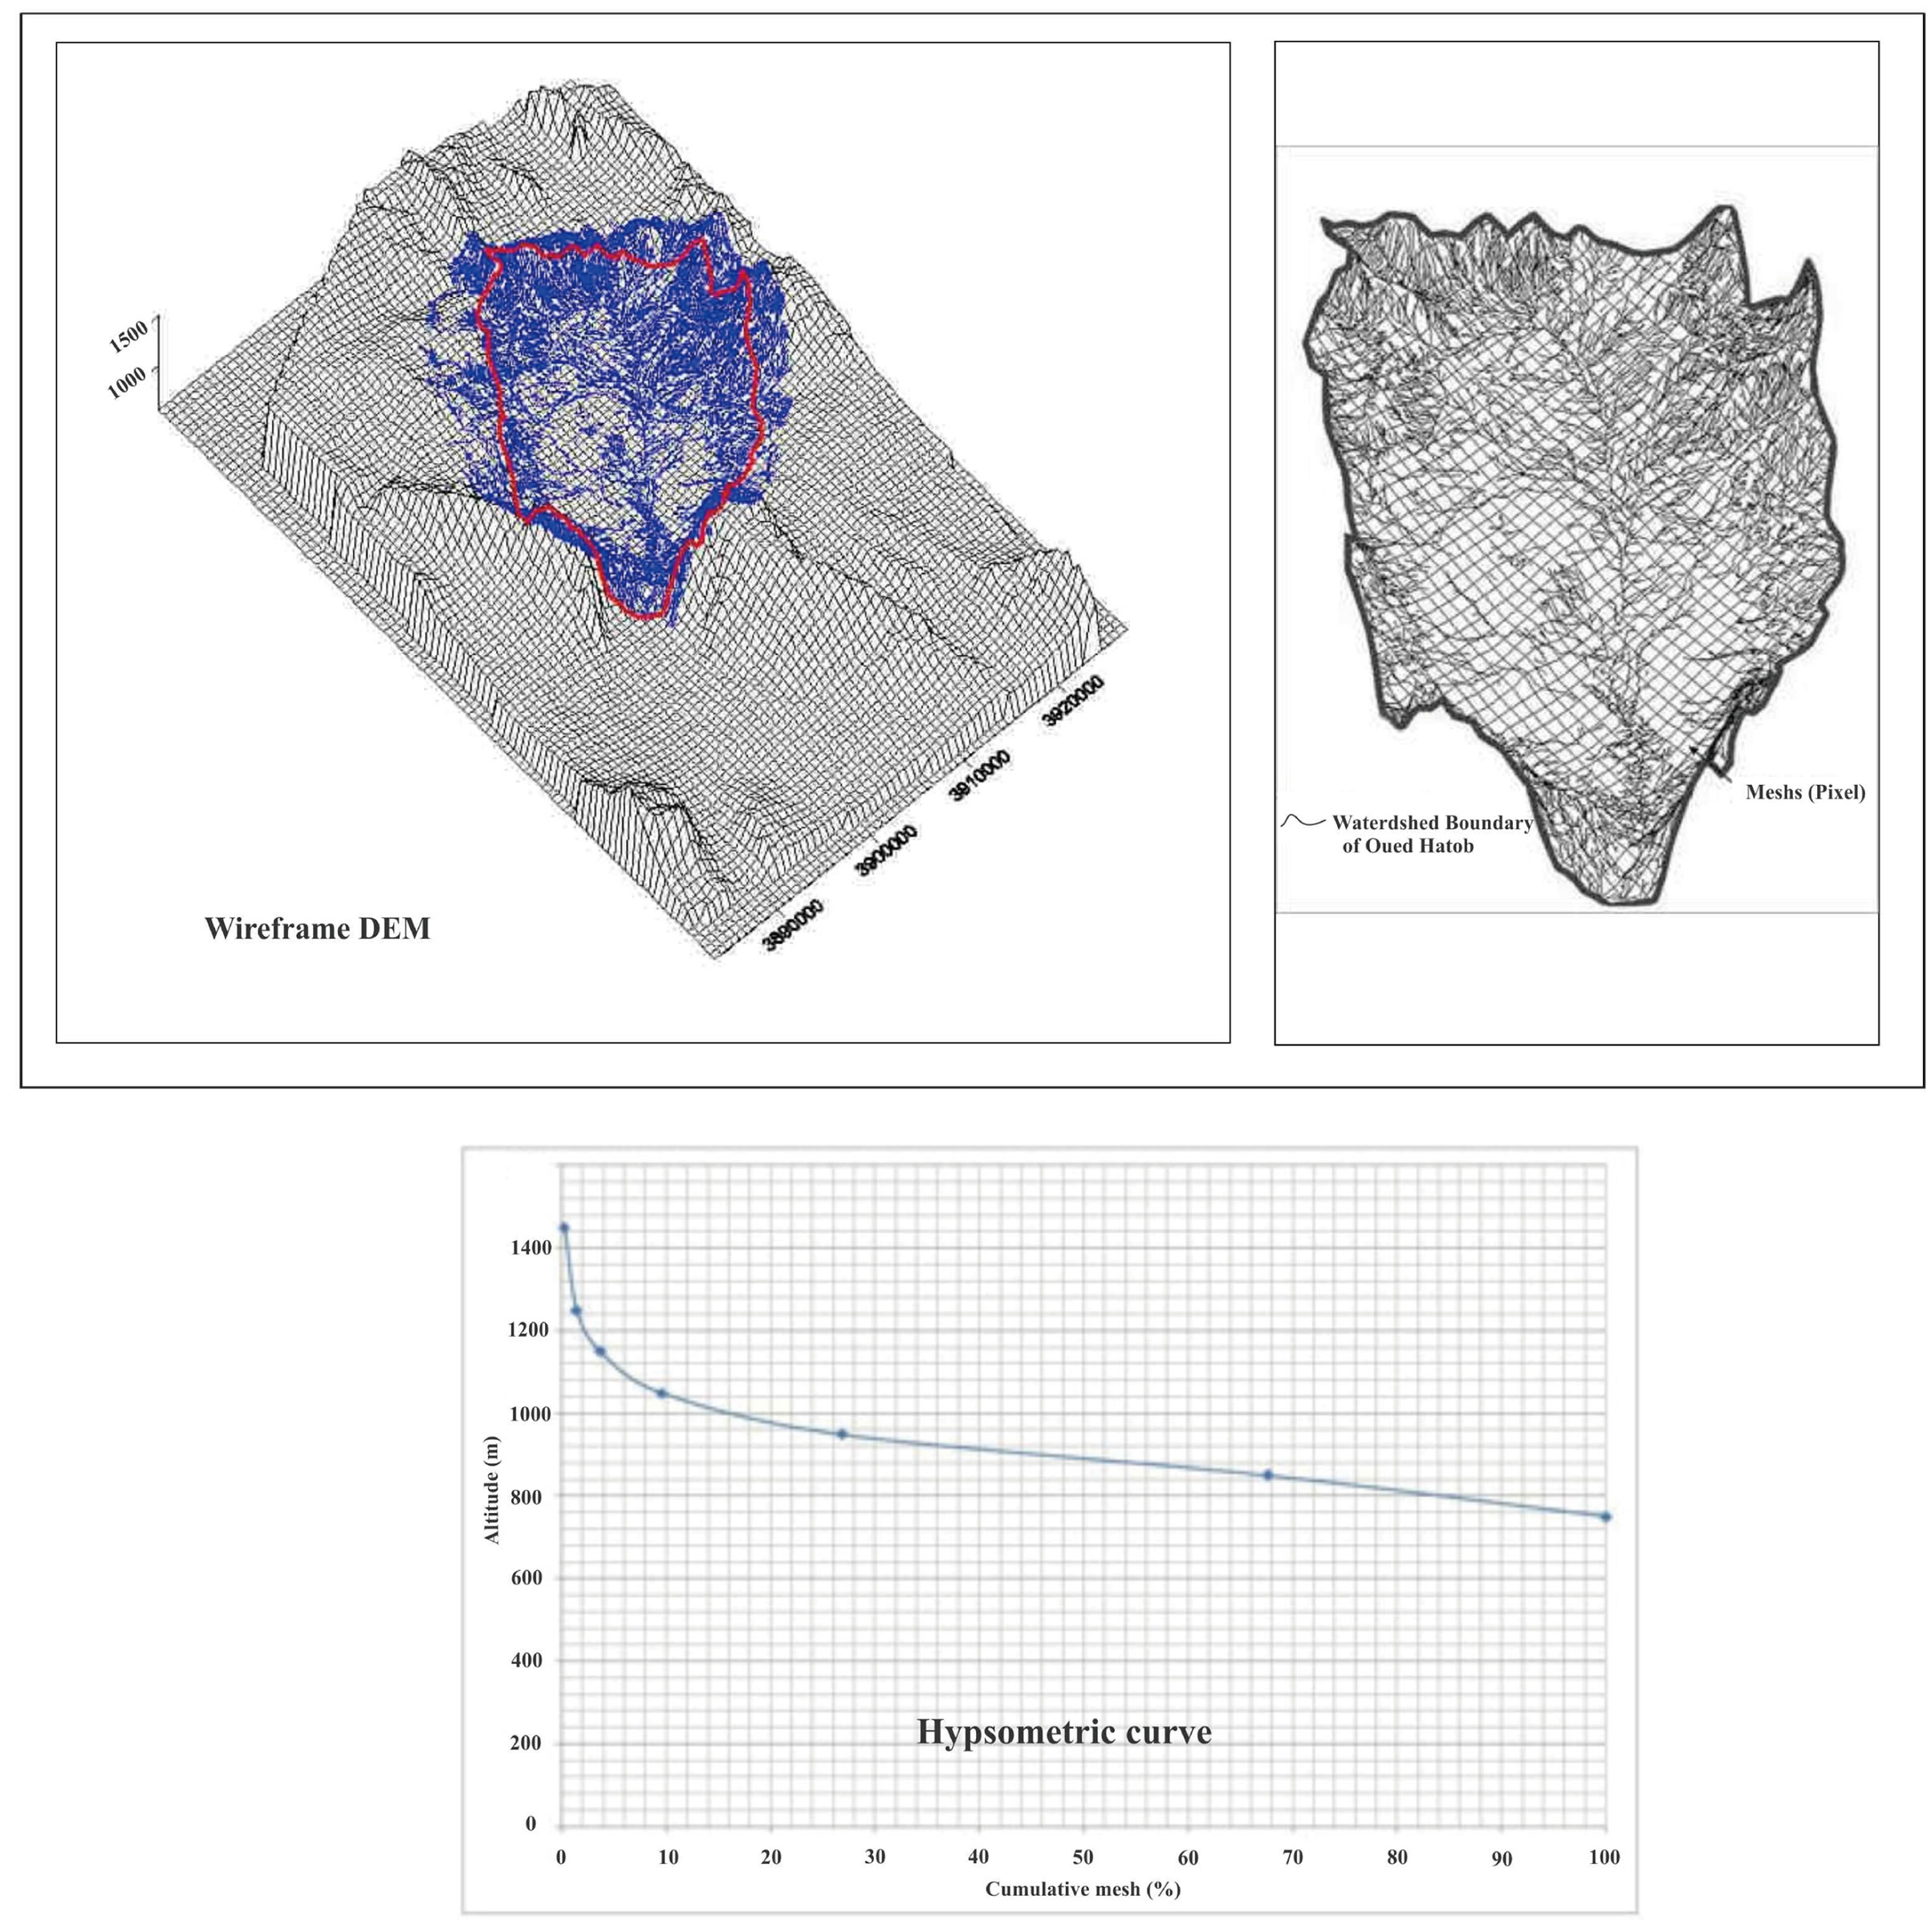
Figure 7. Pixel hypsometric curve.

Table 1. Percentage of cumulative altitude by PIXEl.
area above it = 950


the class studied the basin relief is R6.ÉcouterLire phonétiquement 2) Flow Calculation The rains of the Central Tunisia are not abundant but it is few, tempestuous and often brutal, distributed throughout the year with a maximum in spring and autumn. The rains are associated with low relative humidity in summer, relatively high in winter. In addition, the temperatures is highly continental with high diurnal amplitude and annual (18 to 20) resulting in a large change in relative humidity through the day and often violent winds and drying.
Calculation of the average felling water depth
Due to the lack of sufficient data to draw inter annual isohyets, we are just choice an average annual rainfall for the entire upstream part of the watershed of Oued El Hatob, from the three existing stations (Kasserine, Bordj Chambi and Ain Amara). This value must be between Ain Amara station characterizing rainfall relief in the boundary of the basin and Bordj Chambi-Kasserine characterizing the plains.
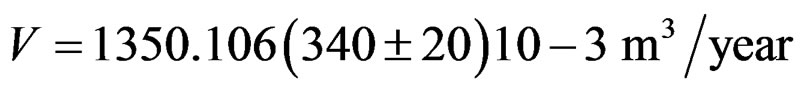
The average annual rainfall measured in the study area is approximately 340 mm with an error margin of 5% to 6%, or 340 ± 20 mm/year.
Calculation of annual felling water volume
The studied catchment area is about of 1350 khm2.
It is evident that some of this quantity will run off as a flood, another party to the contrary will infiltrate and thus sustain the Foussana aquifers, the rest will be evaporate.
Calculation of average perennial flow of the dry and wet seasons
The Foussana basin is characterized by the presence of two seasons wet season which can be defined as the period when the average perennial flow of the river in the Chambi station is greater than or equal to the mean annual flow. It is limited by intersections of the curve of monthly flow and the annual mean flow. Although in the dry season the flow is last or below the annual average flow. Accordance with this definition the wet season begins in late October and ends on May 15 of the following year, It thus extends over a period of 225 days (at 30 days per month) while the dry season takes only 135 days. The values of the average flow are represented by the Table 2.
The average flow of the dry season is therefore only 70% of that of the wet season and 78% of average annual flow 576.5 l/s.
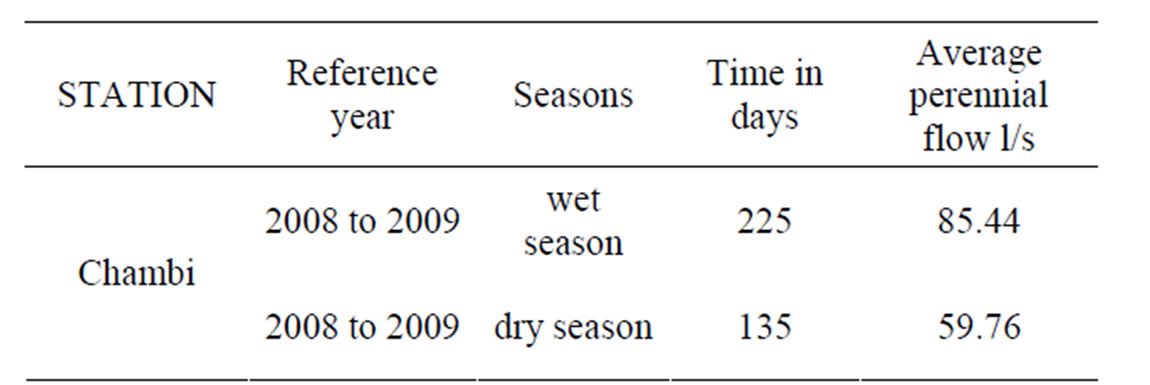
Table 2. Average perennial flow.
Excess and deficit flow Calculation
On the basis on the previous definition, the dry season is characterized by an excess flow. This excess volume passed during this season is represented in the same figure by the area between the right of the mean annual flow and the monthly perennial flow curve. This surface can also be represented by a rectangle with length of time (225 days) and the width difference between the average flow of the wet season and the average annual flow:


The excess volume expired during the wet season would be
The calculation of the deficit in the dry season is by the same method:

Indeed, this excess volume of the wet season can be used during the dry season by groundwater recharge. The groundwater level will then drop almost 2 times the current at the end of the dry season, because the excess is almost equal to the deficit. This intensity will depend especially on the flood. We believe this will regulate the flow of the river and approach the annual average value (76.5 l/s).
3) Flow characteristics (Figure 8)
This water shortage may be exacerbated due to climate change, particularly changes in precipitation. To understand the dynamic of water availability and possible effects of long-term climate changes, it is helpful to have an analysis of variation trends in precipitation, other climatic factors [18] and flow characteristics: accumulation and direction flow, subwatershed delineation... By the DEM simulation [19], has provided some ideas on the direction and flow accumulation, as it allowed us to automatically extract the drainage network and compare it with a scan from the topographic base, as well as delineate the watershed and sub watershed extrapolation [20].
Flow direction
It is explained by the fact that each cell contains the direction (Freeman code) to which water flows.
Flow accumulation
This command of Arc Hydro tools is used to calculate the directions of flows in each cell, the amount of water accumulated in the cell due to the flow. This command specifies a weighting representing such the quantities of precipitation.
Watershed
This allows us to generate a grid containing the delineation of watershed and sub watershed [21,22].
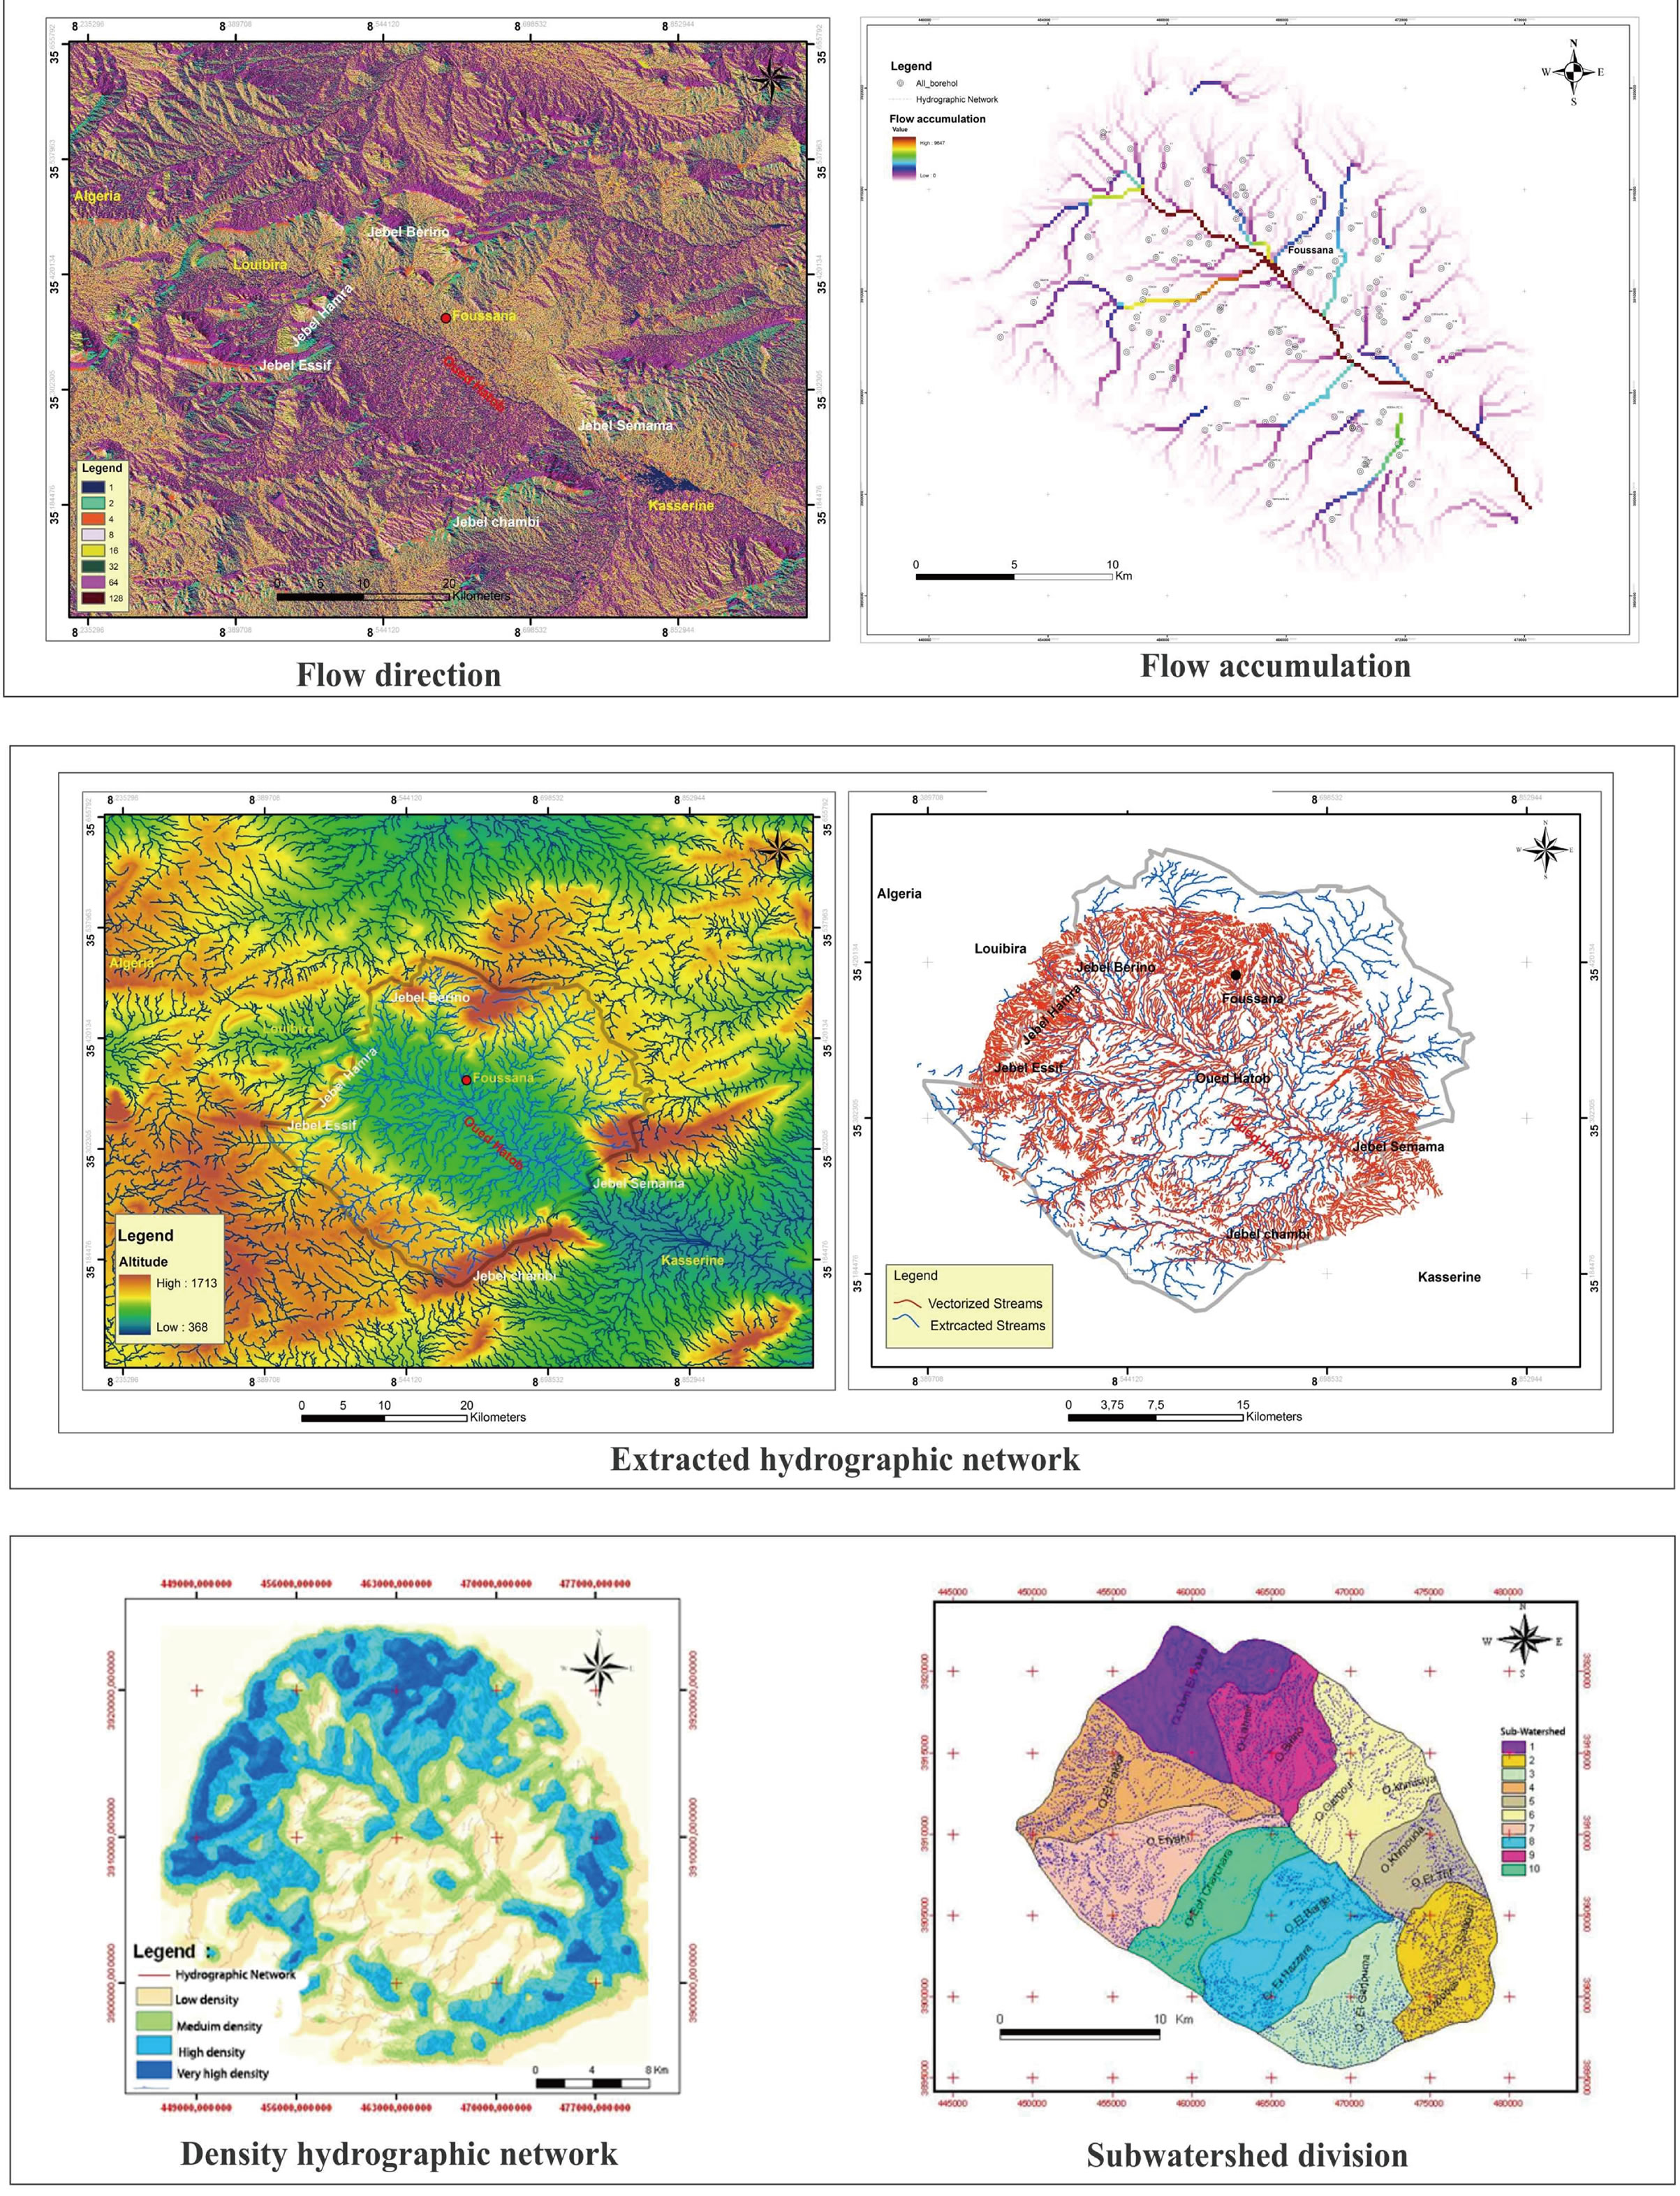
Figure 8. Flow maps.
Hydrographical network
This command can generate a shape file (lines) corresponding to the drainage network theory.
He has been compared by the network's digital topographic chart.
Density map of water system
The realization of the density map of the hydrographic network from a DEM [23] allowed us to determine the concentration areas of river systems, which can locate the main points of power groundwater aquifers in the region [24], which are modeling this after the existing anticlines around the ditch and those mainly in the western or upstream of the basin, represented by the anticline Jebel Berino and Jebel Hamra, so a more or less important part located in the north of the ditch, and the levels of the downstream portion designated by Jebel Semmama and Jebel J Chambi.
4.2.4. Hydrogeological Modeling
1) Piezometric levels and depth to water table (Figure 9).
The isopiestic curve is determined by measuring different values of the depth to water table [25]. The depths are variable which are low in the Northern part of the study area.
The flow is converging towards the Oued Hatob which is situated in the center of the Foussana gap. In this case, the water flow circulates mainly from anticlines NorthEast (Berino, Hamra) and Southwest (Essif) sector.
The depth of water table map established, by interpolation of water table data, shows low values in the center of the study area . This zone constitutes a suitable zone for future exploitation. So, the determination of the water table and the isopiestic levels are of great importance in the management projects [26].
2) Conductivity and Hydrochemistry data.
Knowledge of the water chemical composition is necessary to comprehend each hydrogeologic system and help to propose which are the suitable areas for future well implantation. This is also can be done on the basis of the thematic maps already elaborated [27].
The correlation between salinity map and conductivity one reveals a high similarity. In fact, towards the center of the aquifer, the salinity increases. This is due to the impact of the anthropogenic activities and the overexploitation. In these zones, it correspond a low depth of groundwater and high productivity (Figure 9). For these reasons, it is recommended to the central part of the study area.
Geostatistical and trend analysis of major chemical elements are carried out by calculation of the basic moments (Figure 10), run test, trend analysis of the annual maximum daily flow at 72 borehole above Foussana Basin.
5. Discussion
In this study, the primary aim was to better understand the processes involved, rather than focusing on prior prediction of poor water events [28]. Where a predictive element was included it was for the numerical value of indicator organisms, which was then considered against a set compliance limit and will constitute an object for further researches.
The main plans and photographic information in ortho-vectors collected and produced during this work will be stacked and draped on the DEM (Figure 11) which can facilitate the 3D geological modeling, structural and hydrological crossover and use of data acquired.
The figure below helps to visualize the 3D spatially diverse geological structure which gives a detailed picture of the geomorphology of the area that was already mentioned.
The figure 11 was used to observe directly the geometrical extension of the watershed, the distribution of water points, and the drainage system and check for any divergences that might exist between the geological map and actual position of the boundary [29]. We could check the consistency of the contours of a geological map with some geological objects, as well as modeling the structural impact on the watershed and the hydrosystem, and the spatial extent of the West Kasserine fault.
In this case, and depending on the resolution of the DEM, multi-data are integrated and concerning the ground cover such as buildings and plant to add height to the altitude of the land on which they are located.
The theory of hydrological science is a basis and foundation for constructing the model of the aquifer system. However, the water cycle processes are complex considering the hydrological, land surface and atmospheric processes, etc., and a final model is abstracted from reality system [30], which can represent a decision support for mangers.
6. Conclusions
The development of the DEM has provided significant results. Hence, a DEM was developed and some results and interpretations were developed. The high resolution of this document has made the detection and mapping of the geological boundaries and the tectonic structures and their impact on the hydrosystem possible From a general point of view, DEM are valuable source of topographic information, especially regarding the drainage network systems and the watersheds.
The methodology adopted in this study allowed determining hydrological parameters and verifying the model of the geometry of the watershed.
The coupling of these multi-scale maps with elevation data, allows us to visualize and to model the 3D geometry,

Figure 9. Piezomtry, condctivity and salimity maps.

Figure 10. Geospatial distribution of hydrochemistry data.
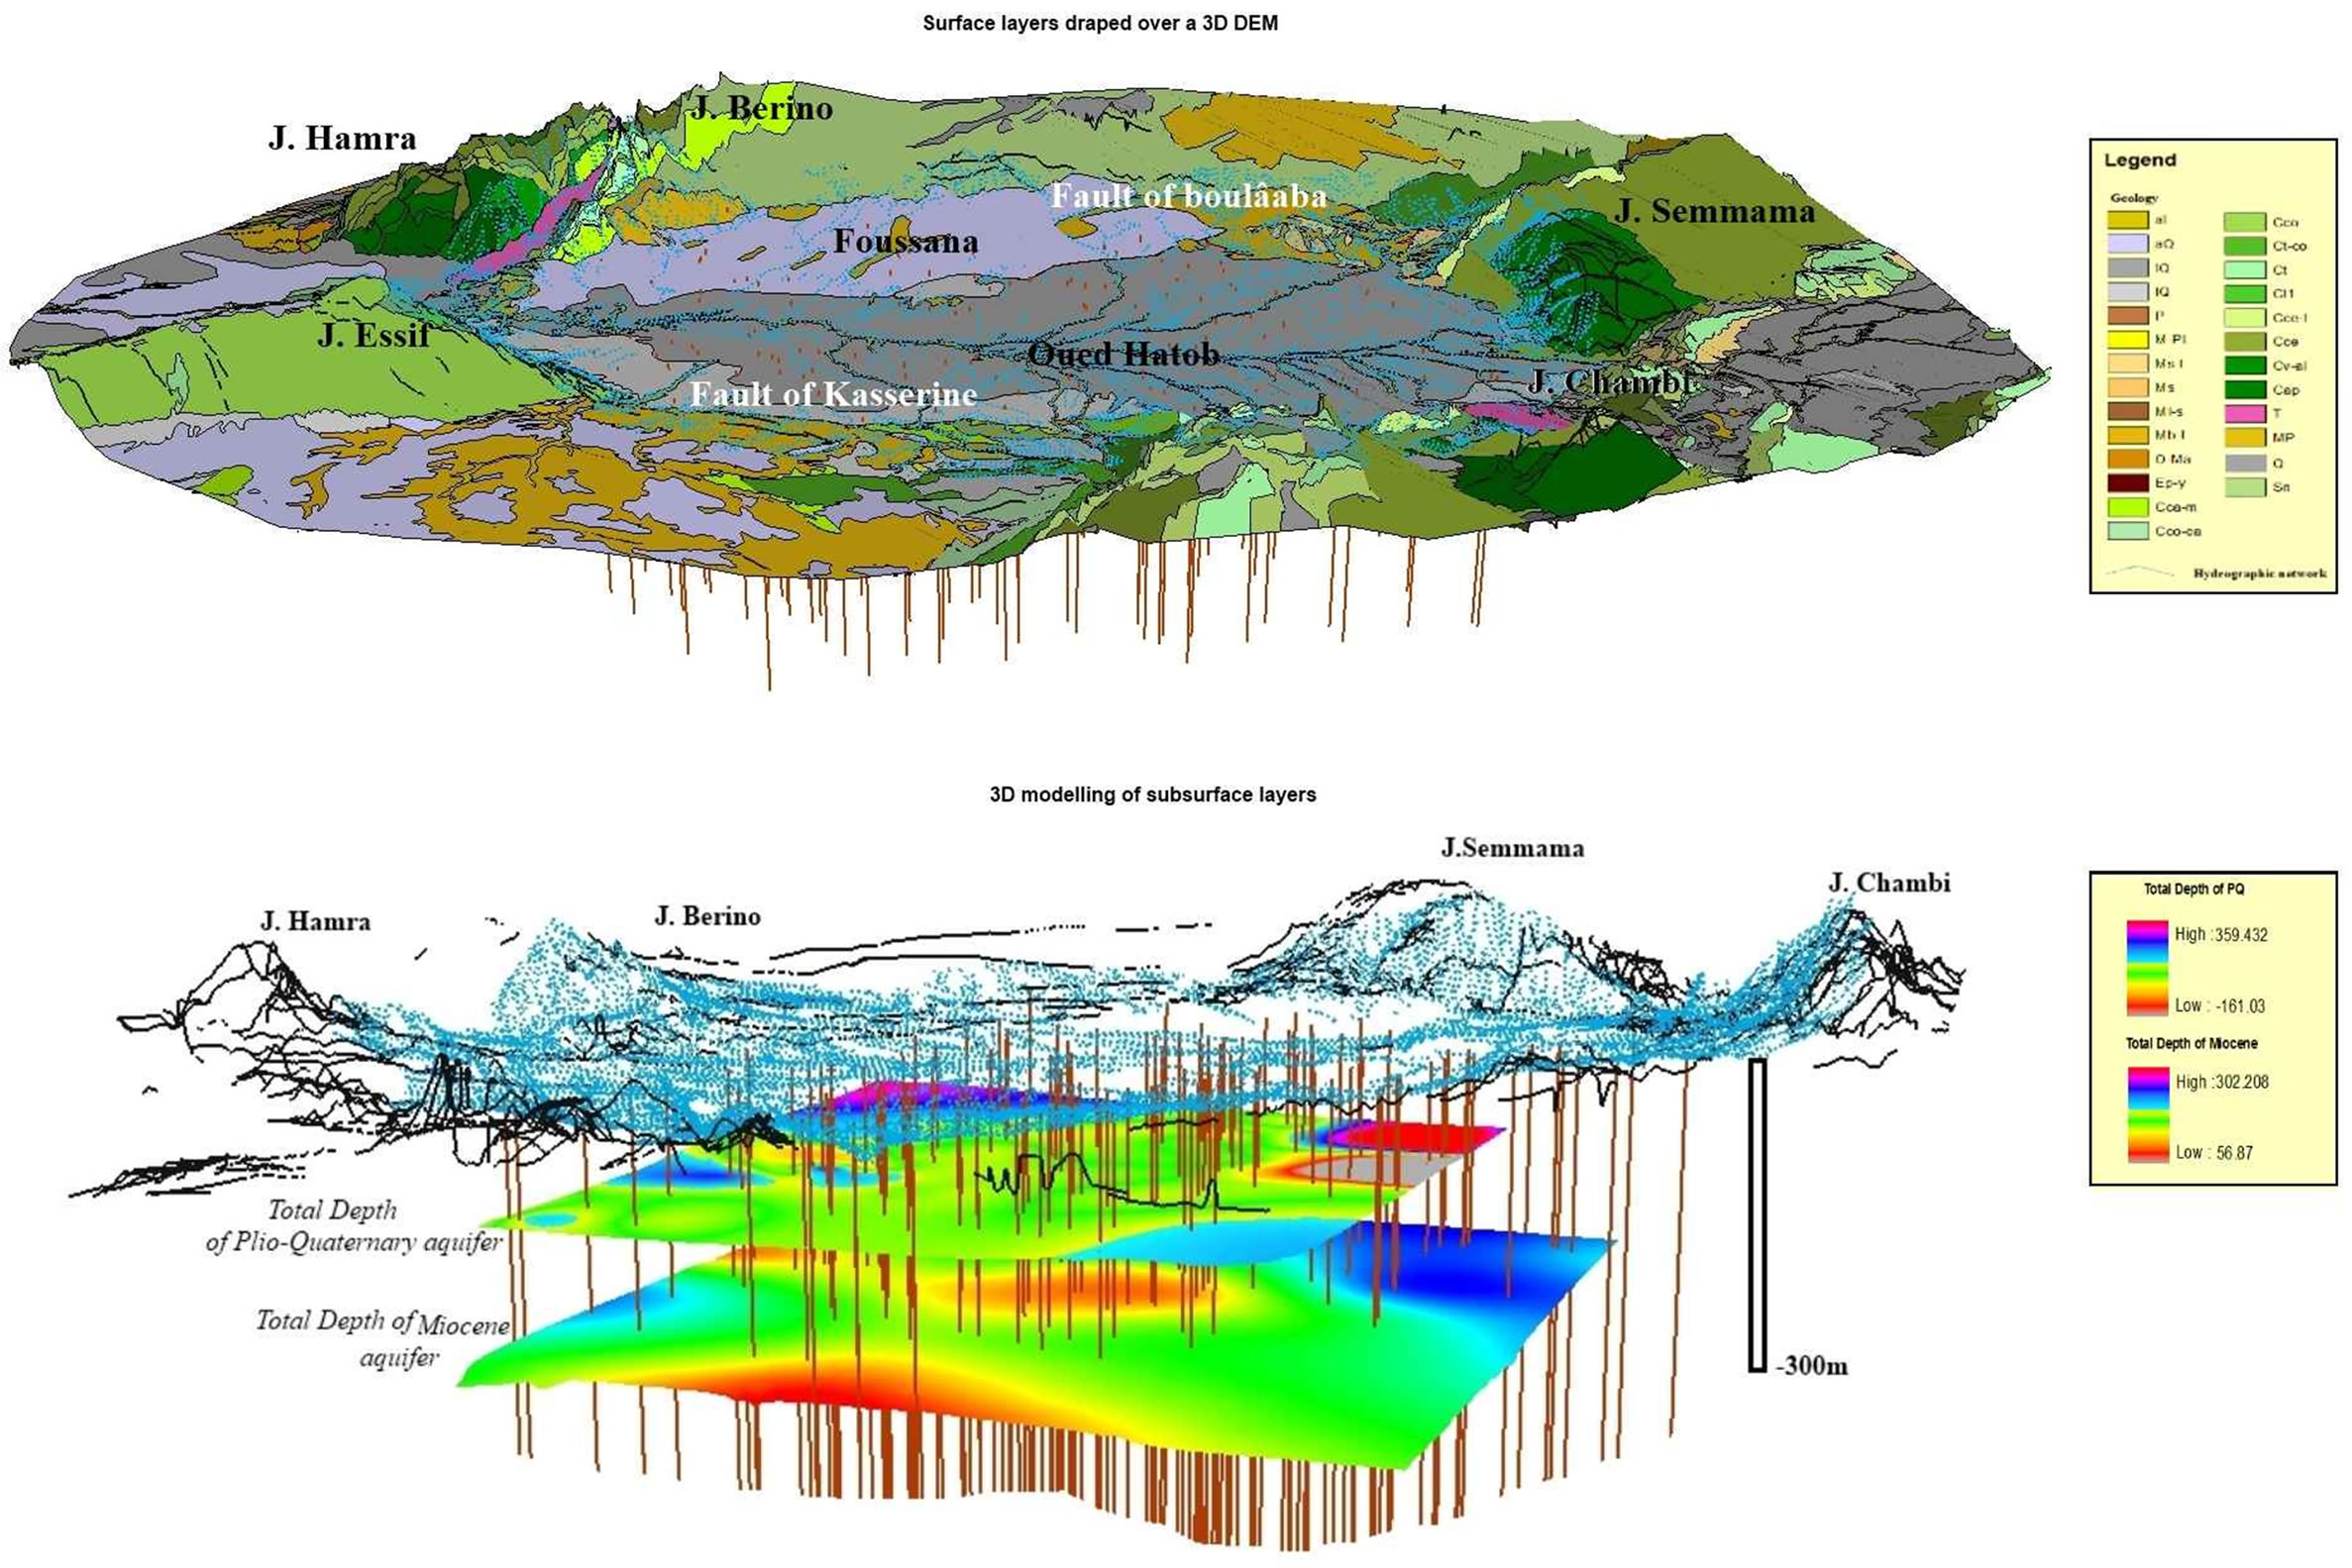
Figure 11. 3D modeling of Foussana groundwater.
surface properties and geomorphology. These results are of great importance and can be applied for analyzing and studying the hydrological catchments of watersheds with complex morphology.
This study reveals that Geographical Information System (GIS) is of paramount importance in water resources management and enhancing water supplies in arid and semi-arid regions. The main advantages of GIS are: 1) it provides additional information from simple data by using DEM; 2) it helps to exploit and manage a huge quantity of data and generate thematic maps; 3) it can help to comprehend and hydrogeologic system and coupling quantitative and qualitative data in order to generate management scenarios.
REFERENCES
- L. Pervinquere, “Geological Study of Central Tunisia,” Ph.D. Thesis, Es-Science University, Paris, 1903, 360 pages.
- M. Ross and P. Tara, “Integrated Hydrologic Modeling with Geographic Information Systems,” Journal of Water Resources Planning and Management, Vol. 119, No. 2, 1993, pp. 129-140. doi:10.1061/(ASCE)0733-9496(1993)119:2(129)
- A. Kadri, “Evolution Tectono-Sedimentary (AptianQuaternary) Dj. Koumine, Hamra Lessouda (Central Tunisia),” 3rd Cycle Thesis, University Paris-11, Orsay, 1988, 221 pages.
- H. Zouari, “Structural Studies of Jebel Chambi (Central Tunisia). Relationship between the Mineralization and Structure,” 3rd Cycle Thesis, University of Franche-Comté, Besancon, 1984, p. 335.
- P. F. Burollet, “Contribution to the Study of Stratigraphic Central Tunisia,” Anal Mines and Geology, Vol. 18, No. 3, 1956, pp. 1-350.
- M. H. Negra, “Deposits of Platform-Basin of the Upper Cretaceous in North-Central Tunisia (Formation and Associated Facies Abiod): Stratigraphy, Sedimentation, Diagenesis and Oil Interest,” PhD Thesis, University of Tunis II, Tunis, 1994, 649 pages.
- A. M'Rabet, “Stratigraphy, Sedimentology and Diagenesis of Carbonate Series of the Lower Cretaceous of Central Tunisia,” Ph.D. Thesis, University Paris-Sud Orsay, 1981, 412 pages.
- F. Jamoussi, C. Abbots, E. Fakhfakh, M. Bedir, S. Kharbachi, M. Soussi, F. Zargouni and A. Lopez-Galindo, “Discovery of Eocene Continental around the Archipelago Kasserine, the Jebels Rheouis, Boudinar Chamsi and in Southern-Central Tunisia: New Paleogeographic Implications,” Compte Rendue de l’Académie des Sciences de Paris, Vol. 333, 2001, pp. 329-335.
- Z. El Morjani, “Designing a System of Spatial Information for Environmental Management, and Applications to the Selection of Potential Sites for Storage of Household and Industrial Wastes in Semi-Arid (Souss, Morocco),” Thesis, Forel Institute-A, Department of Mineralogy, University of Geneva, 2003, Geneva, 99 pages.
- A. G. M. Osman and W. Kloas, “Water Quality and Heavy Metal Monitoring in Water, Sediments, and Tissues of African Catfish Clarias gariepinus (Burchell, 1822) from the River Nile, Egypt,” Journal of Environmental Protection, Vol. 1, No. 4, 2010, pp. 389-400. doi:10.4236/jep.2010.14045
- R. Laurini, F. Millieret-Illeret-Rafford, “Databases Geomatics,” Hermès, Paris, 1993, 340 pages.
- S. Aronoff, “Geographic Information Systems, a Management Perspective,” Ottawa, WDL Publications, 1991, 294 pages.
- G. B. Wright, J. A. Swaffield and S. Arthur, “Investigation into the Performance Characteristics of Multioutlet Siphonic Rainwater Systems,” Building Services Engineering Research & Technology, Vol. 23, No. 3, 2002, pp. 127-141. doi:10.1191/0143624402br041oa
- C. Bill and R. Simon, “Automated Rig Removal with Bayesian Motion Interpolation,” The Foundry, London, 1998, 5 pages.
- C. Collet, “Geographic Information Systems in Image Mode,” Presses University Romandes and Polytechnics, Swizelnd, 1992, 186 pages.
- W. Wu and R. C. Siddle, “A Distributed Slope Stability Model for Steep Forested Basins,” Water Resources Research, Vol. 31, No. 8, 1995, pp. 2097-2110. doi:10.1029/95WR01136
- B. H. Kacem, “Numerical Modeling of Hydrology for the Help in the Management of Watersheds through the Joint Use of Geographic Information Systems and the Finite Element Method,” PhD Thesis, University Laval, Quebec, 1998.
- F. Lan, L. Changhe, Y. Biao and C. Zhao, “Long-Term Trends of Precipitation in the North China Plain,” Journal of Geographical Sciences, Vol. 22, No. 6, 2012, pp. 989- 1001. doi:10.1007/s11442-012-0978-2
- K. Kovarmm and H. P. Nachnebelmm, “Application of Geographic Information Systems in Hydrology and Water Resources Management,” IAHS Publication No. 211, 1993, 693 pages.
- M. Bouzelboudjen and F. Kimmei, “Geographic Information System, Geostatistical Methods and 3-D Numerical Simulation of Groundwater Flow in Porous Media Strongly Heterogeneous,” Geology-CH'97 Workshop on Application of GIS in Geology, National Geological and Hydrological Service (LHG), Bern, 5 December 1997, pp. 18-19.
- M. Bouzelboudjenm, L. Király, F. Kimmei and F. Zwahlen, “Schematic Representation of Groundwater Flows in Switzerland,” Hydrogeological Profiles from Mathematical Models 3-D Finite Elements, Plate 8.3 of the Hydrological Atlas of Switzerland, Institute of Geography, University of Bern, Federal Office of Topography and National Hydrological and Geological Survey, Bern, 1997.
- J. P. Chiles, “The Geostatistical Modeling of Spatial Variability and Its Applications,” Thesis, University Pierre et Marie Curie, Paris 2004, 71 pages.
- C. Soumaya., A. Wanissa and C. Moncef, “Hydrogeological Study of the Aquifer System in Central Tunisia: New System Structuring of Horchane Aquifers,” Journal of Water Resource and Protection, Vol. 5, No. 5, 2013, pp. 502-510. doi:10.4236/jwarp.2013.55050
- W. E. Dietrich, C. J. Wilson and J. McKean, “Analysis of Erosion Thresholds, Channel Networks, and Landscape Morphology Using Terrain Model,” Journal of Geology, Vol. 101, 1993. pp. 259-278. doi:10.1086/648220
- J. Xia, H. Du, S. D. Zeng, D. X. She, Y. Y. Zhang, Z. Q. Yan and Y. Ye, “Temporal and Spatial Variations and Statistical Models of Extreme Runoff in Huaihe River Basin during 1956-2010,” Journal of Geographical Sciences, Vol. 22, No. 6, 2012, pp. 1045-1060. doi:10.1007/s11442-012-0982-6
- G. B. Engelen and H. Kloosterman, “Hydrological Systems Analysis, Methods and Applications,” TNO Institute of Applied Geoscience, Delft, 1996, 149 pages.
- E. K. Ahialey, Y. Serfoh-Armah and B. K. Kortatsi, “Hydrochemical Analysis of Groundwater in the Lower Pra Basin of Ghana,” Journal of Water Resource and Protection, Vol. 5, No. 2, 2010, pp. 864-871. doi:10.4236/jwarp.2010.210103
- R. Stidson, C. A. Gray and C. D. McPhail, “Development and Use of Modeling Techniques for Real-Time Bathing Water Quality Predictions,” Water and Environment Journal, Vol. 26, No. 1, 2011, pp. 7-18. doi:10.1111/j.1747-6593.2011.00258.x
- D. R. Maidment, “Environmental Modeling within GIS. GIS and Environmental Modeling with GIS: Progress and Research Issues,” GIS World, Ford Collins, 1996, pp. 315-324.
- X. M. Song, C. S. Zhan, F. Z. Kong and J. Xia, “Advances in the Study of Uncertainty Quantification of Large-Scale Hydrological Modeling System,” Journal of Geographical Sciences, Vol. 21, No. 5, 2011, pp. 801-819. doi:10.1007/s11442-011-0881-2