Journal of Water Resource and Protection
Vol.4 No.2(2012), Article ID:17426,6 pages DOI:10.4236/jwarp.2012.42011
Adsorption of Dye Eosin from an Aqueous Solution on Two Different Samples of Activated Carbon by Static Batch Method
Institute of Fashion Technology, Panjab University, Chandigarh, India
Email: kaushikrita@rocketmail.com
Received December 16, 2011; revised January 11, 2012; accepted February 5, 2012
Keywords: Adsorption; Eosin; Activated Carbon; Textile Industry Effluent
ABSTRACT
Removal of dye Eosin on two different samples of activated carbon by static batch method was studied. Experimental data on optical density of blank solutions of different concentrations ranging from 10 to 100 mg/L and optical density of solutions after adsorption on activated carbon samples were taken and analyzed. Calibration curves were plotted and the amount of dye adsorbed was calculated. The data was fitted to Langmuir and Freundlich isotherms for two different carbon samples and different concentration values. Constants were calculated from the slope and intercept values of the isotherms. Coefficient of correlation R2 and Standard Deviation SD were also noted. The data fitted well to the isotherms. It was observed that adsorption decreased with increase in ppm concentrations. Carbon sample C2 showed higher potential to adsorb the dye Eosin as compared to carbon sample C1. Further Carbon sample C2 showed better adsorption in acidic pH as compared to in alkaline pH. From the analysis of the data it is shown that C2 sample has a good capacity to remove the textile dye from the residue water.
1. Introduction
Dyestuffs are being used by a large number of industries to color their products and make their appearance more attractive. Textile dyeing industry uses a lot of synthetic dyes due to their superior dyeing properties, especially in terms of fastness. This industry emits significant amounts of synthetic textile organic dye wastes amongst all Industrial waste waters. 10.000 different types of dyes and pigments and dyes are being manufactured worldwide annually. Approximately it is estimated that 10% to 15% of the dye is lost in the effluent during the dyeing process , Young et al., 1997; Danis et al., 1998 [1]. The waste water after the dyeing process carries the residual and unspent dye substances which are usually discharged into the environment as such without being treated. This discharged effluent is toxic in nature, imparts color to the receiving water or soil and interferes with both land and aquatic plant and animal life, Kadirvelu et al., 2003 [2]. Considering the effect the textile dye effluent is having on all forms of life increasingly strict laws related to decontamination of wastewater are being passed by various nations. Use of activated carbon has been proposed the for the purpose of decontaminating the colored water. More so because carbons can be re activated and regenerated for repeated use. It has been seen that a lot of industrial or agricultural by-products can be used for the production of carbon-based adsorbents. This helps in conserving the nonrenewable natural resources and creating a useful product that has a potential use in pollution control.
Sajjla Sreedhar Reddy, Bijjam Kotaiah, Nanaga Siva Prasad Reddy, Murthukumara Velu [1] studied the removal of composite reactive dye from dyeing unit effluxent using sewage sludge derived Activated Carbon which was prepared from dried municipal sewage sludge. Batch mode adsorption experiments were conducted to study its potential to remove composite reactive dye from dyeing unit effluent. Adsorption parameters for the Langmuir and Freundlich isotherms were determined and the effects of effluent pH, adsorbent dosage, contact time and initial dye concentration were observed.
Yamin Yasin, Mohd Zobir Hussein and Faujan Hj Ahmad [3] studied the adsorption of methylene blue onto treated and untreated activated carbon. The effects of various experimental parameters such as contact time, solution pH and adsorbent dosage were observed. The extent of methylene blue removal increased with the increased contact time, solution pH and amount of adsorbent used. Adsorption data was better fitted to the Langmuir isotherm. The results in this study indicated that the treated activated carbon was an attractive candidate for removing organic dye of methylene blue which shows great reduction of colour while reducing the time contact to achieve equilibrium.
Ying Li, Qin-Yan Yue, Bao-Yu Gao, Jing Yang, Yan Zheng [4] studied the adsorption capability of activated carbon fiber (ACF) to four reactive dyes (reactive brilliant red K-2BP, reactive turquoise blue KN-G, reactive golden yellow K-3RP, reactive black KN-B) in aqueous solution. The results showed that the equilibrium adsorbing capacity qe of each dye increases with the addition to initial concentration or temperature. On the same condition, the order of qe is: reactive brilliant red > reactive golden yellow > reactive black > reactive turquoise blue.
Soheila Izadyar, Maryam Rahimi [5] studied the use of beech wood sawdust, an industrial waste, for adsorption of textile dyes. Adsorption of Direct Orange 26, Acid Orange 7, Acid Green 20 dyes was investigated. Langmuir and Freundlich isotherm models were used for data analysis. This study showed that the beech wood sawdust could be employed as low-cost and effective sorbent for the removal of dyes from aqueous solution M. Husseien, A. A. Amer, Azza, El-Maghraby, Nahla. A. Tahaused [6] used barley straw as a raw material to produce activated carbon and utilized it as a source for removal of Methylene Blue from simulated aqueous soltion. The adsorption capacity was demonstrated by the isotherms. The effects of different system variables, adsorbent dosage, initial dye concentration, pH and contact time were studied. The results showed that as the amount of the adsorbent was increased, the percentage of dye removal increased accordingly. Higher adsorption percentages were observed at lower concentrations of Methylene blue. Optimum pH value for dye adsorption was determined as 7. Maximum dye was adsorbed within 90 minutes of beginning time for every experiment.
Sreedhar Reddy, B. Kotaiah [7] studied the sorption of dyes from aqueous solutions on to sludge-based activated carbon and compared it with commercial activated carbon. Adsorption parameters for the Langmuir and Freundlich isotherms were determined and the effects of effluent pH, adsorbent dosage, contact time and initial dye concentration were studied.
Nagarethinam Kannan and Soundrapandian Murugavel [8] conducted studies on the removal of Rhodamine-B (RB), Congo Red (CR) and Acid Violet (AV) by column method on Iron Chromium Oxide (ICO) and Lignite Coal (LC). The experiment was carried out at 30˚C ± 1˚C. Effect of various experimental parameters were investigated to get the information on treating effluents from the textile industries. The percentage removal of dyes (RB, CR and AV) increased with decrease in the initial concentration of dyes and increased with the increase in the contact time and the dose of adsorbent (in terms of column height). The percentage removal of CR and AV increased with decrease in the initial pH, but decreased for RB due to the nature of the dyes. Adsorption data were modeled with Langmuir adsorption isotherms. The adsorption capacities of ICO and LC were compared with that of commercial activated carbon (CAC). The results indicate that the materials like ICO and LC could be employed as low cost adsorbents as alternative to CAC in wastewater treatment for the removal of dyes.
Rita Kant and V. K. Rattan [9] studied the removal of dye Green B. by adsorption on activated carbon through static batch method and continuous process. The data was fitted to Langmuir and Freundlich isotherms. It was found that adsorption was better in batch process as compared to continuous flow method. The carbon samples exhibited a good capacity to remove the dye Green B. from the textile industry effluent.
2. Experimental
Samples of Granular Activated Carbon C1 and C2 used were obtained from Brillex Chemical Ltd. Punjab and Industrial Carbon Pvt. Ltd., Gujarat respectively.
A stock solution of the dye with a concentration of 1000 ppm was prepared and dilutions were made with distilled water to make different concentrations. Optical density of all the solutions was measured on a spectrophotometer (ELICO make, wavelength range 200 - 900 nm). One gram of activated carbon was placed in each 50 mL solution of 10 to 100 ppm. The solutions were shaken and kept in a thermostat for 24 hr. The samples were then filtered and analyzed spectrophotometrically.
3. Results and Discussion
Table 1 shows the amount qe of dye Eosin adsorbed by C1 and C2 samples of Granulated Activated Carbon at various pH values and ppm concentrations.
3.1. Adsorption on Different GAC Samples
Adsorption of dye Eosin was studied on two samples of granulated activated carbon. Table 1 shows the amount of Eosin adsorbed on the two GAC samples in same pH environment. It can be seen that at a constant dose of the adsorbent of 1 gm/50 ml of dye solution carbon samples C1 and C2 exhibited almost similar adsorption capacity at the same pH value of 6.22.
3.2. Effect of Initial Dye Concentration.
Table 1 again shows the amount qe of dye Eosin adsorbed by C1 and C2 samples of granulated activated carbon at various ppm concentrations. It can be seen that qe on GAC C1 and C2 was higher at lower ppm concentration as compared to the adsorption at higher ppm concentration with the adsorbent dose being kept constant. At lower ppm concentration a substantial amount of dye got adsorbed leaving behind a good number of free adsorption sites on the adsorbent. At higher ppm concentrations the adsorbent was used to its greater capacity and lesser number of active sites remained available on GAC surface for further adsorption to take place.
3.3. Effect of PH
Adsorption of dye Eosin on carbon sample C2 was greatly effected by change in pH of the aqueous solution as can be seen from Table 1 and Figure 1. Amount of dye adsorbed qe on C2 in acidic pH was higher at all ppm concentrations as compared to adsorption in a lesser acidic and an alkaline and environment. At initial dye concentration of 10 mg·dye/L the adsorption is 7.5 mg/g on GAC C2 in acidic environment. At the same ppm concentration in alkaline pH it is 5.09 mg/g and 5.2 mg/g at a mildly acidic pH.
3.4. Data Fit to Polynomial Isotherm
Table 2 shows the values of the constants A, B1, B2 along with values of coefficient of correlation R2 and standard deviation SD.
The experimental data was fitted to the polynomial equation:
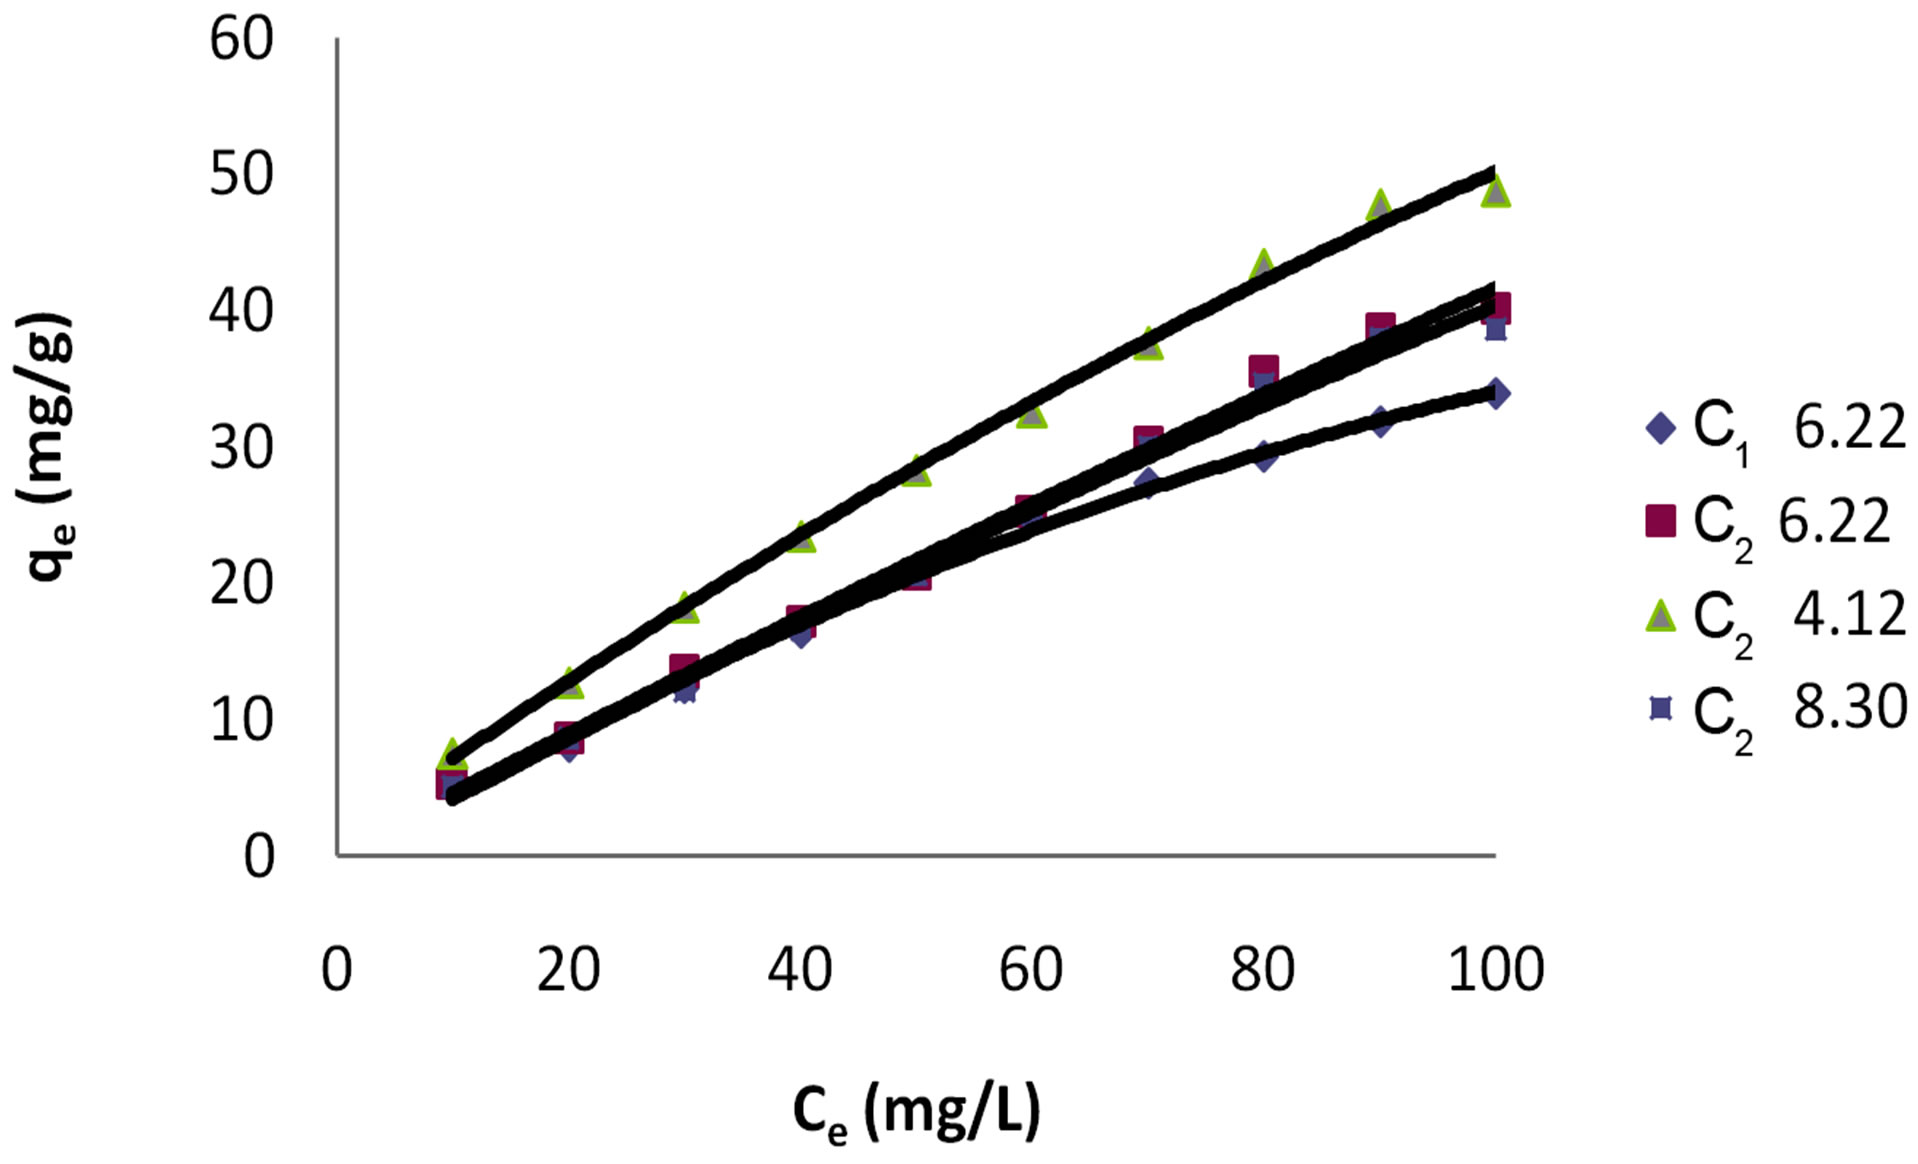
Figure 1. Polynomial Isotherm for dye Eosin on C1 & C2 at different pH values.
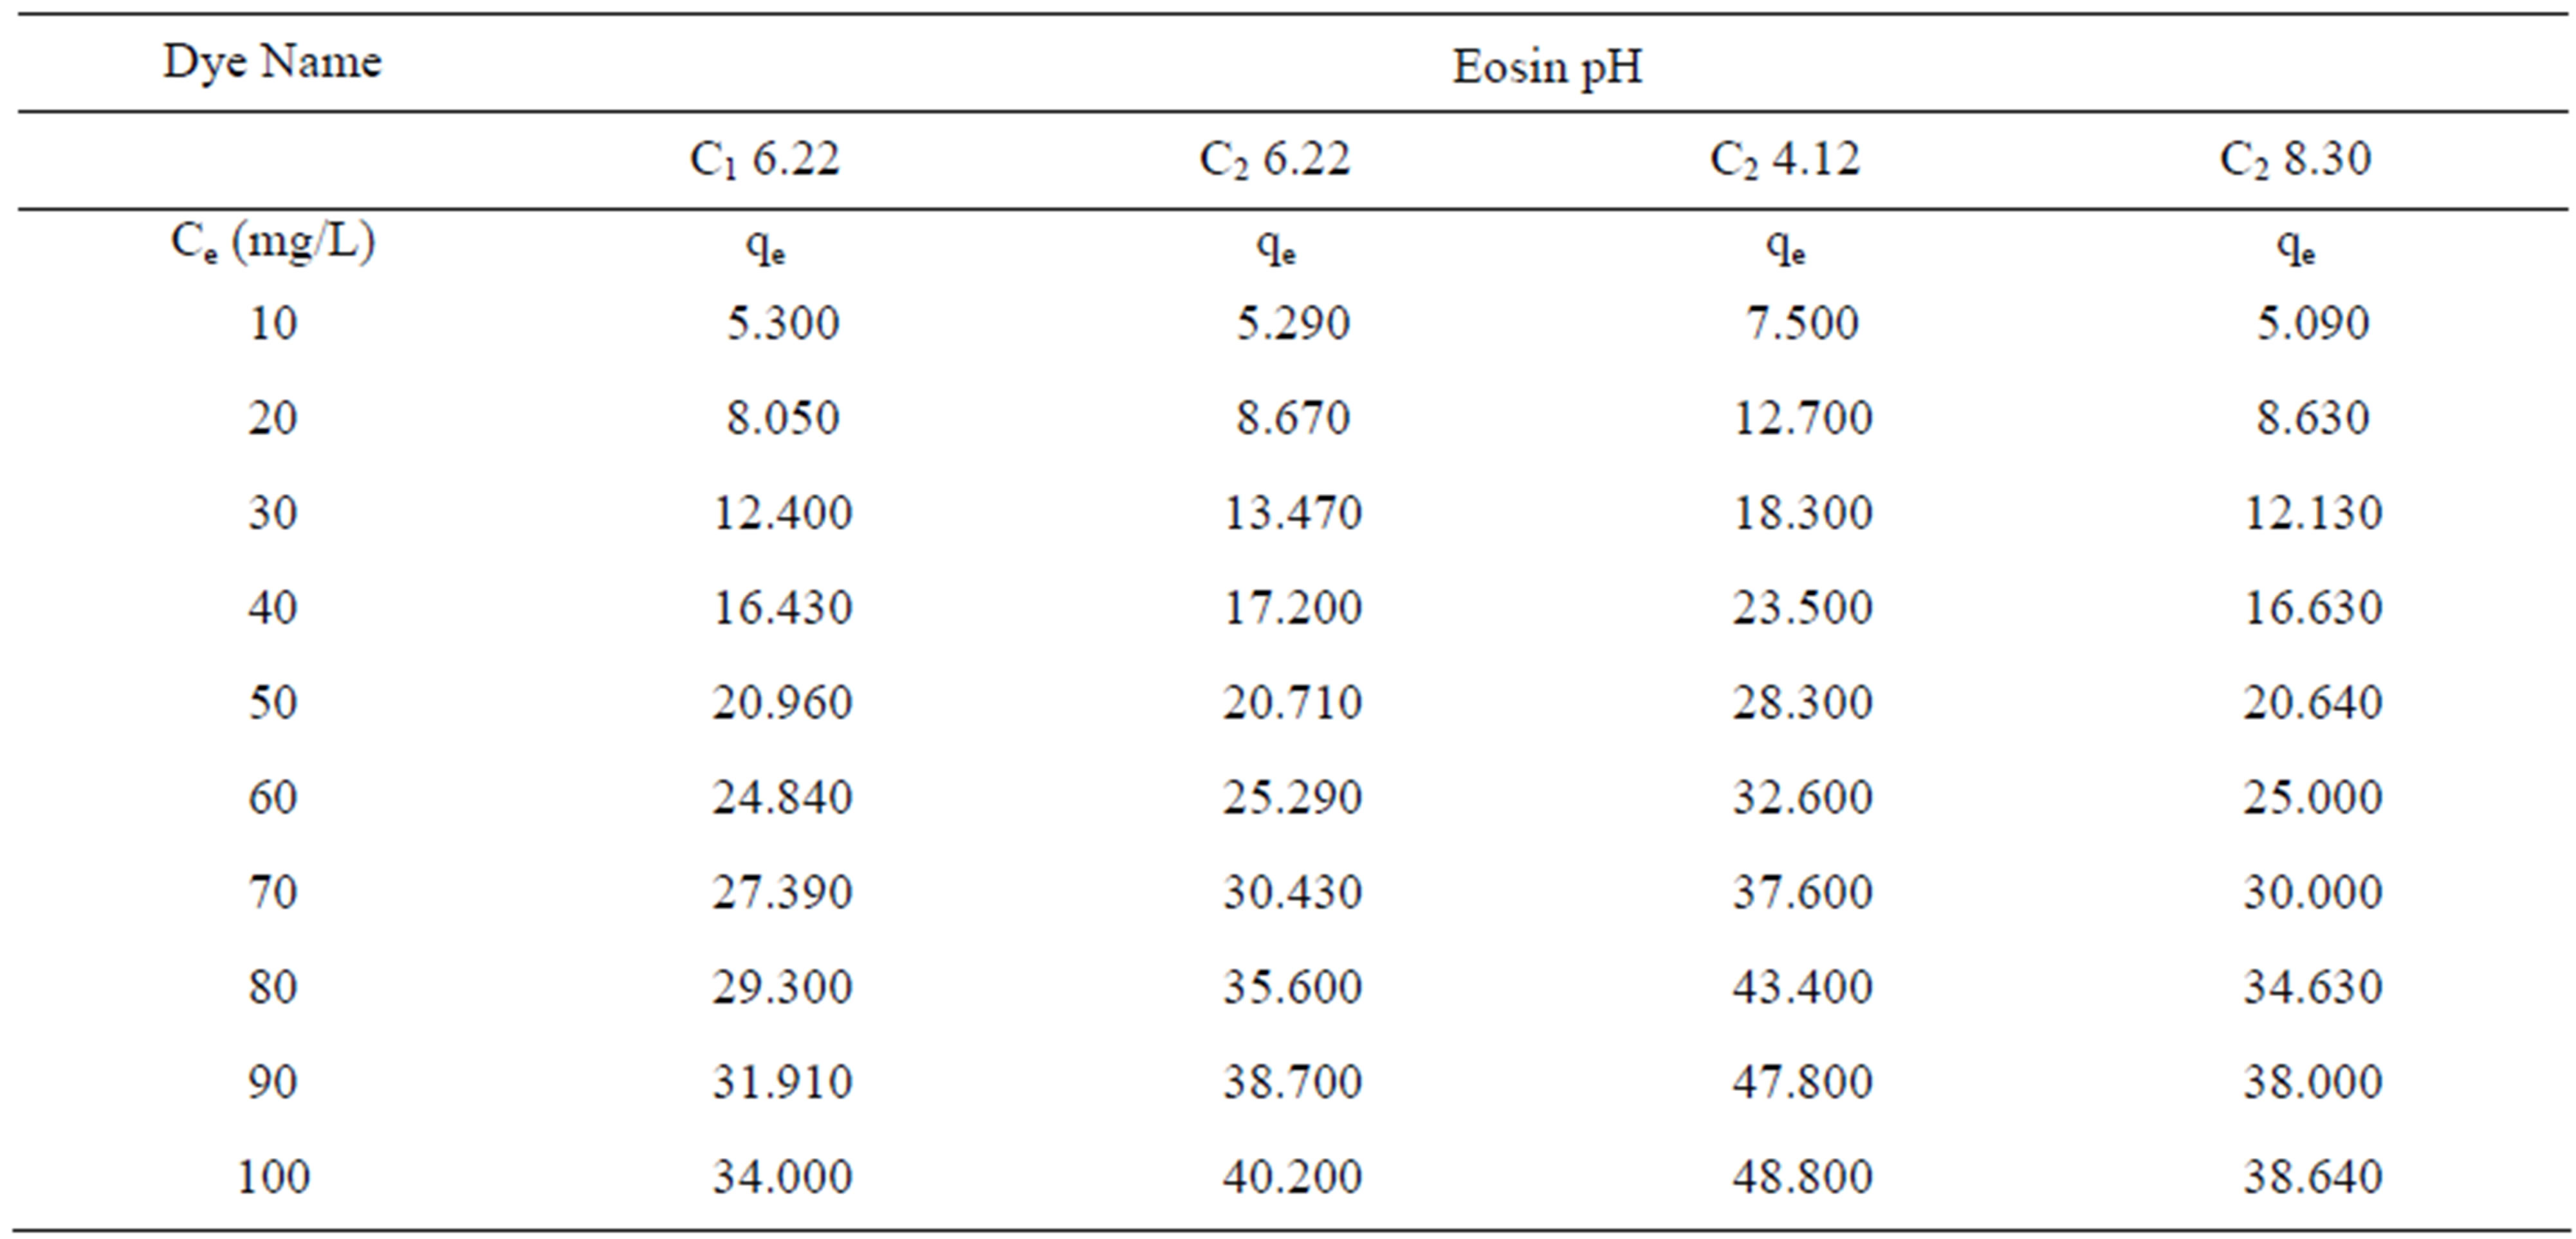
Table 1. Concentration of dyes (Ce) and amount of dye adsorbed per gram of the adsorbent (qe) on C1 & C2 at different pH.
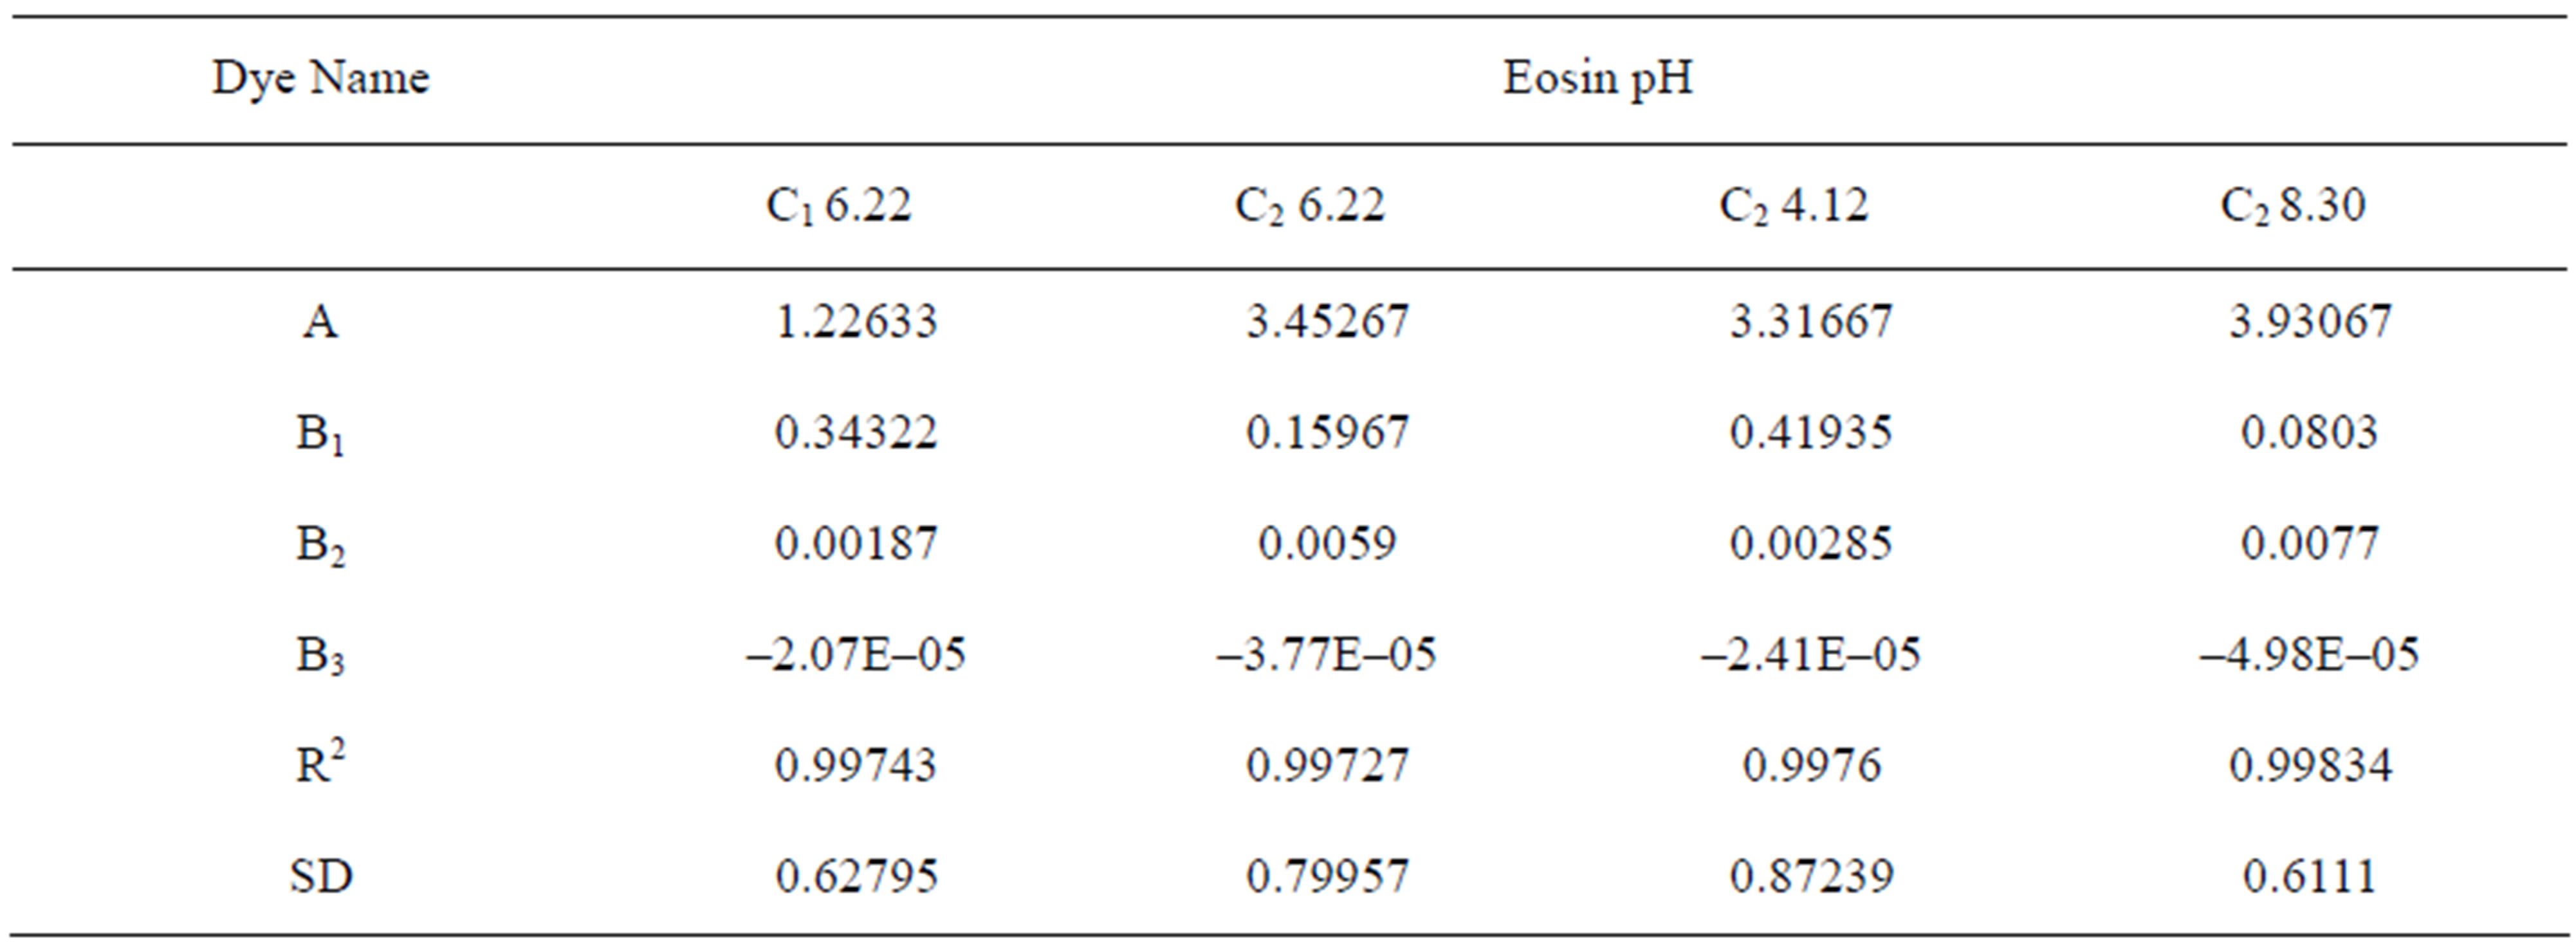
Table 2. Constants for Polynomial Isotherm at various pH values.
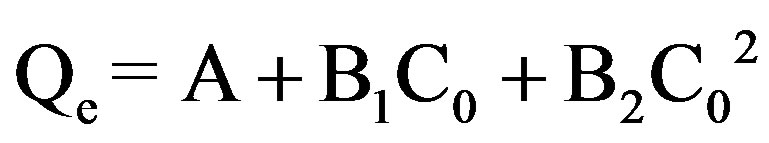 (1)
(1)
where C0 is the initial concentration of the dye.
Figure 1 shows the adsorption (qe) at all three pH values at lower concentrations of Eosin. It can be seen that adsorption increases linearly and gets stable at higher concentration. It shows a better adsorption at an acidic pH of 4.12 as compared to adsorption at slightly acidic pH of 6.22 and alkaline pH of 8.30. It can thus be drawn that acidic pH is best suited for adsorption dye Eosin and that it exhibits a linear behavior.
3.5. Data Fit to Langmuir Isotherms at Various PH
Linear forms of Langmuir isotherms were plotted. The experimental data was fitted to Langmuir isotherm of the type:
 (2)
(2)
qe indicates the amount of dye adsorbed per unit weight of adsorbent (mg/g). Ce is the equilibrium concentration of dye in mg/L. Q and b are the Langmuir constants where Q indicates the adsorption capacity in mg/g and b relates to the energy of adsorption (L/mg) in different experimental conditions. These were calculated from the straight line slope and intercept of linear plot between 1/qe and 1/Ce.
Table 3 gives the values of Langmuir constants Q and b along with the values of r2, RL and SD for all pH values and for the two samples of GAC, C1 and C2. RL values indicate the shape of the isotherm. Value of RL between 0 and one indicate a favorable adsorption [10]. RL > 1 is unfavorable. RL = 1 is linear. 0 > RL < 1 is favorable .RL = 0 is irreversible.
Value of Q in Table 3 signifies good adsorption of Eosin on C2 as compared to C1 at initial pH. As the values of RL are seen to lie between 0 and 1 the system can be said to have shown a favorable adsorption
The linear plots of 1/qe and 1/Ce for Langmuir isotherm are shown in Figure 2.
3.6. Data Fit to Freundlich Isotherm at Various pH
Linear forms of Freundlich isotherms were plotted for all the pH values and for the two samples of GAC .
 (3)
(3)
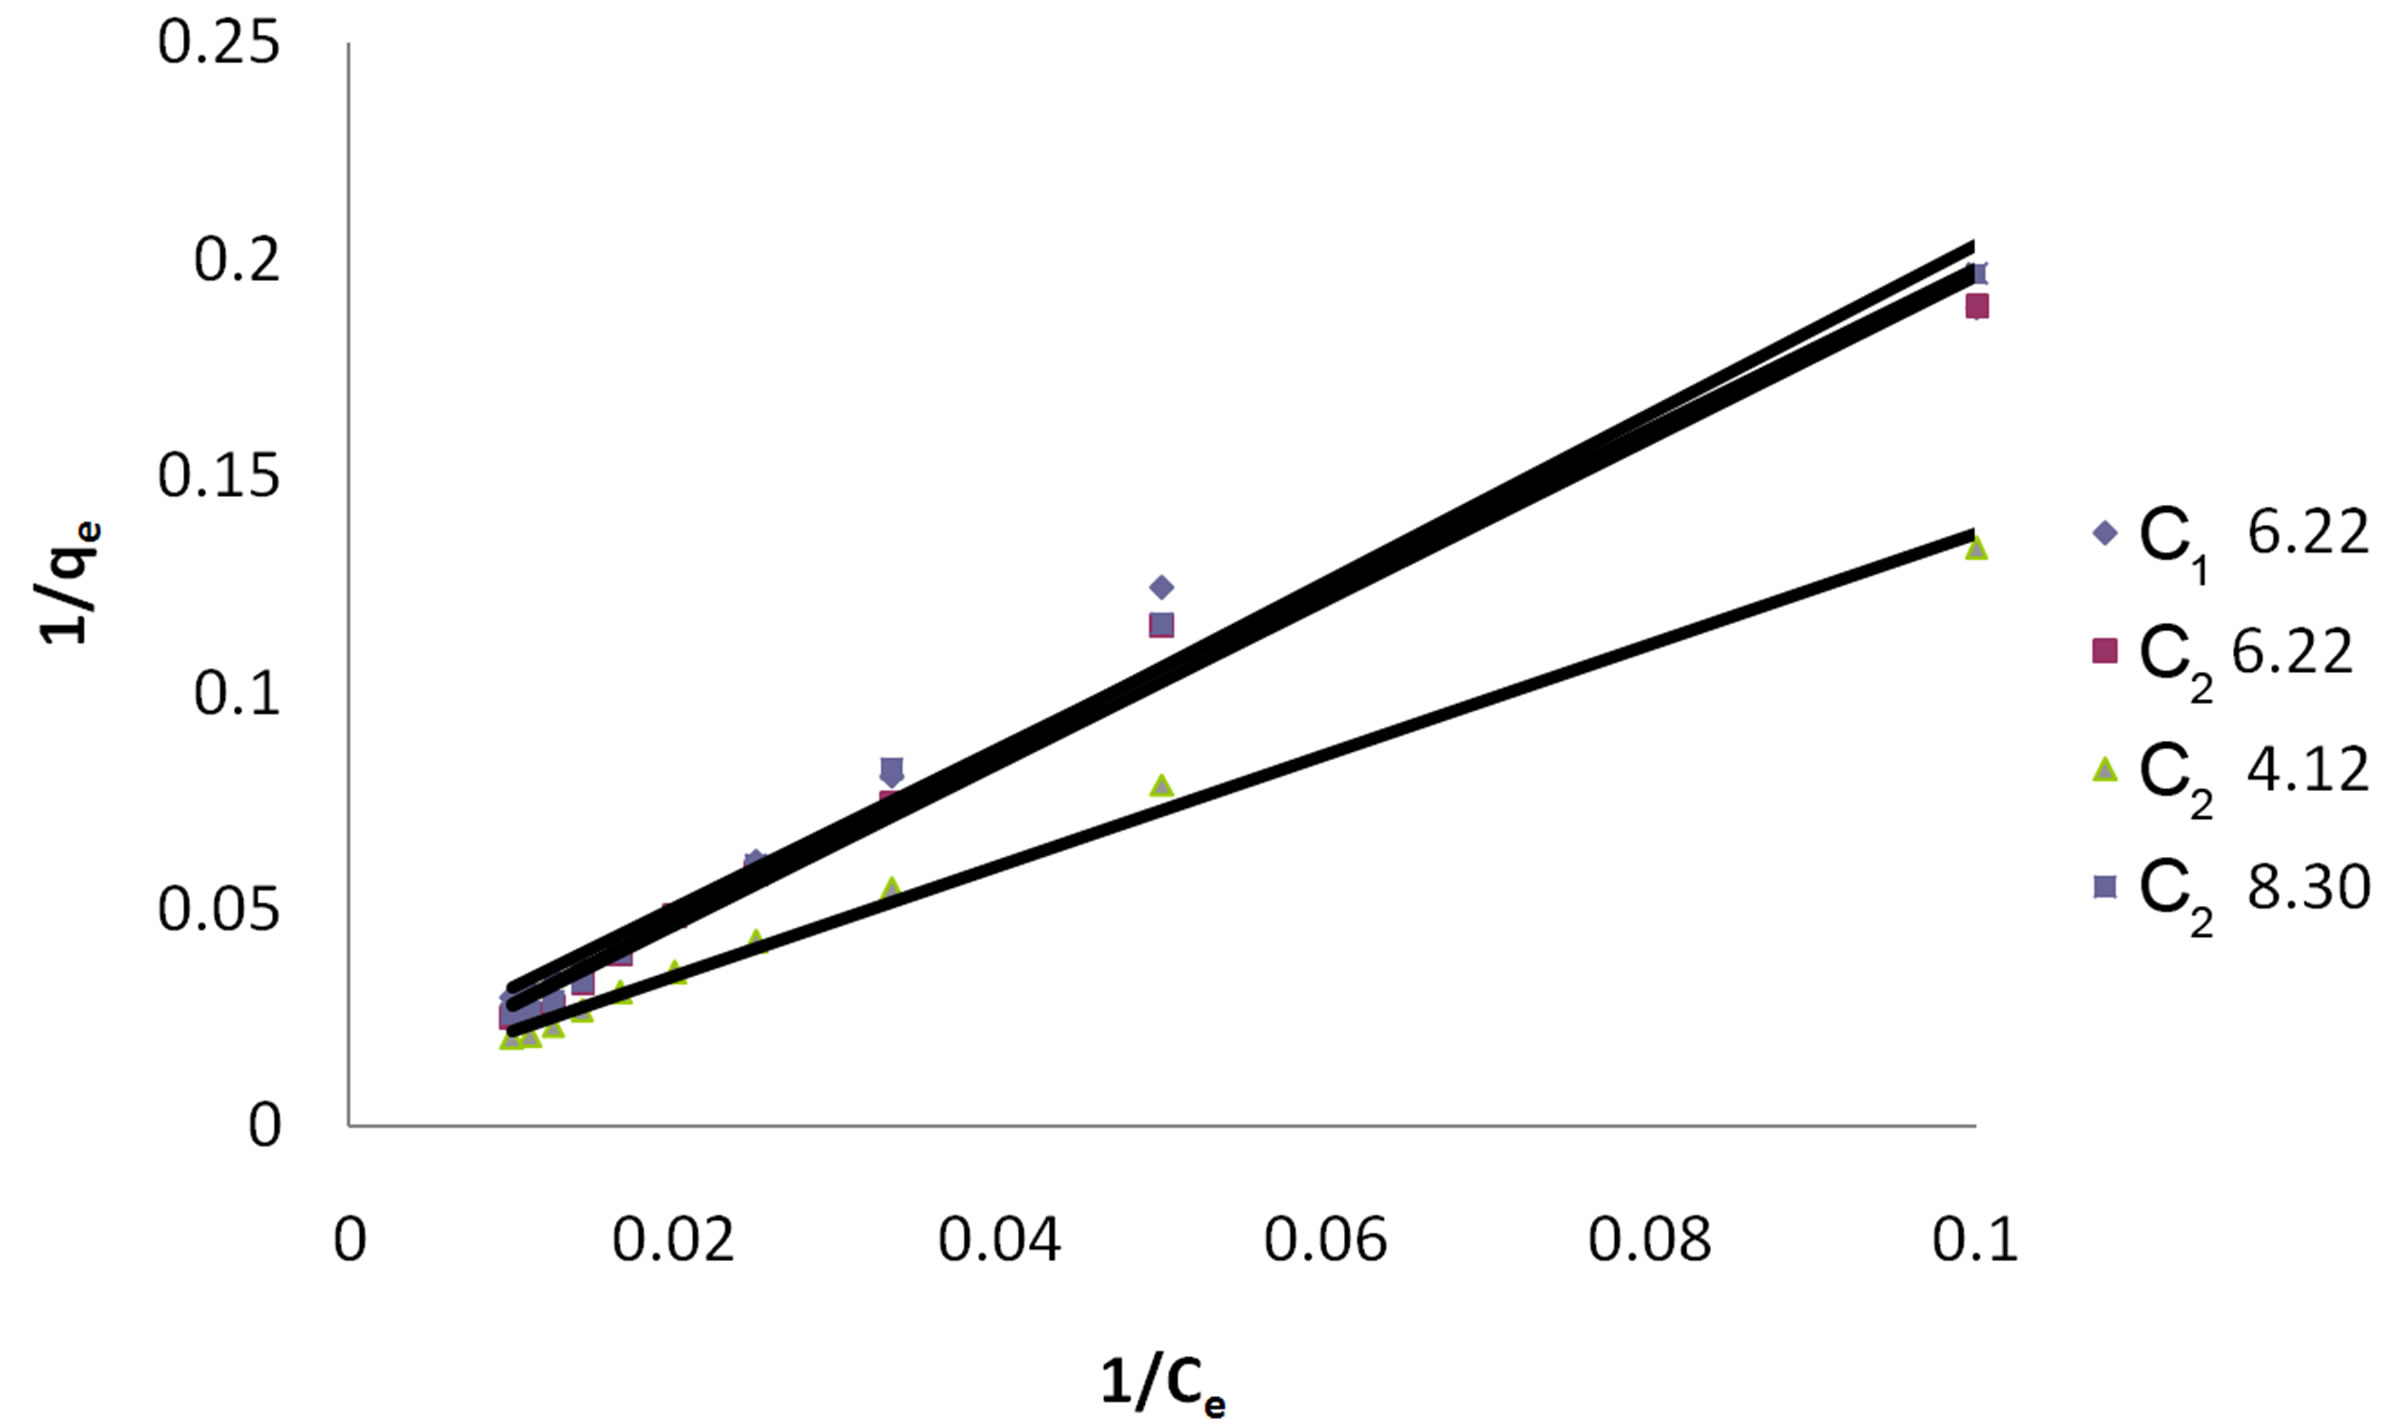
Figure 2. Langmuir Isotherm for dye Eosin on C1 & C2 at different pH values.
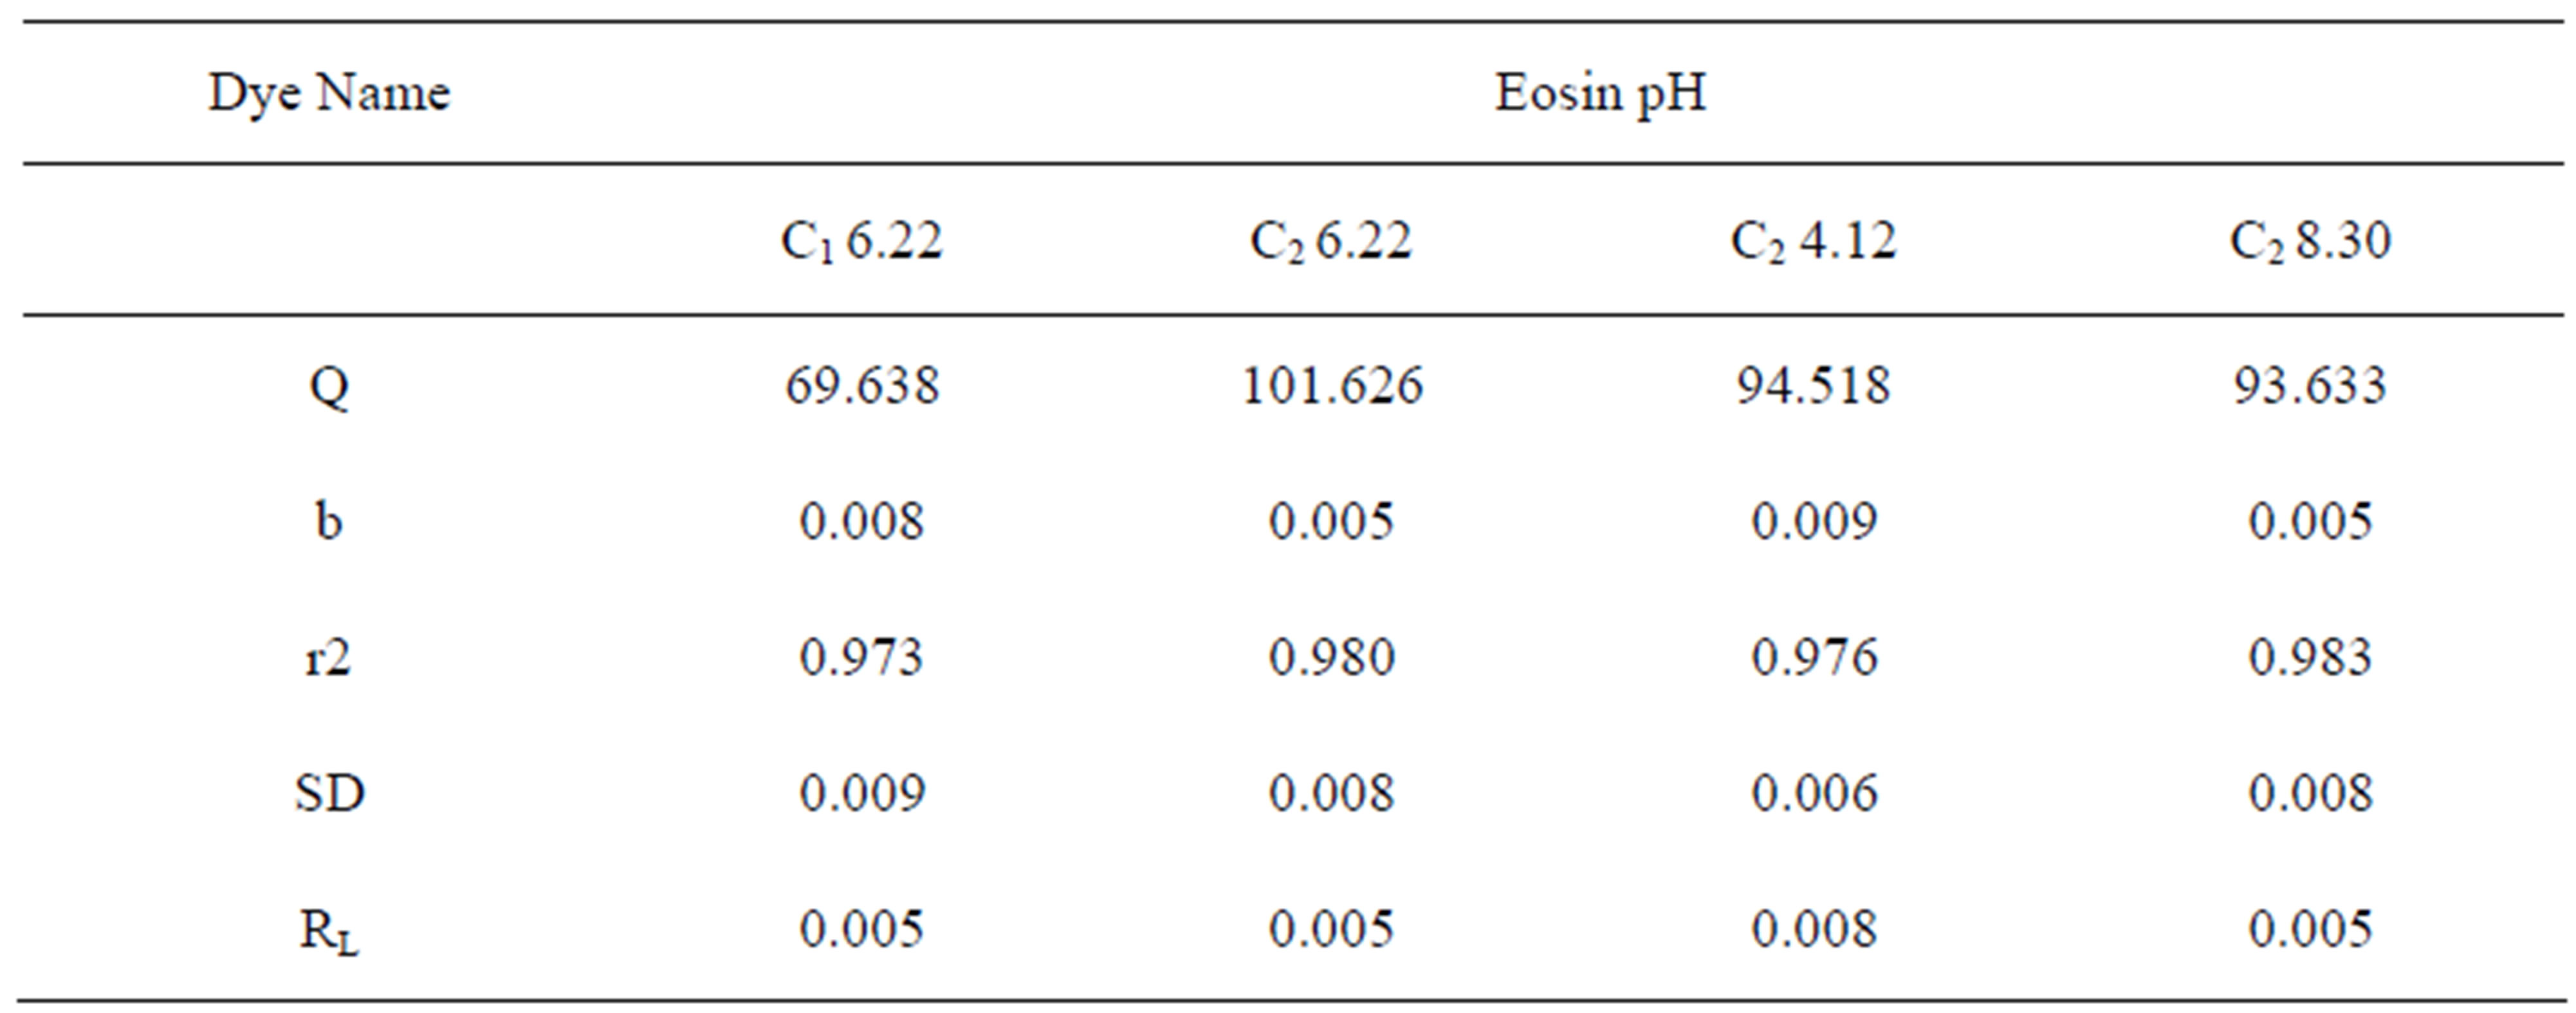
Table 3. Constants for Langmuir Isotherm at various pH values.
Freundlich constants KF and n calculated from the slope and intercept of log qe and log Ce along with R2 and SD as given in Table 4. KF (parameter relative to adsorption capacity) and n (process intensity) were calculated. Values of constant KF indicate higher adsorption capacity on Carbon sample C2 at acidic pH.
The linear plots of log qe and log Ce for Freundlich isotherm are shown in Figure 3.
4. Adsorption Mechanism
At acidic pH the adsorbent tends to form an aqua complex to yield a positively charged surface. The ionic dye releases colored dye anions/cations in solution, which in turn is influenced by the solution pH agents [11]. At acidic PH there is an increase in H+ ions in dye solution. The OH– ions on the adsorbent surface tend to be neutralized by protonation which facilitates the diffusion of dye molecules in the vicinity of the adsorbent. The positively charged surface sites on the adsorbent and the solution thus play a significant role in influencing the capacity of the adsorbent towards dye ions due to electrostatic attraction. Having an excess positive charge on their surface activated carbon shows a greater capacity to adsorb the dye when the solution is made acidic. As the pH of the system decreases number of negatively charged surface sites increases. Lower adsorption at alkaline pH may thus have been due to the presence of OH– ions competing with the dye ions for adsorption sites.
5. Conclusions
Both samples of activated carbon proved to be reasonably good adsorbents for removing the residual dye Eosin from waste water. From the results it may be observed that the percentage of adsorption of dye on both samples of GAC increased with the increase in initial concentration from 10 to 100 mg/L. It was also seen that adsorption was high at Acidic pH as compared to adsorption in Alkaline the values of SD and r2 indicate that both adsorption models fitted satisfactorily and suggested monolayer adsorption coverage on the outer surface of the adsorbent. Adsorption followed both Langmuir and Freundlich isotherms but as observed from the values of r2 Langmuir isotherm gave a better fit. On the whole both carbon samples showed favorable adsorption. Acidic pH environment was found to be more conducive to the adsorption process.
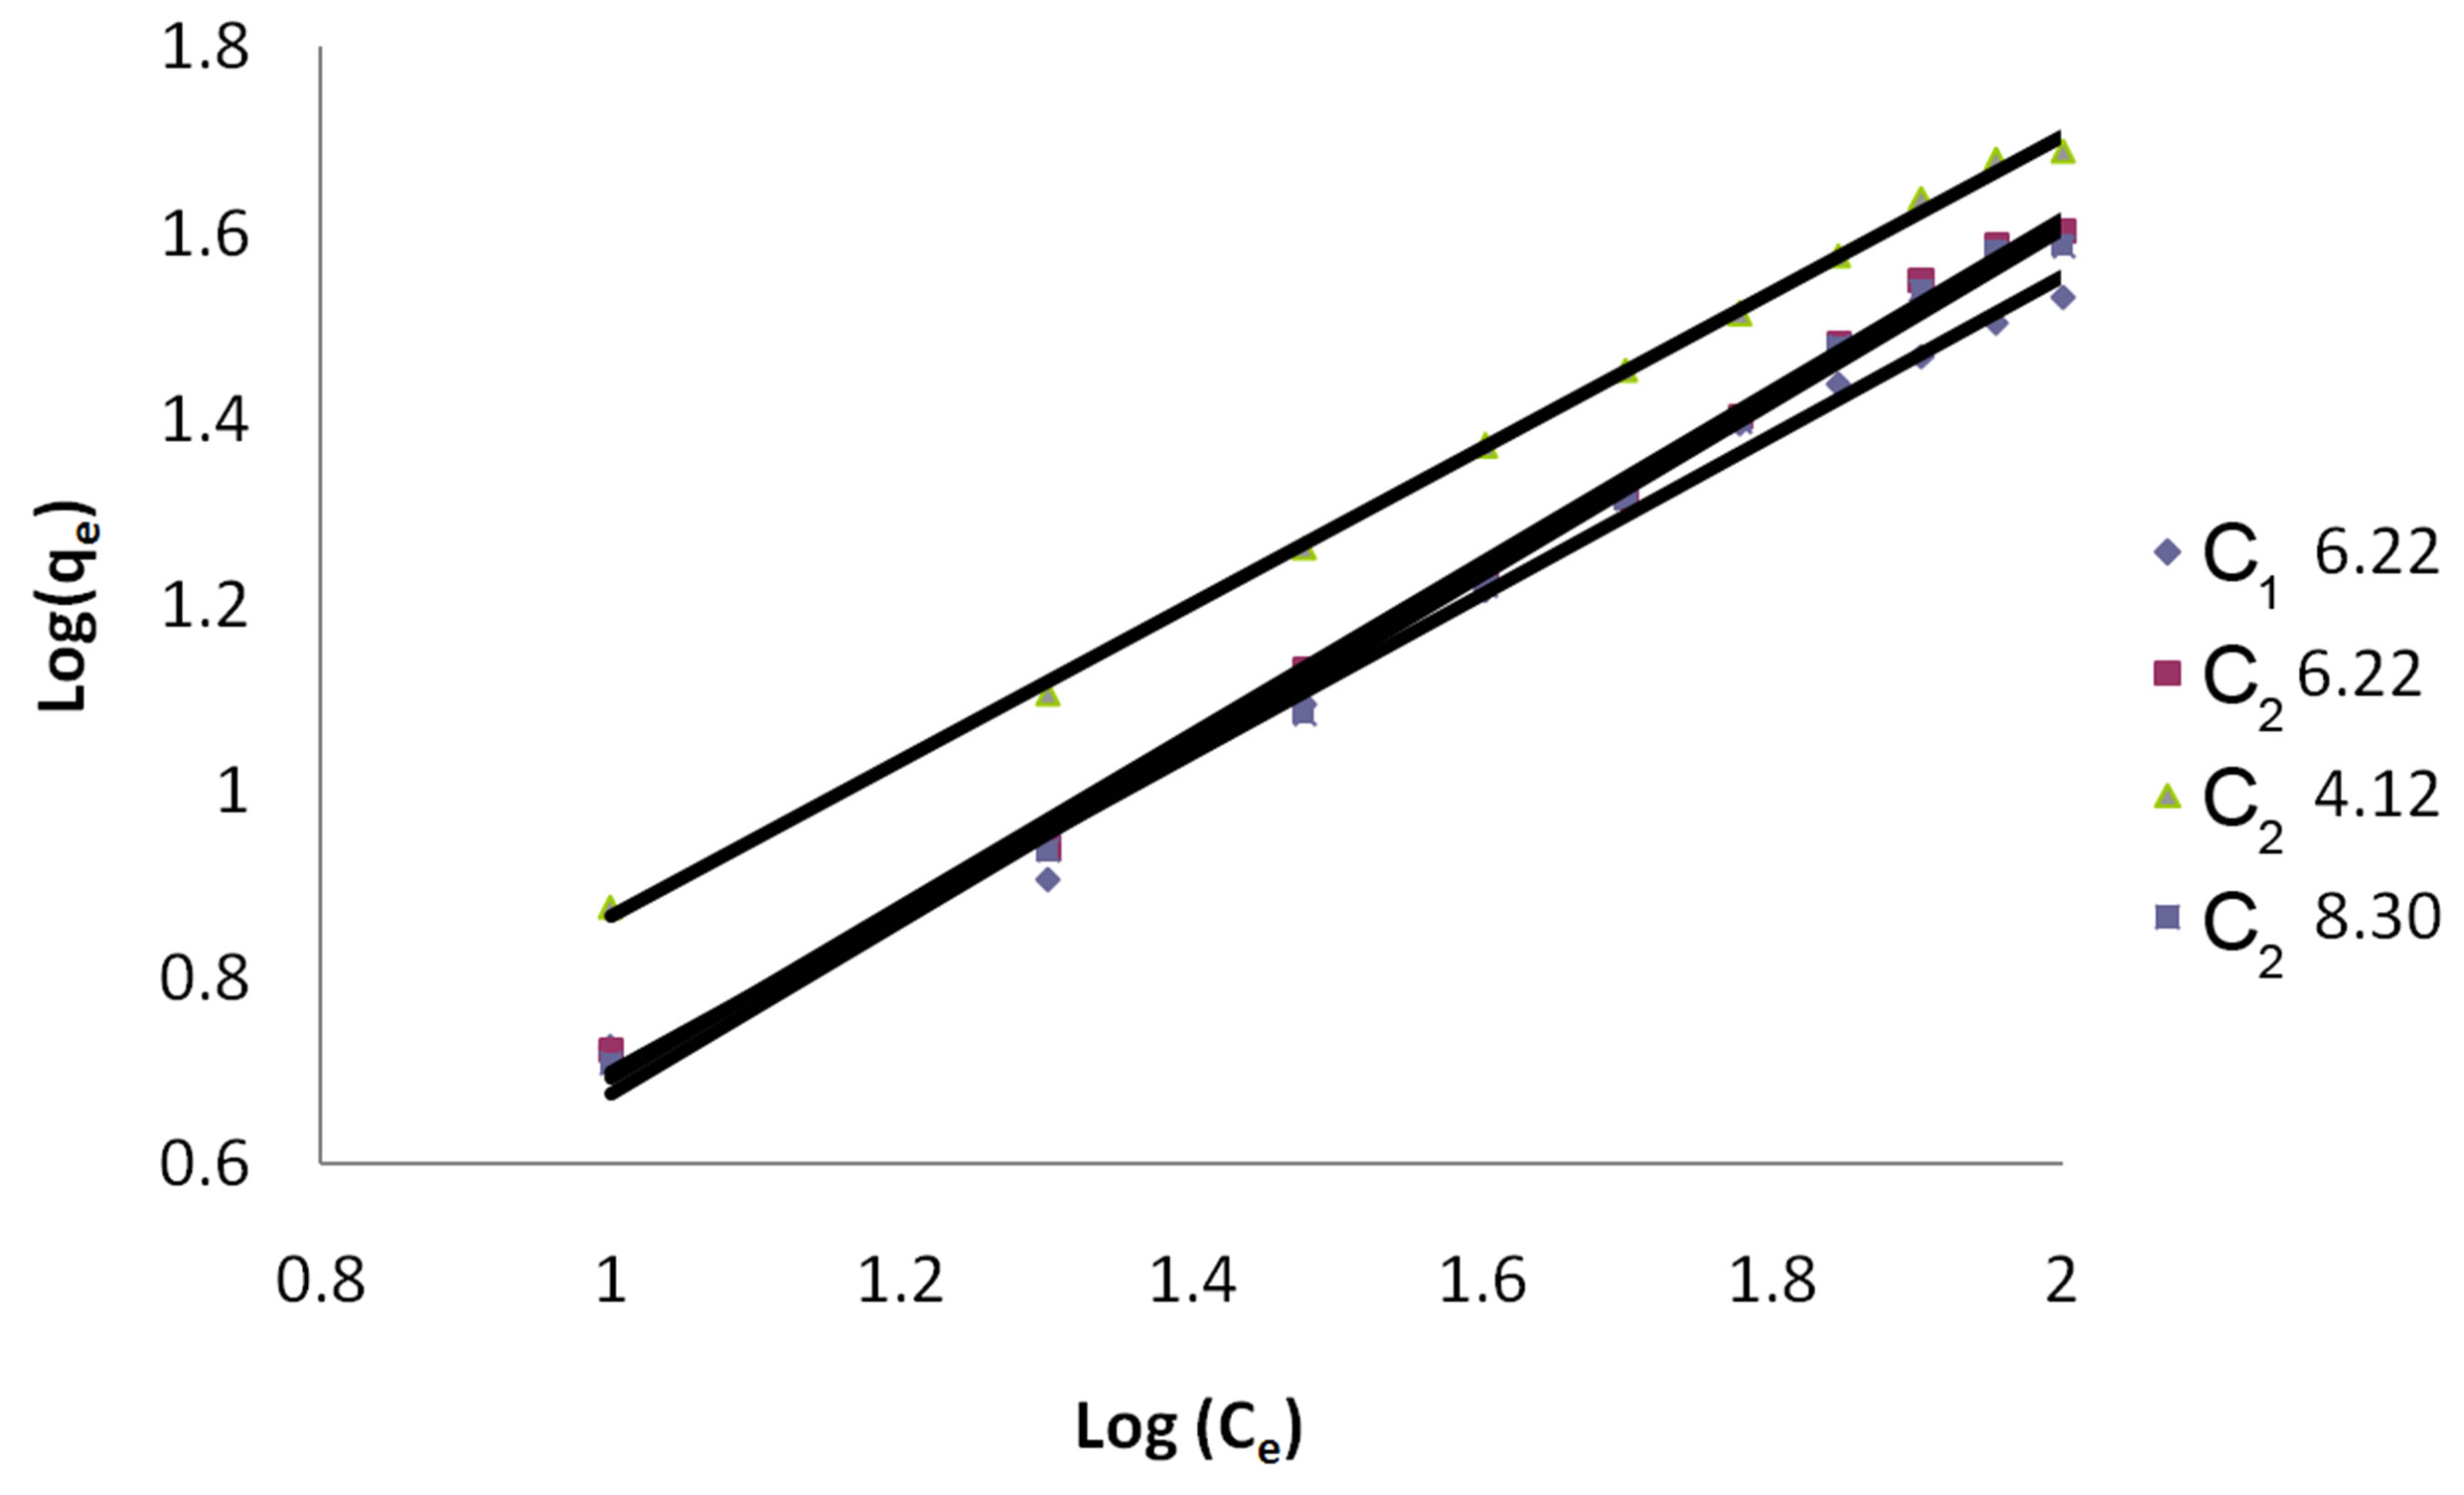
Figure 3. Freundlich Isotherm for dye Eosin on C1 & C2 at different pH values.
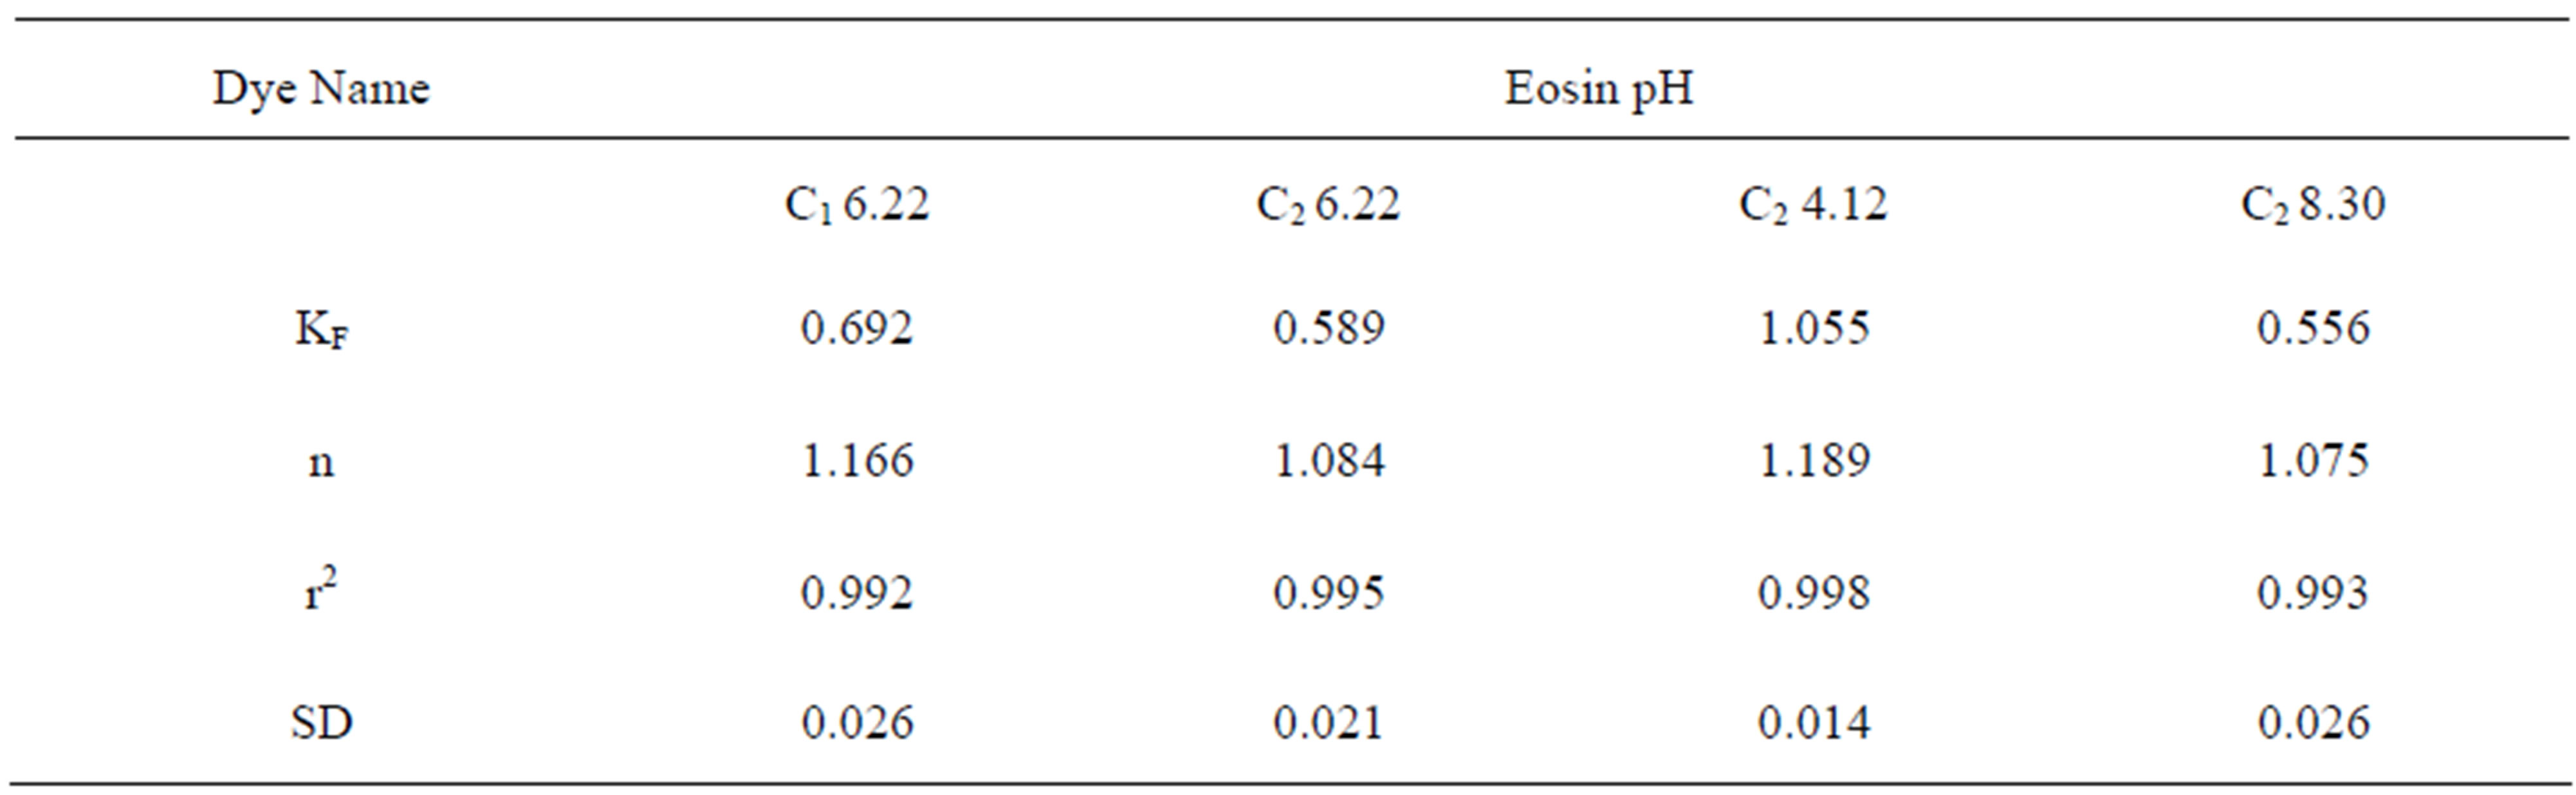
Table 4. Constants for Freundlich Isotherm at various pH values.
This study can be the basis of the amount and brand of carbon to be used and time of contact with carbon to be given for this technological process. When the breakthrough point has been reached and the adsorption efficiency of the carbon has decreased the spent carbon can be replaced or reactivated for reuse. Being inexpensive and easily available granular activated carbon can be used effectively in a commercial system.
REFERENCES
- S. S. Reddy, et al., “Removal of Composite Reactive Dye from Dyeing Unit Effluent Using Sewage Sludge Derived Activated Carbon,” Turkish Journal of Engineering and Environmental Sciences, Vol. 30, 2006, pp. 367-373.
- Kadirvelu, et al., “Utilization of Various Agricultural Wastes for Activated Carbon Preparation and Application for the Removal of Dyes and Metal Ions from Aqueous Solutions,” Department of Environmental Science, PSG College of Arts and Science Coimbatore, Tamil Nadu, Bioresource Technology, Vol. 87, No. 1, 2003, pp. 129- 132. doi:10.1016/S0960-8524(02)00201-8
- Y. Yasin, M. Z. Hussein and F. Hj Ahmad, “Adsorption of Methylene Blue onto Treated Activated Carbon,” The Malaysian Journal of Analytical Sciences, Vol. 11, No. 11, 2007, pp. 400-406
- Y. Li, Q.-Y. Yue, B.-Y. Gao, J. Yang and Y. Zheng, “Adsorption Kinetics of Reactive Dyes on Activated Carbon Fiber,” Chinese Journal of Environmental Science, Vol. 28, No. 11, 2007, pp. 2637-2641.
- S. Izadyar and M. Rahimi, “Use of Beech Wood Sawdust for Adsorption of Textile Dyes,” Pakistan Journal of Biological Sciences, Vol. 10, No. 2, 2007, pp. 287-293. doi:10.3923/pjbs.2007.287.293
- M. Husseien, A. A. Amer, A. El-Maghraby and N. A. Tahaused, “Utilization of Barley Straw as a Source of Activated Carbon for Removal of Methylene Blue from Aqueous Solution,” Journal of Applied Sciences Research, Vol. 3, No. 11, 2007, pp. 1352-1358.
- S. Reddy and B. Kotaiah, “Comparative Evaluation of Commercial and Sewage Sludge Based Activated Carbon for Removal of Textile Dyes from Aqueous Solutions,” Iranian Journal of Environmental Health Science & Engineering, Vol. 3, No. 4, 2006, pp. 239-246
- N. Kannan and S. Murugavel, “Column Studies on the Removal of Dyes Rhodamine-B, Congo Red and Acid Violet by Adsorption on Various Adsorbents,” EJEAFChe, Vol. 6, No. 3, 2007, pp. 1860-1868.
- R. Kant and V. K. Rattan, “Adsorption of Dye Green B from a Textile Industry Effluent Using Two Different Samples of Activated Carbon by Static Batch Method and Continuous Process,” Indian Journal of Chemical Technology, Vol. 16, 2009, pp. 240-244.
- Z. Aksu and S. Tezer, “Equilibrium and Kinetics Medeling of Biosorption of Remozol Black B by Rhizopodus Arrhizus in a Batch System: Effect of Temperature,” Process Biochemistry, Vol. 36, No. 5, 2000, pp. 432-439. doi:10.1016/S0032-9592(00)00233-8
- K. R. Ramakrishna and T. Viraraghawan, “Dye Removal Using Low Cost Adsorbents,” Water Science and Technology, Vol. 36, No. 2-3, 1997, pp. 189-196. doi:10.1016/S0273-1223(97)00387-9