Journal of Water Resource and Protection
Vol.4 No.1(2012), Article ID:16736,7 pages DOI:10.4236/jwarp.2012.41005
An Assessment of Biological Pollution in Certain Sector of Lower AL-Zab and River Tigris Waters Using Bacterial Indicators and Related Factors in Iraq
1Department of Microbiology, College of Medicine, University of Tikrit, Tikrit, Iraq
2College of Education, University of Tikrit, Tikrit, Iraq
Email: profaljebouri@yahoo.com
Received October 25, 2011; revised November 27, 2011; accepted December 28, 2011
Keywords: Bacterial Indicators; Pollution; River Tigris; River Al-Zab; Iraq
ABSTRACT
This study was conducted during 2004 utilizing selected sectors of River Tigris and the Lower Al-Zab River among Kirkuk and Salahaldeen Governerates of Iraq. Water samples from eight stations were analyzed for total coliforms, fecal coliforms, total viable counts of bacteria, Oxygen biological demand (BOD), water turbidity, electrical conductivity and temperature. The mean total viable counts (TVC,s) of bacteria isolated was almost 800 cells/ml. The means of total coliforms (TC) and faecal coliforms (FC) were almost 708 and 436 per 100 ml of water samples tested respectively.The oxygen biological demand was more than 8 mg/l. The mean of water tubidity was more than 35 ntu. The assessment of water electrical conductivity revealed almost 354 us/cm. The present study revealed a wide variation in the water quality due to different pollution pressures affected the different sites of River Tigris and Al-Zab River waters. These water sources are used for drinking and other human activities. The Lower Al-Zab River was less affected by the mentioned factors compared to River Tigris The analysis of variance showed a significant difference between BOD values recorded at different months and the P value was less than 0.5. The overall mean of BOD was 2.4 mg/l which is suitable for human consumption after drinking water purification process with reference to European characterizations 74/ 464/EEC of waters used as sources for drinking waters.
1. Introduction
Fresh water bodies particularly rivers always considered as a main source of drinking and relevant human uses for maintenance of life. These natural water bodies usually under stress of environmental pollution including chemical, physical and biological aspects that might turn the nature of these waters to be risky for human beings uses [1-5]. Environmental stress as well as human population growth associated with an increased industrial and civilian activities can all cause a damage for the natural water quality that might be necessary for human needs which lead to continuous environmental survey and assessment to reveal the degree of pollution impact particularly on raw water sources like rivers, lakes, springs and deep wells waters i.e. ground waters [6]. Raw water quality can be assessed using various parameters particularly the bacterial indicators of biological pollution [7]. Chemical and physical factors affecting water quality have been utilized for evaluation of degree of pollution and these included oxygen biological demand, turbidity, electrical conductivity, temperature, and pH of waters under investigations [8-10].
In addition to known environmental pollution and impact on the human habitat, Iraq passed through a series of recent wars which made the local environmental situation is more unique that needs more and more exploration for reevaluation of the degree of different aspects of pollution including the biological aspect. The present study aimed to investigate the bio-chemical parameters concerning pollution of River Tigris and Lower Al-Zab River of Iraq.
2. Materials and Methods
2.1. Description of the Area Studied
The collection site No.1 was located at the end of the River Al-Zab, Al-Hawija district, Kirkuk Governerate before the junction of Al-Zab with the River Tigris at the Maddallah fields. The other sites of water were located on River Tigris; site No.2 (Al-Shag area) and site No.3 (Al-Shjara area) were located on the River Tigris in Al-Hawija district, Kirkuk Governorate. The other five sites were located on River Tigris passing through the Salahaldeen Governorate from Al-Baiji to Samarra districts and they were; Al-Mazraa (S4), Tikrit University (S5), Tikrit Bridge (S6), Al-Oja (S7) and Abo-Dalaf (S8).
2.2. Collection of Water Samples
Sixty four water samples were collected from different sites using sterile bottles. The samples were transported to the laboratory in cooled container. The samples were collected from each site during January, February, March, April, June, July, August and September 2004.
2.3. Temperature of Water
Water temperature of each site was recorded using mercury thermometer at the time of sample collection [11].
2.4. Elecrical Conductivity
This parameter was estimated using conductivity meter CDM83 (Denmark) according to Turki [11] methods.
2.5. Turbidity
The water turbidity was estimated utilizing turbidity meter (HANNA Instruments,Burtogal) according to methods used by Al-Shwany [12].
2.6. Biological Oxygen Demand (BOD)
BOD was estimated according to APHA [13].
2.7. Bacteriological Study
All water samples were bacteriologically investigated for total viable counts (TVC, s), total coliforms (TC) and fecal coliforms (FC) using the conventional methods [1] and the most probable number techniques [14].
3. Results
3.1. Water Temperature
The present results showed that the lower water temperature was recorded at the station of Maddallah fields (S1) on Al-Zab River when it was 8˚C at December (Table 1). The highest water temperature was recorded at Al-Oja site (S7) during July which elevated to reach 25.2˚C.
3.2. Electrical Conductivity of Water
The present study showed that the electrical conductivity of waters under investigation were varied and ranged between 230 to 678 ms/cm (Table 2).
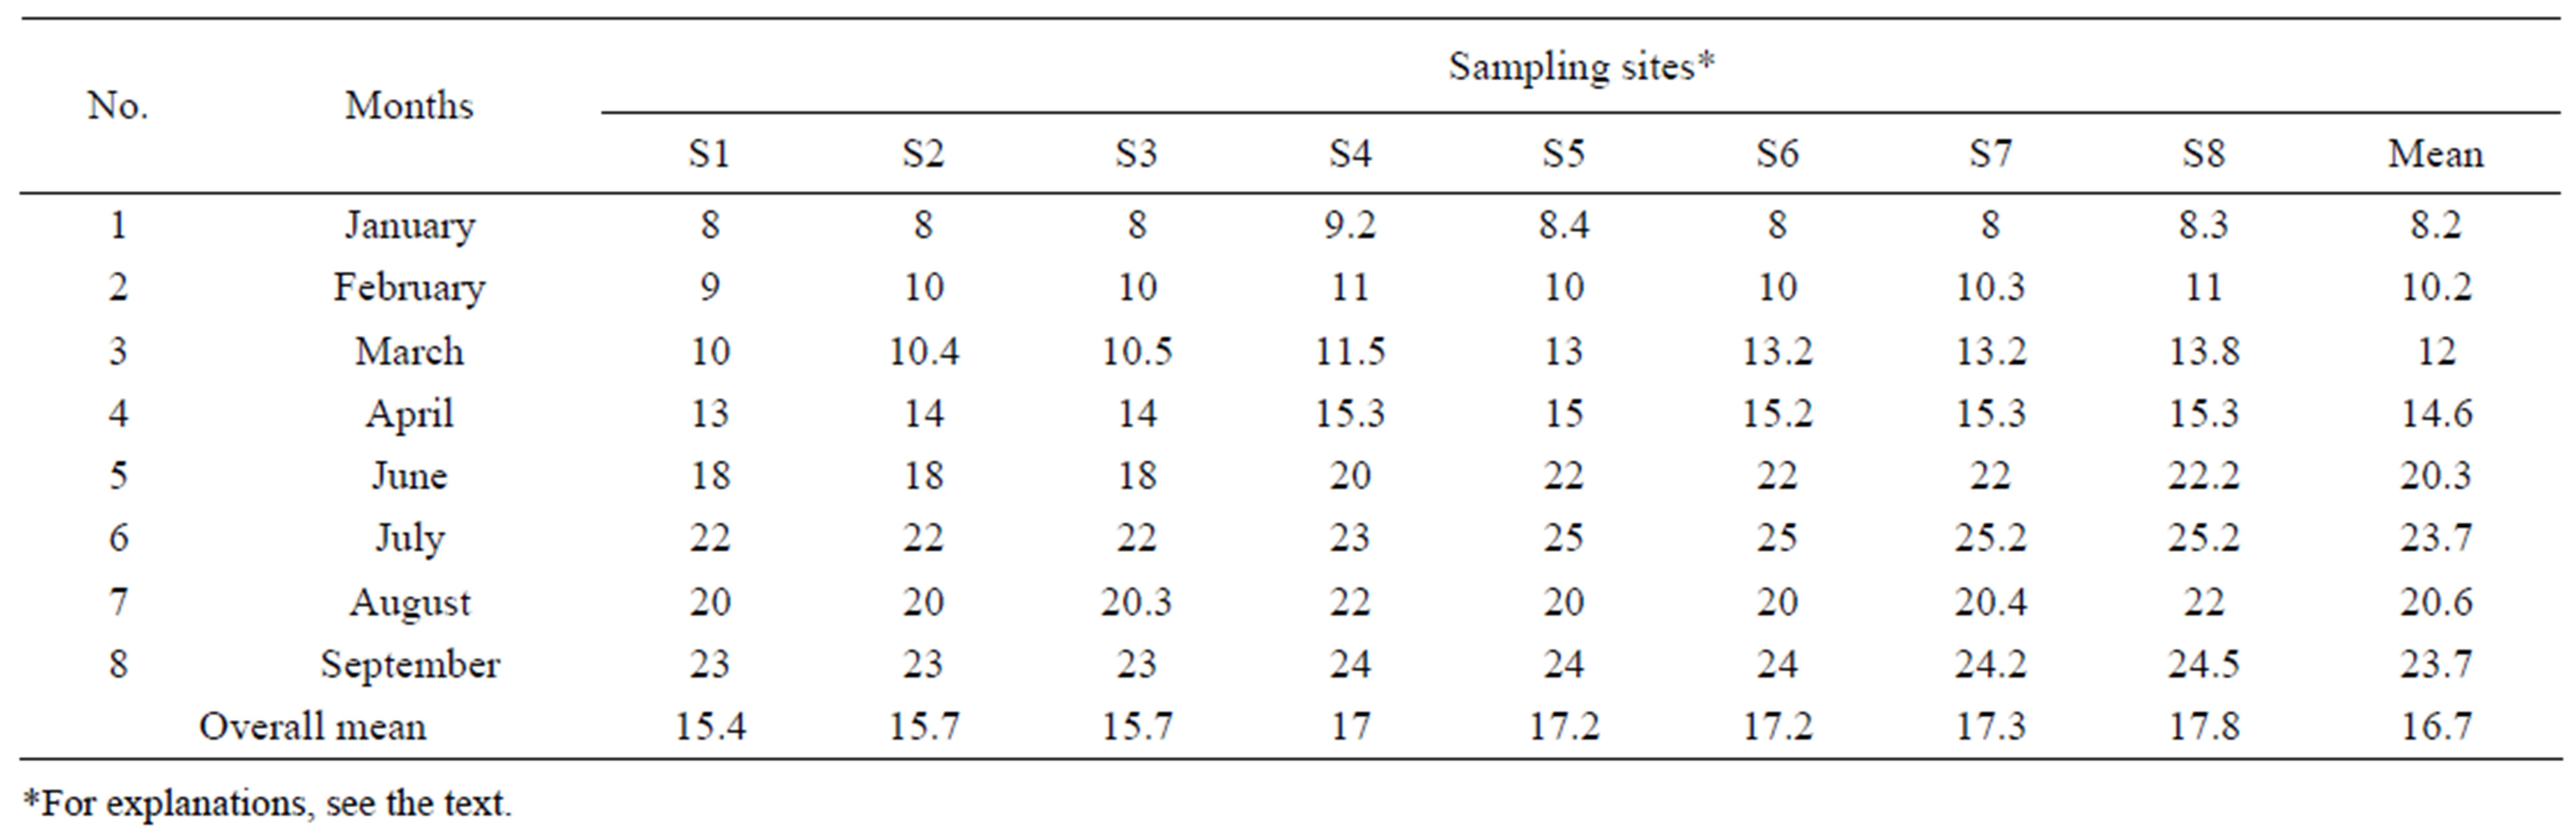
Table 1. Water temperature (˚C) at the sampling sites.
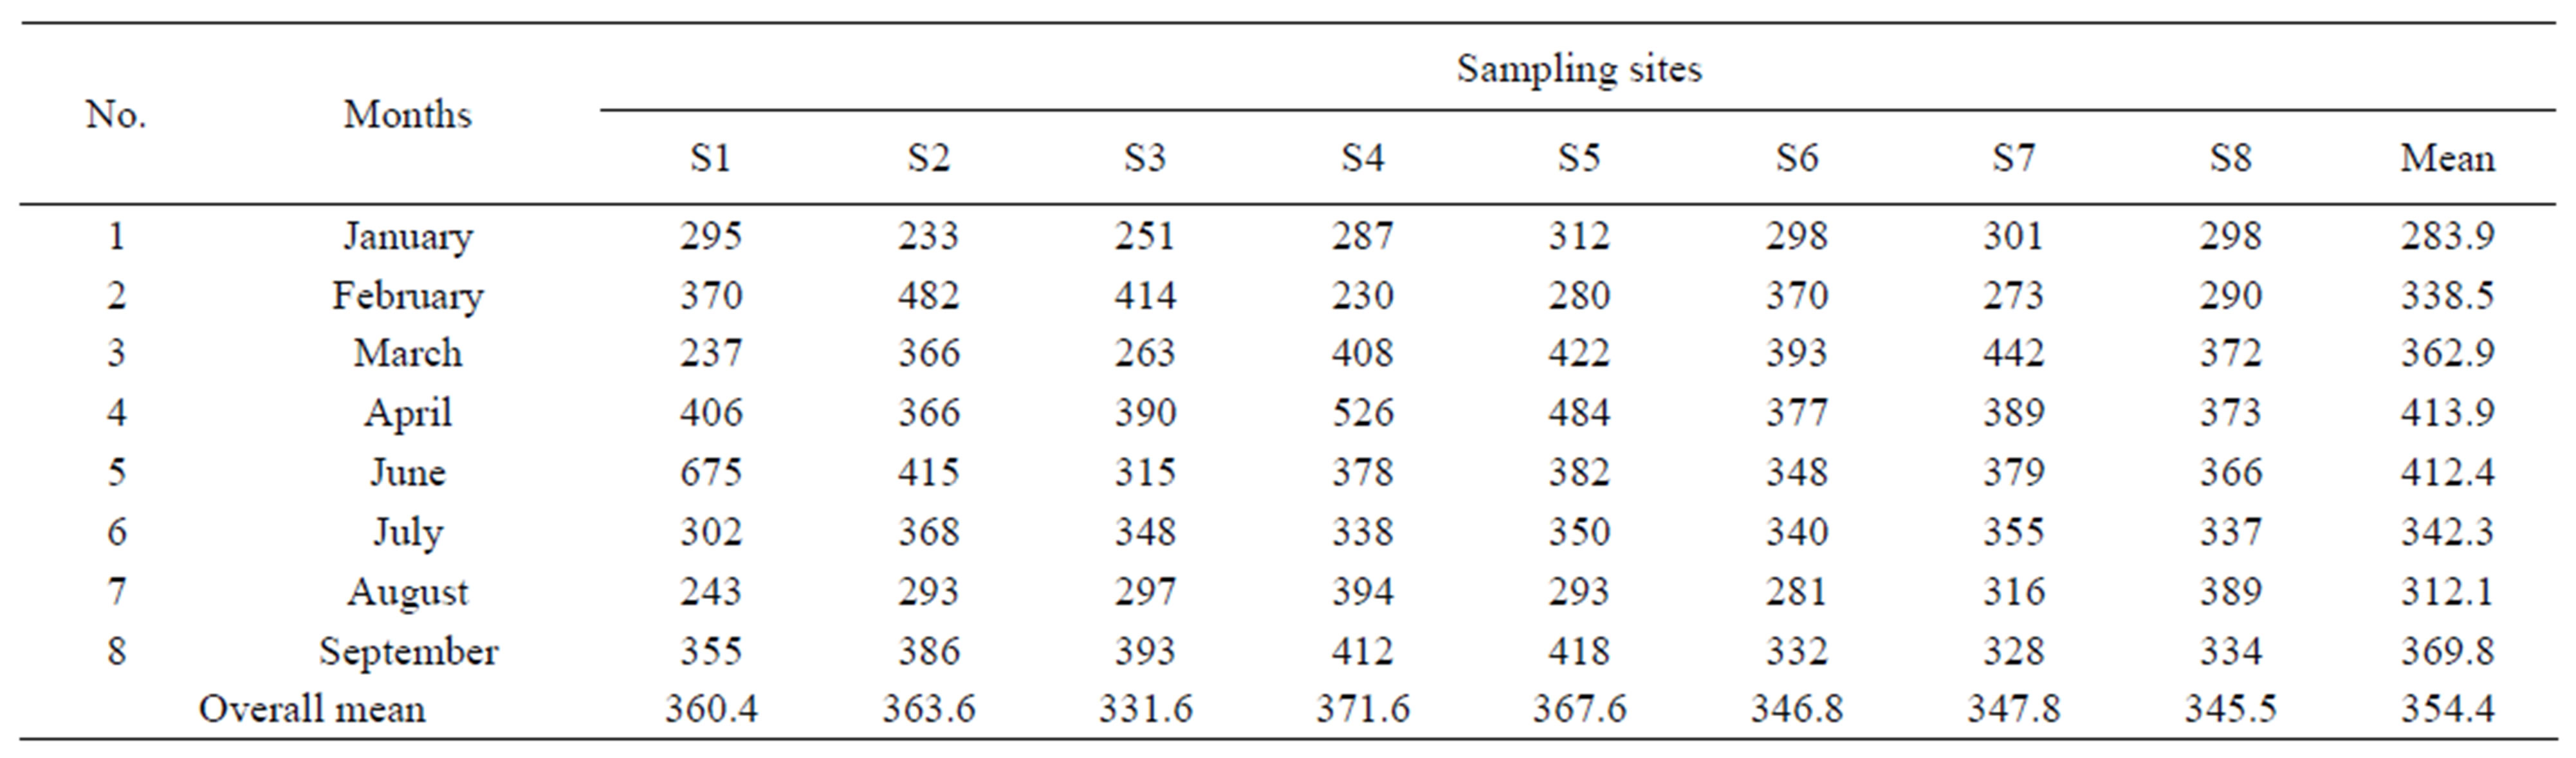
Table 2. Electrical conductivity of water samples tested.
The lowest value was recorded at Al-Mazraa site (S4) during January while the highest value was recorded at Maddallah site (S1) during June which was 675 ms/cm. The lowest conductivity of Al-Zab River water (Maddallah site; S1) was recorded during March. The lowest electrical conductivity of River Tigris water was seen at Al-Mazraa site (S4) at February, i.e. 230 ms/cm and the highest conductivity (526 ms/cm) was observed at the same site during April. The overall mean of the conductivity of both rivers waters was almost 354 ms/cm.
3.3. Turbidity of Water
The present study showed that the lowest turbidity value was 18.04 (81.03 NTU) but the highest value was recorded at Maddallah site (S1) of the River Al-Zab during April of the year (Table 3).
The present study generally also showed that turbity was higher during cold months compared to hot seasons. Turbidity was higher in Al-zab (46.3 NTU) compared to Tigris which was almost 40 NTU. The turbidity mean of both waters was more than 35 NTU.
3.4. Biological Oxygen Demand (BOD)
The biological oxygen demand of all water samples studied ranged between 0.7 to 4.4 mg/l (Table 4).
The lowest value of BOD was recorded at Al-Shag site (S2) during August (0.7 mg/l) and at University site (S5)
during July (0.7 mg/l) and both stations were located on River Tigris. The BOD value (4.4 mg/l) was seen in Abo-Dalaf site (S8) during February. The analysis of variance showed a significant difference between BOD values recorded at different months and the P value was less than 0.5.
3.5. Total Viable Counts (TVC,s)
It was shown that the lowest number of heterotrophic bacteria i.e. TVC was isolated from the sample collected from Tikrit Bridge site on River Tigris at February (Table 5) and the value was 11 × 10/ml. The highest viable counts of bacteria was isolated from the water of AboDalaf (S8) on River Tigris during February and the value was 324 × 10/ml. The highest value of recorded at Maddallah area(S1) during January when the bacterial number was 223 × 10/ml. The heterotrophs were higher in number in River Tigris compared to Al-Zab River waters (Table 5). Cold months showed higher numbers of bacteria isolated. Statistical analysis did not show significance and the P value was more than 0.5 3.6. Total coliforms (TC,s): The present study showed a lowest number of total coliforms to be estimated at University site (S5) particularly during January, February and March and the values were 95.80 and 35/100 ml respectively (Table 6). Total coliforms were very low in number at Maddallah site on River Al-Zab at February (130/100 ml) but this number was highly elevated at the same station during
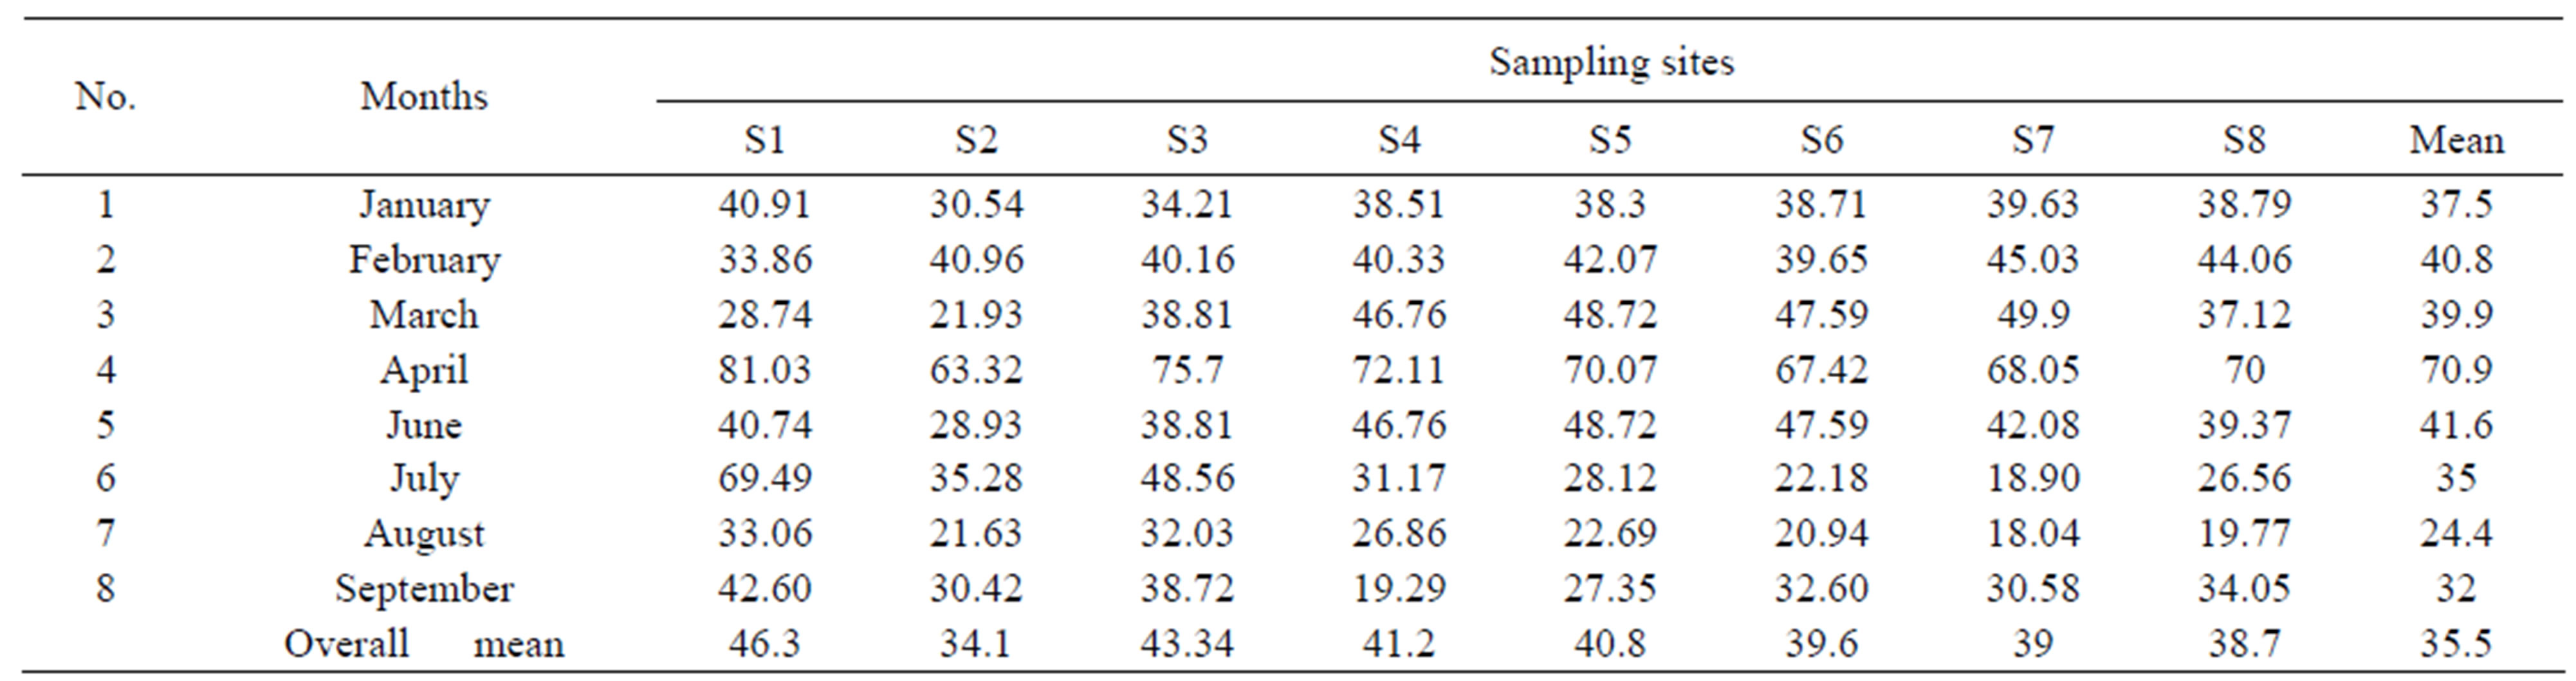
Table 3. Turbidity (NTU) of the water samples tested.
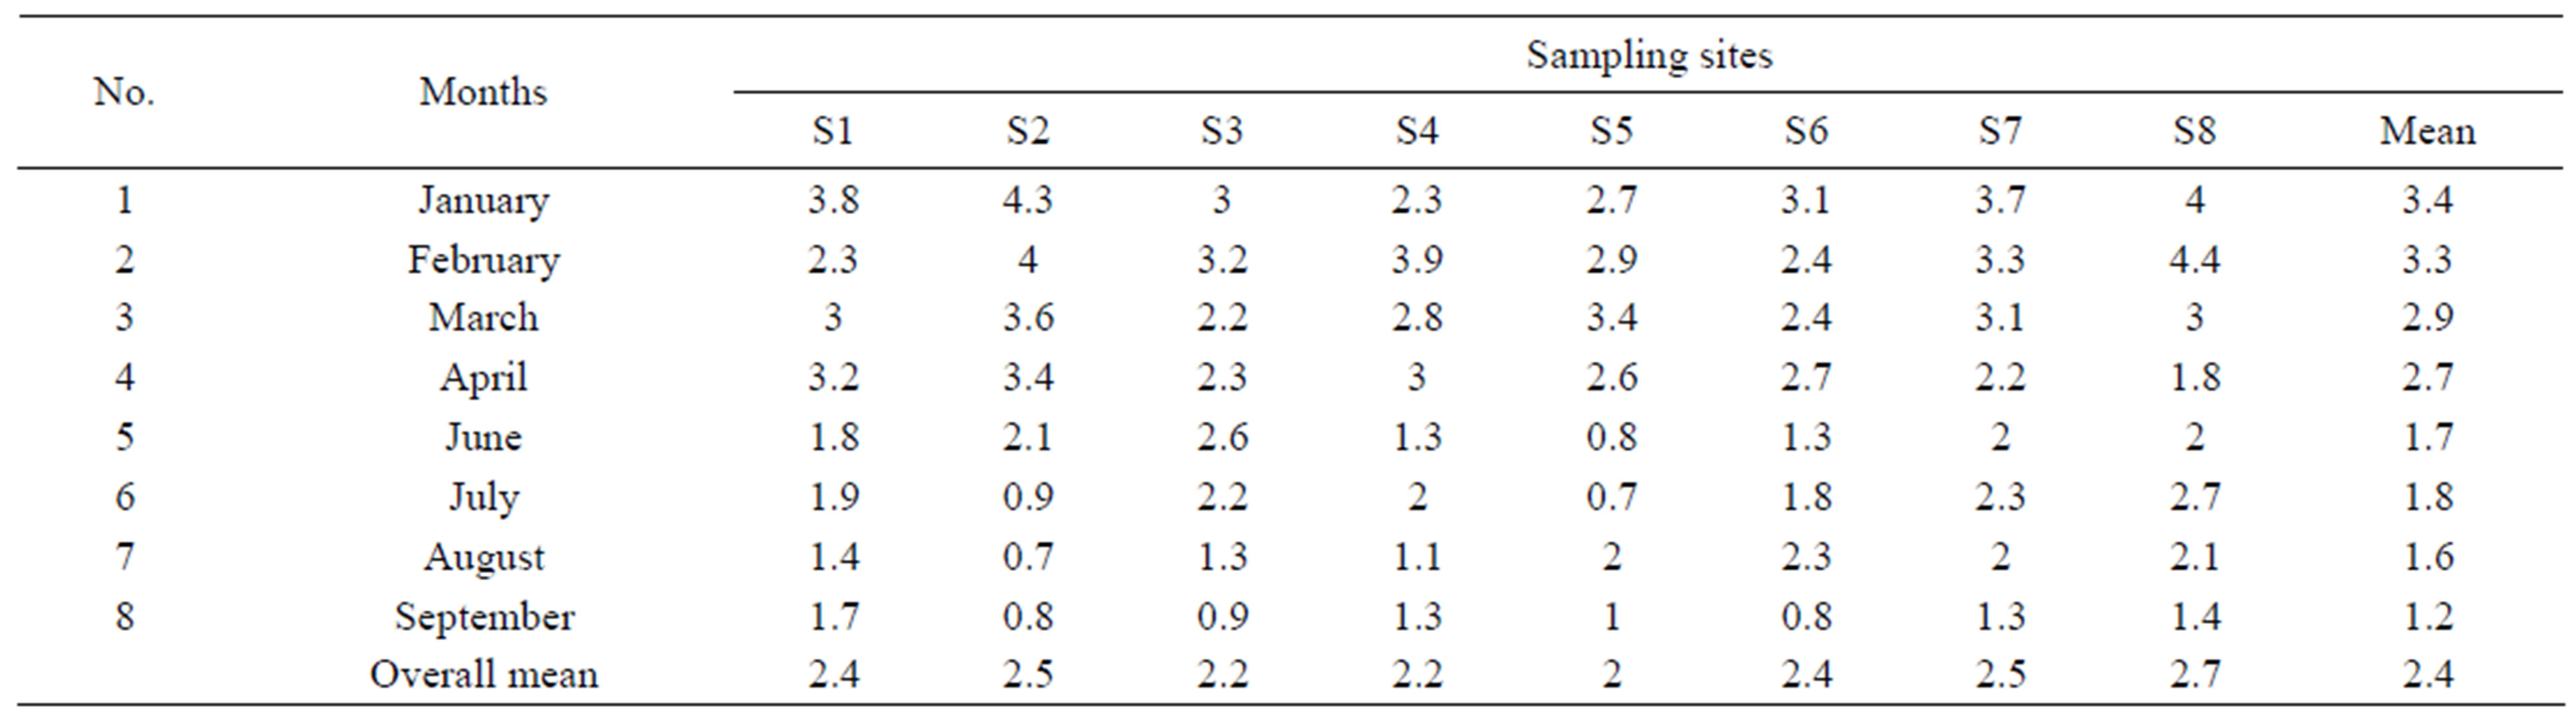
Table 4. Biological oxygen demand (BOD) mg/l at the water sample sites.
September (1600/100 ml). Total colifrms was generally higher in summer months in all water sites studied but the statistical analysis showed no significant differences and the P value was more than 0.5.
3.7. Fecal Coliforms (FC,s)
The most probable numbers (MPN,s) of fecal coliforms isolated at 44˚C were varied from site to site and from month to month (Table 7). The lowest number was recorded at Maddallah site (S1) on River Al-Zab in February which was 2/100 ml. Maddallah water site showed the highest number of fecal coliforms which was 1600/100 ml at April, June and July. Sites on River Tigris showed different degree of fecal coliforms presence, e.g. the MPN at Tikrit Bridge (S6) was 70 at January and 900 at August. The highest MPN in River Tigris sits was 1800 at Al-Mazraa and Abo-Dalaf sites (S4 and S8). Cold months showed higher fecal coliforms to be harversed. The statistical analysis of the data concerned showed a significant difference between sites of waters (P value was less than 0.5) but no significant difference was concluded according to months of collection (P values more than 0.5).
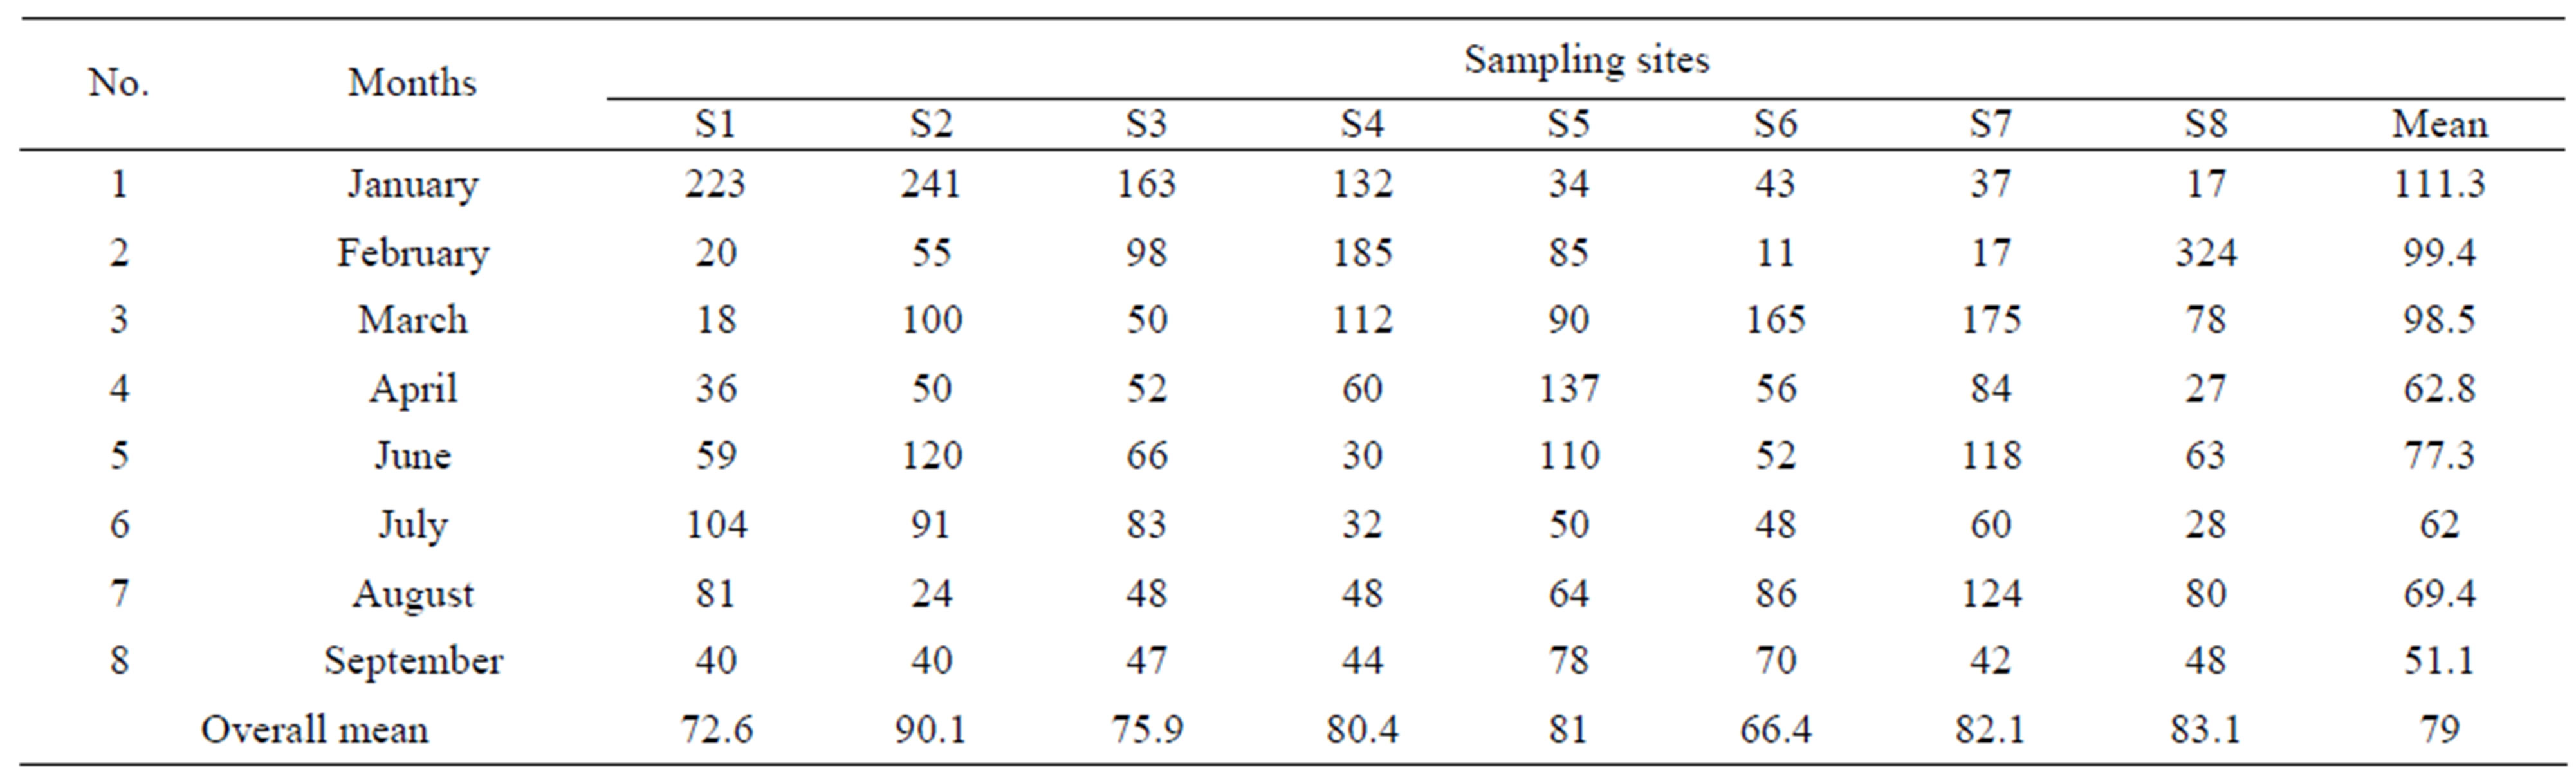
Table 5. Total viable counts (TVC,s × 10/ml)of bacteria isolated from water sample.
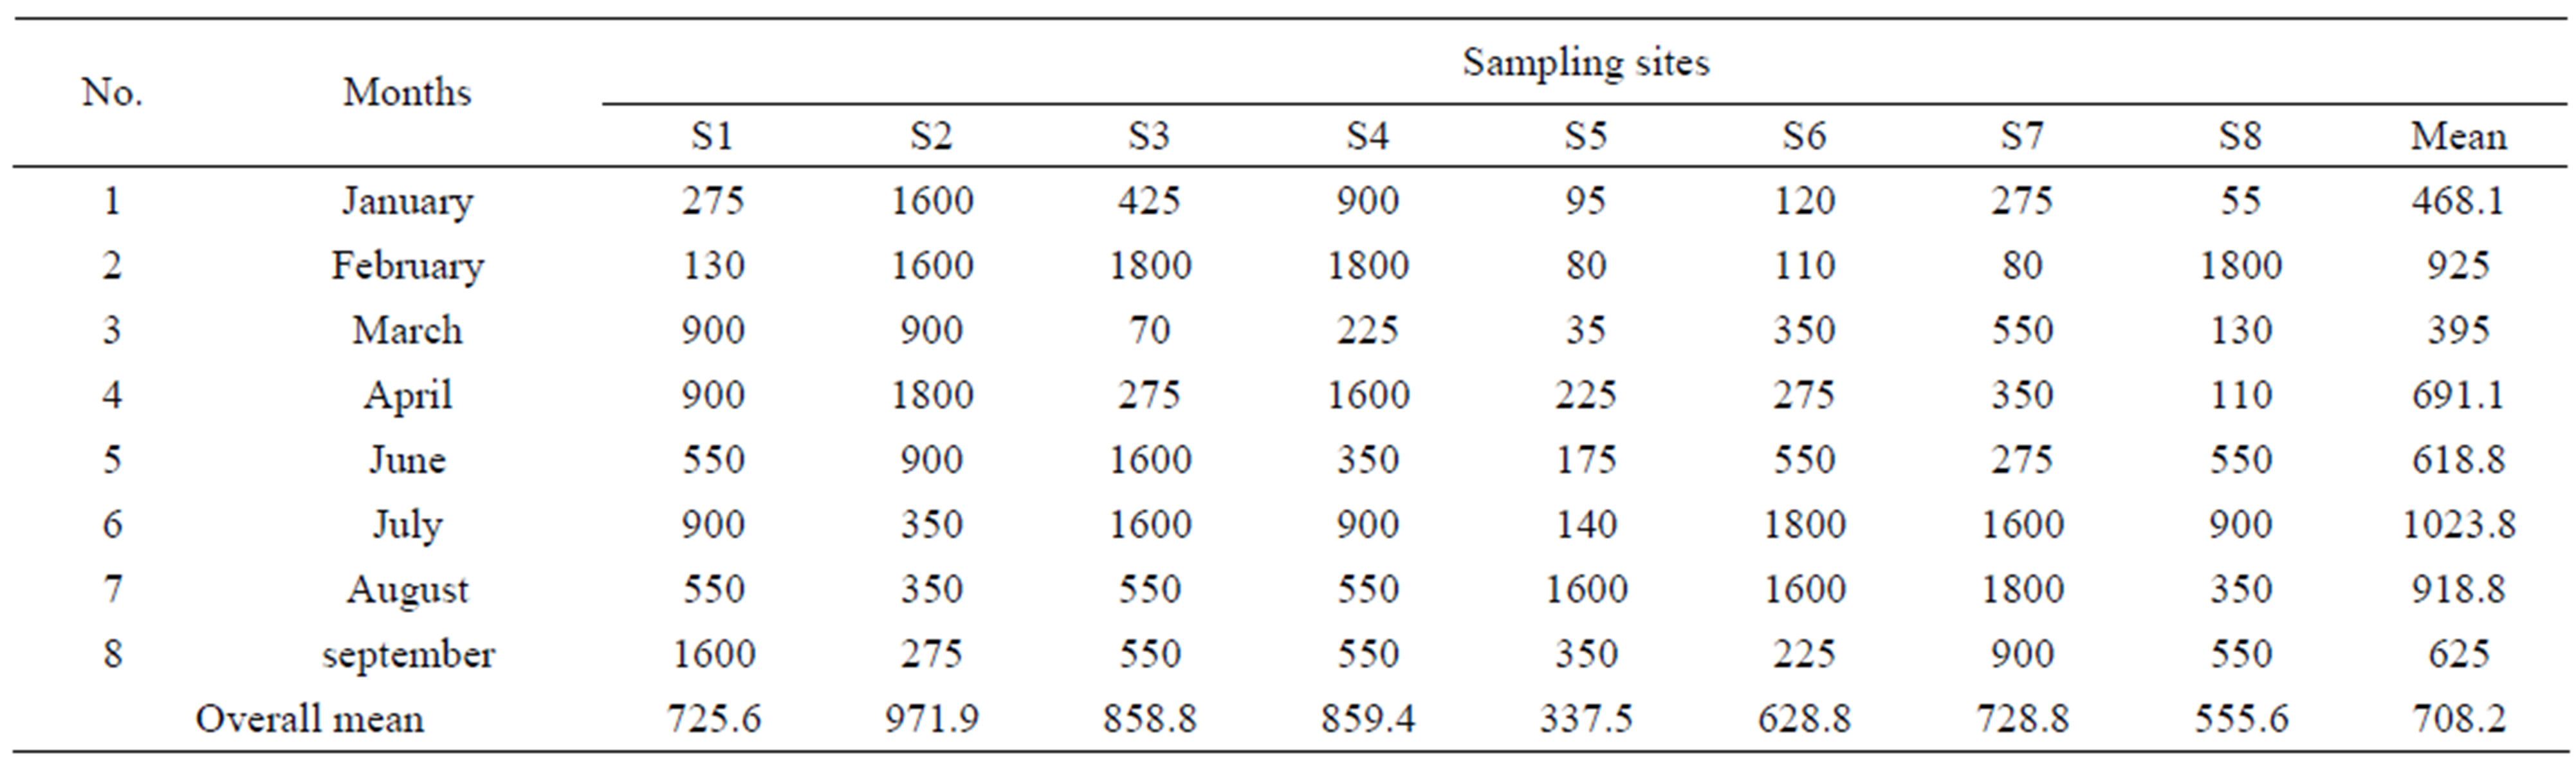
Table 6. The most probable numbers (MPN,s) of total coliforms isolated from water samples.
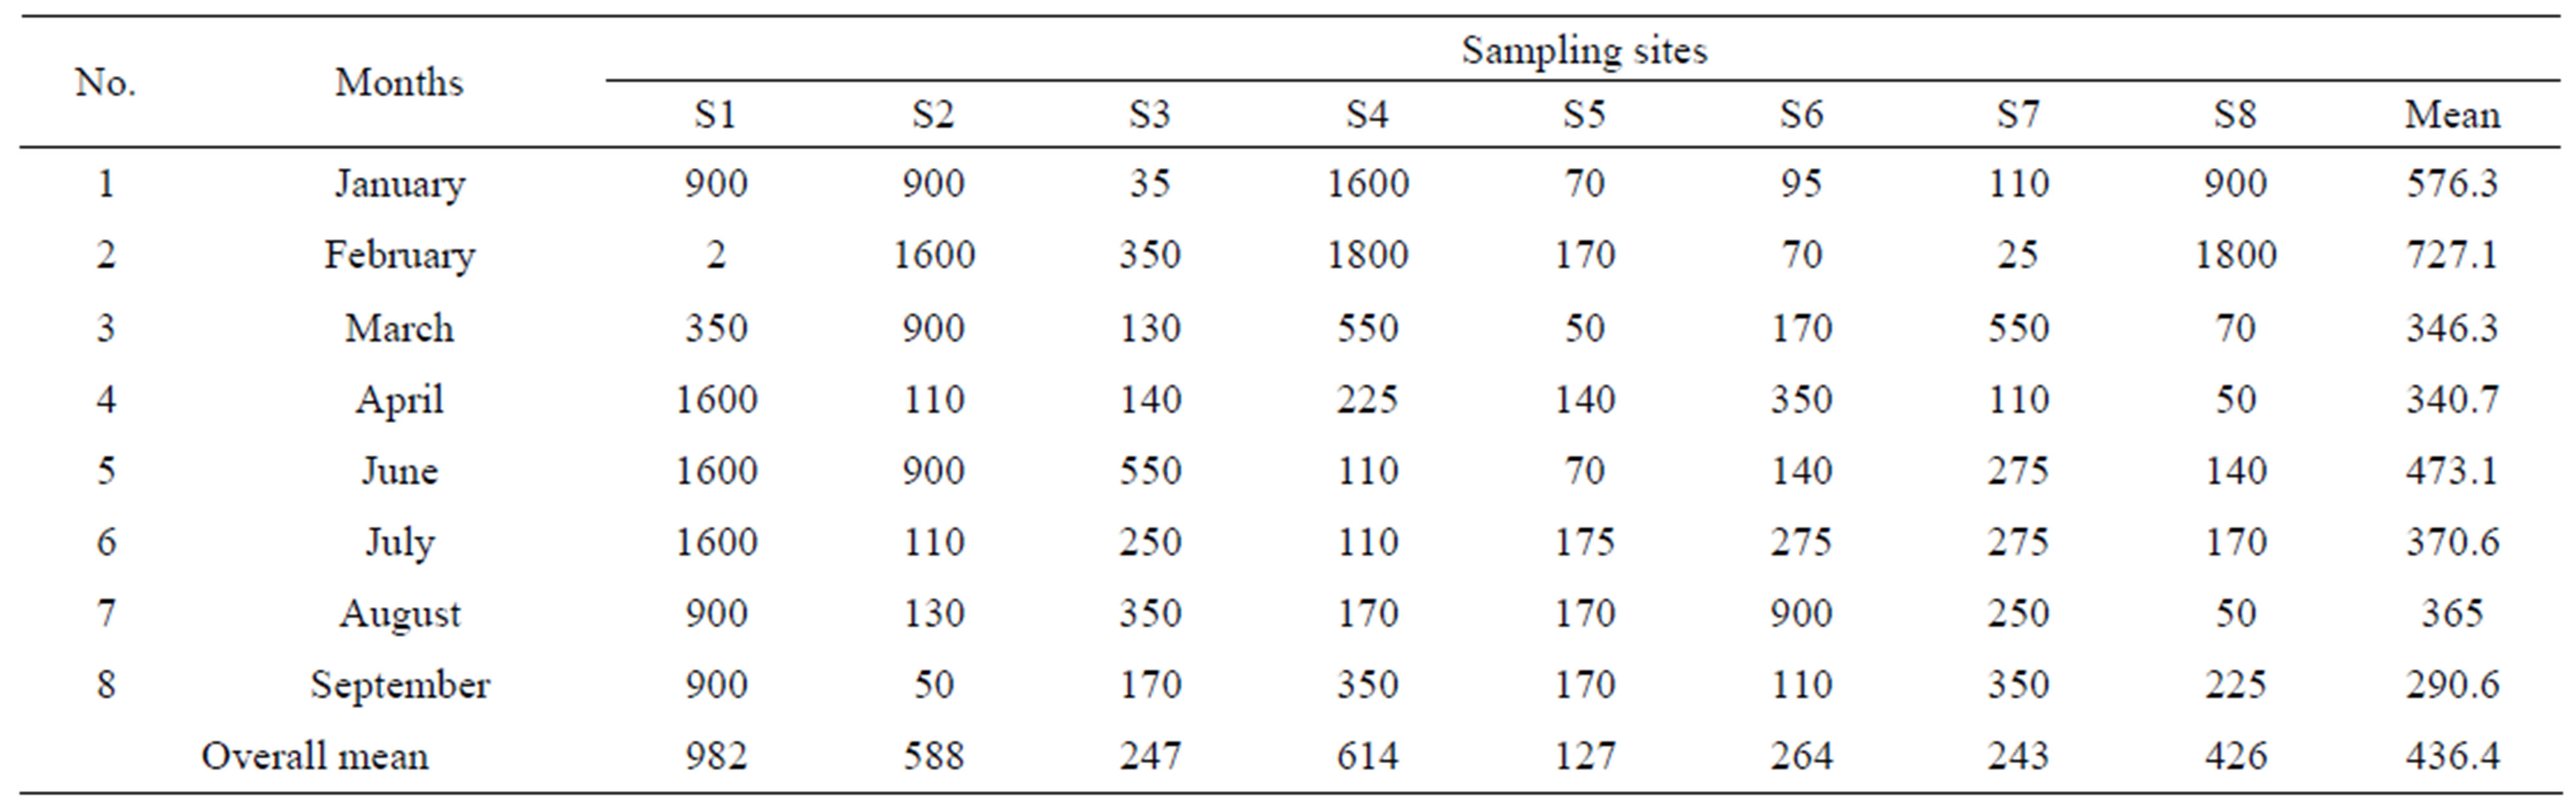
Table 7. The most probable numbers (MPN,s/100 ml) of fecal coliforms isolated from the water samples.
4. Discussion
All water bodies particularly the fresh is usually under environmental pressures leading to pollution of such vital human sources for human consumption. These pressures composed of chemical, physical and biological factors. Moreover, rapid human growth with various activities particularly in urban areas plays a major role in water contamination which consequently makes the situation more worse. Domestic and industrial wastes outfulls causing a serious damage to human habitat and finally leading to various diseases as well as shortage in suitable water sources applicable for human consumption and other uses needed by mankinds [2]. River Tigris is usually under pressure of these environmental factors which cause its pollution [3]. The Lower Al-Zab River is less affected by the mentioned factors due its geographical site that is almost relatively away from the civilian impact. Moreover, Al-Zab River is 110 kilometers in length starting from Dokan Dam and ending at its junction with River Tigris at Al-Shag in Al-Hawija.
Water temperature considered one of the vital factor for water habitat as it affects the dissolving of salts and gases especially oxygen and carbon dioxide [15]. Air temperature in Iraq is extreme which is highly elevated in summer exceeding 50˚C but during winter might decreased to be less than –10˚C. This thermal stress will obviously affects funa and flora that associated in life with water bodies and their sources. Furthermore, present study showed that the water temperature ranged from 0.9 to 26˚C. On the other hand, the present study revealed a high turbidity of the water of both River Tigris and River Al-Zab during April particularly at the Maddallah area on Al-Zab which was 81.03 NTU while the highest turbidity was seen at Al-Oja site on River Tigris during August (18.04 NTU). The rainfalls as well as river floods are the main causes of increased water turbidity during spring season in Iraq. This situation will increase the risk of water pollution as the rainfalls will clean out all pollutants towards the rivers. This is one of the major causes of increased numbers and types of bacterial indicators in water bodies [1,7].
Electrical conductivity can be define as the ability of water to conduct the electric current and this character depends on the concentration of water ions contents and water temperature [15,16]. In the present study, it was concluded that highest electrical conductivity was seen at Maddallah station on River Al-Zab in June but the lowest conductivity was recorded at Al-Mazraa station on River Tigris in February. Almost similar observations have been noticed by Al-Shwany [12]. This might be due to decreased amount and speed of Al-Zab water during summer in the last years along with increased domestic wastes nearby the river as large numbers of villages allocated on both sides of the river. In addition, River Al-Zab sourrounded by the most famous and important agricultural areas.
Biological oxygen demand (BOD) can be used for evaluation of the level of pollution due to domestic as well as industrial wastes mixed with water bodies. This variable is very important in self purification of water sources like rivers and lakes [17].
The present study revealed a range of BOD between 0.7 to 4.4 mg/litre (Table 4). The lowest value of BOD was recorded at University station (S5) during July whereas the highest value was seen at Abo-Dalaf site south of Tikrit city at February. This mean that water quality at Abo-Dalaf station is risky for human consumption and other uses [18]. The present study showed that the average value of BOD of River Al-Zab was 2.4 mg/l which is almost less than that found elsewhere [19]. However, the overall mean of BOD was 2.4 mg/l which is suitable for human consumption after drinking water purification process with reference to European characterizations 74/464/ EEC of waters used as sources for drinking waters [20].
The present study revealed variable total viable counts of heterotrophic bacteria with respect to different sites and months of collection; These values ranged between 11 to 324 × 10 cells/ml (Table 5). The highest numbers were isolated during January, February and March i.e. during cold weather whereas the lowest number was seen during September which is hot. Other workers concluded almost the same fluctuation of total viable counts in Iraqi rivers [12,21]. Cold weather as well as availability of organic matter are playing major roles in survival and presence of heterotrophic bacteria [7]. Furthermore, total coliforms is considered as an indicator for long-term water pollution [1]. The present study showed that the total coliforms were different according to sites of collection and the highest number was recorded in July which was almost 1023/100 ml (Table 6).The lowest most probable number of total coliforms was estimated during March (395/100ml). Hot months are associated with increased total coliforms and that may be due to decreased water bodies in rivers as well as the increased human activities in and/or around rivers which increased the pollution impact on these water bodies [21]. On the other hand, the most probable number of fecal coliforms isolated at 44˚C was considered as an indicator for recent microbial pollution [1,7]. The present study revealed a highest number during February (727.1/100 ml; Table 7) and the lowest number was seen during September (290.6/100 ml). However, Escherichia coli was the dominant bacteria among the fecal coliforms isolated in this locality. Maddallah site on Al-Zab showed 2 cells/100ml during February and this number is a strong indication that Al-Zab River waters under fluctuated sources of domestic pollution due to variability in dilution factor with a changable amount of waters released from Dokan Dam during the last yeasr. Moreover, the water flow of the River Al-Zab is very speedy due to its high slope compared to River Tigris and this is definitely affects the survival and number of bacteria in waters under study. However, the statistical analyses showed significant differences between the most probable numbers estimated at different localities during various months of study (P values were less than 0.5) using analysis of variance programme, Dancan test and t-test. It was concluded from the present study that Iraqi rivers as the main source of fresh waters for human consumption are under risk of shortage particularly of Al-Zab River as well as under severe impact of environmental pollution and chemical, physical and biological parameters. Moreover, the series of wars occurred in this country might increased the risk of water contamination that leads to public health hazards particularly the infectious diseases, cancers and genetic drifts. Finally, further investigations are disperatly needed to explore the various changes that might occurred in this locality.
5. Conclusion
The present study concludes that several physical, chemical and biological parameters of Tigris and Al-Zab rivers water (temperature, turbidity, electrical conductiveity, biological oxygen demand and bacterial indicators) vary depending on river, site and time of collection, the statistical analyses showed significant differences between the most probable numbers estimated at different localities during various months of study (P values were less than 0.5) using analysis of variance programme, Dancan test and t-test. It was concluded from the present study that Iraqi rivers as the main source of fresh waters for human consumption are under risk of shortage particularly of Al-Zab River as well as under severe impact of environmental pollution and chemical, physical and biological parameters. The most probable numbers (MPN,s) of fecal coliforms isolated at 44˚C were varied from site to site and from month to month (Table 7).The lowest number was recorded at Maddallah site (S1) on River Al-Zab in February which was 2/100 ml which was within the permissible limits of WHO for human consumption. The present study showed that the elcctrical conductivity of waters under investigation were varied and ranged between 230 to 678 ms/cm. The lowest value was recorded at Al-Mazraa site (S4) during January while the highest value was recorded at Maddallah site (S1) during June which was 675 ms/cm and this might be due to shortage of water supply from Dokan dam at this time of the year.
REFERENCES
- M. M. Al-Jebouri and D. R. Trollope, “The Escherichia coli Content of Mytilus edulis from Analysis of Whole Tissue or Digestive Tract,” Journal of Applied Bacteriology, Vol. 51, No. 1, 1981, pp. 135-142. doi:10.1111/j.1365-2672.1981.tb00917.x
- M. M. Al-Jebouri, “A Note on Antibiotic Resistance in the Bacterial Flora in the Raw Sewage and Sewage-Polluted River Tigris in Mosul, Iraq,” Journal of Applied Bacteriology, Vol. 58, No. 4, 1985, pp.401-406.
- M. M. Al-Jebouri and N. S. Al-Meshhadani, “A Note on Antibiotic-Resistant Escherichia coli in Adult Man, Raw Sewage and Sewage-Polluted River Tigris in Mosul, Nineva,” Journal of Applied Bacteriology, Vol. 59, No. 6, 1985, pp. 513-518. doi:10.1111/j.1365-2672.1985.tb03354.x
- J. F. Carney, C. E. Carty and R. R. Colwell, “Seasonal Occurrence and Distribution of Microbial Indicators and Pathogens in Rhode River of Chesapeake Bay,” Applied Microbiology, Vol. 30, No. 5, 1975, pp. 771-780.
- D. W. F. Wheater, D. D. Mara and S. I. Oragui, “Pseudomonas aeruginosa and Escherichia coli in Sewage and Fresh Water,” Water Research, Vol. 14, No. 7, 1980, pp. 713-721. doi:10.1016/0043-1354(80)90245-6
- J. A. Entry and N. Farmer, “Influence of Aquifers on Movement and Survival of Coliform Bacteria,” Agricultural Research, Vol. 2, 2000, pp. 1140-1145.
- M. M. Al-Jebouri and D. R. Trollope, “Indicator Bacteria in Marine and Freshwater Marine Molluscs,” Hydrobiologia, Vol. 111, No. 2, 1984, pp. 93-102. doi:10.1007/BF00008620
- H. B. N Hynes “The Biology of Polluted Waters,” Liverpool University Press, Cambridge, 1960, p. 202.
- W. D. Grant and P. E. Long, “Environmental Microbiology,” First published Thomson Litho Ltd., East Kilbridge, 1981.
- United States Environmental Protection Agency, National Primary Drinking Water Standards, USEAP, Washington DC, 2002.
- A. M. Turki, “Micrbiological Study on Saddam River Water,” MSc Thesis, University of Al-Anbar, Ramadi, 2001.
- T. M. K. A. Al-Shwani, “An Ecological and Microbiological Study on Lower Al-Zab Waters from Al-ton Kobri to Al-Hawija District in Al-Taameem Governorate,” MSc Thesis, University of Tikrit, Tikrit, 2001
- APHA Standard, Methods for Examination of Water and Waste Water, 16th Edition, American Public Health Association, Washington DC, 1985.
- Department of Environmental Reports on Public Health and Medical Subjects, “The Bacteriological Examination of Water Supplies,” Her Majesty, Stationary Office, 5th Edition, London, 1977.
- S. A. Abawi and M. S. Hassen “Practical Environmental Engineering for Water Examinations,” University of Mosul Press, 1990.
- G. A. Cole, “Textbook of Limnology,” 3rd Edition, London, 1983.
- C. N. Sawyer and M. C. Carty, “Chemistry for Sanitary Engineers,” 2nd Edition, McGrawhill Book Company, London, 1967.
- G. Smethurst, “Basic Water Treatment,” 2nd Edition, Thomas Telford, London, 1997.
- T. H. V. Tebbutt “Water Quality Control,” 5th Edition, Butterwoth, Heainemann, 1998.
- M. Salman, N. A. Al-Ansari and M. M. Al-Falluji, “Bacterial Density and Related Hydrological Parameters of Tigris Water within Baghdad,” Journal of Water Resources, Vol. 1, 1986, pp. 622-637.
- W. M. Waite, “A Critical Appraisal of the Coliform Test,” Journal of the Institute of Water Engineers and Scientists, Vol. 39, 1985, pp. 341-357.