Journal of Water Resource and Protection
Vol. 3 No. 5 (2011) , Article ID: 4979 , 7 pages DOI:10.4236/jwarp.2011.35039
Assessment of Spatial Variation of Groundwater Quality and Its Relationship with Land Use in Perth Metropolitan
Department of Civil Engineering, Curtin University of Technology, Perth, Australia
E-mail: P.Sarukkalige@curtin.edu.au
Received March 3, 2011; revised April 7, 2011; accepted May 1, 2011
Keywords: Groundwater, Quality, Land Use, Perth
ABSTRACT
To determine the effects of land use on groundwater quality in Western Australia, a quantitative analysis is carried out using groundwater quality data supplied by the Department of Water from over 500 groundwater wells across the Perth metropolitan area. We analyzed four main groundwater quality indicators; nutrients, physical parameters, inorganic non metals and trace metals. We found that groundwater beneath agricultural land was found to be particularly susceptible to nutrient loading due to the application of fertilizers. Nutrient levels were found to be rising over time due to increasing agriculture and urban development. Industrial areas were also found to have numerous contamination plumes that continue to migrate with the groundwater flow. According to Australian and New Zealand Environment and Conservation Council (ANZECC) guidelines and the Australian Drinking Water Guidelines (ADWG), several areas including rural areas like Carabooda lake, Gnangara and Jandakot Mounds, Cockburn Sound, Forrestdale, Joondalup, and Ellenbrook and high density urban areas like Balcatta and Neerabup, industrial areas like North Fremantle, Welshpool and Kwinana are indentified as the vulnerable areas for groundwater quality.
1. Introduction
Fresh water is fast becoming a scarce resource in Australia. The largest available source of freshwater is currently groundwater. As groundwater has a huge potential to ensure future demand for water, it is important that human activities on the surface do not affect negatively on this precious resource. It is important to Western Australia as it supplies approximately 70% of Perth’s fresh water for industrial, agricultural and municipal use [1]. Reduced rainfall in recent years and diminishing inflow has led to depleted dam levels in Perth [2]. Coupled with Western Australia’s population growth rate of 2.3% and concerns about climate change, Perth is facing significant water shortages and demand for groundwater continues to rise [3]. It is becoming increasingly important that the quality of Perth’s groundwater system be monitored and sustained for years to come.
Pollution of groundwater occurs when waste products or any foreign substance alters the biological or chemical characteristic of water and degrades the quality so that animals, plants or humans are affected [4]. Numerous studies have examined this correlation between land use and contamination of groundwater [5-8]. There are widely using tools such as Multivariate statistics analysis to analyze the variations in water quality and sources of contamination [9-11]. Although the progression of underground contaminants depends on numerous microbiological, physical and chemical processes; the most significant factor controlling contamination of groundwater is the source of contamination on the surface including its type, strength and location relative to the water source [5]. By studying the relationship between groundwater contamination and land use, issues of sustainability can be addressed and integrated with better land use practices and water protection strategies.
Perth groundwater is particularly susceptible to groundwater pollution as Perth has predominantly sandy soils that are generally correlated with low adsorption potentials; allowing for easy leaching of foreign chemicals through the soil profile [12]. Pesticides are one of the significant problems in Perth groundwater [13]. Another concern in regards to Perth land use is the historical use of septic tanks. There have been many studies that have correlated polluted groundwater with septic tanks [14].
This study mainly concerns the spatial distribution of groundwater quality in Perth Metropolitan basin and investigates the relationship between historical land developments and temporal variation of groundwater quality. Also the study addresses the critical levels of contaminants in Perth groundwater highlighting Australian water quality standards.
2. Methodology
2.1. Study Area: Perth Basin
The Perth Basin is selected as the study area. The geologic formations of the Perth Basin have been grouped into six distinct aquifers: The Superficial, Rockingham, Kings Park, Mirrabooka, Leederville and Yarragadee aquifers. These aquifers are locally, hydraulically connected or separated by confining beds or geologic formations [12]. Drainage patterns and hydraulic characteristics are categorised into distinct groundwater flow systems known as groundwater mounds. The Gnangara Mound is Perth’s most important water source supplying 380GL of fresh water per year. Recent studies have found that extractions from the mound are close to its sustainable limits [15].
In the past, Perth’s groundwater has been described as generally good in quality and predominantly pollutant free. However in recent years Perth investigations have shown increased levels of dispersed contaminants as well as a significant number of localised contamination plumes [16,17]. Land use has developed considerably since the development of the Swan River Colony in 1829. As Perth continues to grow and expand, there are increasing agricultural (primarily horticulture) and aquaculture developments over the Perth Basin. Furthermore, urban developments are intruding on the boundaries of the Gnangara and Jandakot Reserves [18]. It is becoming increasingly more important to have more stringent protection and management of Perth’s groundwater sources to limit the effects of urbanization on groundwater quality.
2.2. Data and Materials
The Department of Water (DoW) supplied qualitative data on 500 groundwater wells within the Perth metropolitan area. Available data is based on samples tested from 1984 to 2008. Based on available data, water quality data were grouped into historic (1984 - 1994), recent (1995 - 1999) and current (2005 - 2009) periods. For each period, data were analysed across the Perth metropolitan area to determine if there are any correlations between groundwater quality parameters and location. Data was assessed for spatial and temporal trends. A geo-statistical method of analysis was utilised that uses mathematical models to determine time and spatial trends in data. The SURFER Mapping System by Golden Software [19] was used to find trends in concentration distributions of groundwater quality parameters. The following groundwater quality indicators were analysed:
Nutrients: Total Nitrogen (TN), Nitrate (NO3), Ammonia, Total Phosphorus (TP)
Physical: Dissolved Oxygen (DO), Acidity (pH), Alkalinity Inorganic non metals: Arsenic (As), Chloride (Cl), Boron (Bo)
Trace metals: Zinc (Zn), Lead (Pb), Nickel (Ni)
Spatial distributions were examined and compared with assessment levels for groundwater quality adopted from the Department of Environment and Conservation (DEC). The DEC evaluates contaminated groundwater sites according to the Australian and New Zealand Environment and Conservation Council (ANZECC) guidelines [20] and the Australian Drinking Water Guidelines (ADWG) [21]. Results were discussed comparing to land use for the study area. A map of land use for the Perth Metropolitan Region Scheme (MRS) was supplied by the Department of Planning and Infrastructure through their Mapping and Geospatial Data [22]. The maps specify land use across the Perth metropolitan area including urban, industrial, state forests, parks and private recreational areas and rural and agricultural lands.
3. Results & Discussions
3.1. Comparison of Spatial Distribution of Groundwater Quality and Land Use Pattern
Several water quality parameters were analysed for historic, recent and current periods and their spatial distribution are mapped using the SURFER software. Figure 1 shows the spatial distribution of Total Nitrogen (TN), Alkality, Arsenic (As) and Zinc (Zn) to represent the distribution of nutrients, physical parameters, and inorganic parameters and trace metals in current period (2005 - 2009). Results for Total Nitrogen showed that levels in Perth are significantly high. Historic samples had an average total nitrogen content of 3.2 mg/l. This amount exceeds the ANZECC trigger limit for freshwater of 700 µg/L. Furthermore, the Total Nitrogen average increased to 3.6 mg/L for the 2005 - 2009 period. The spatial distribution indicates high levels of Nitrogen in northern rural areas around Carabooda Lake. This result is a concern as this area lies over the Gnangara Mound which is Perth’s major groundwater source.
Figure 1 further shows that low alkalinity is evident in northern suburbs of Joondalup and Ellenbrook. These
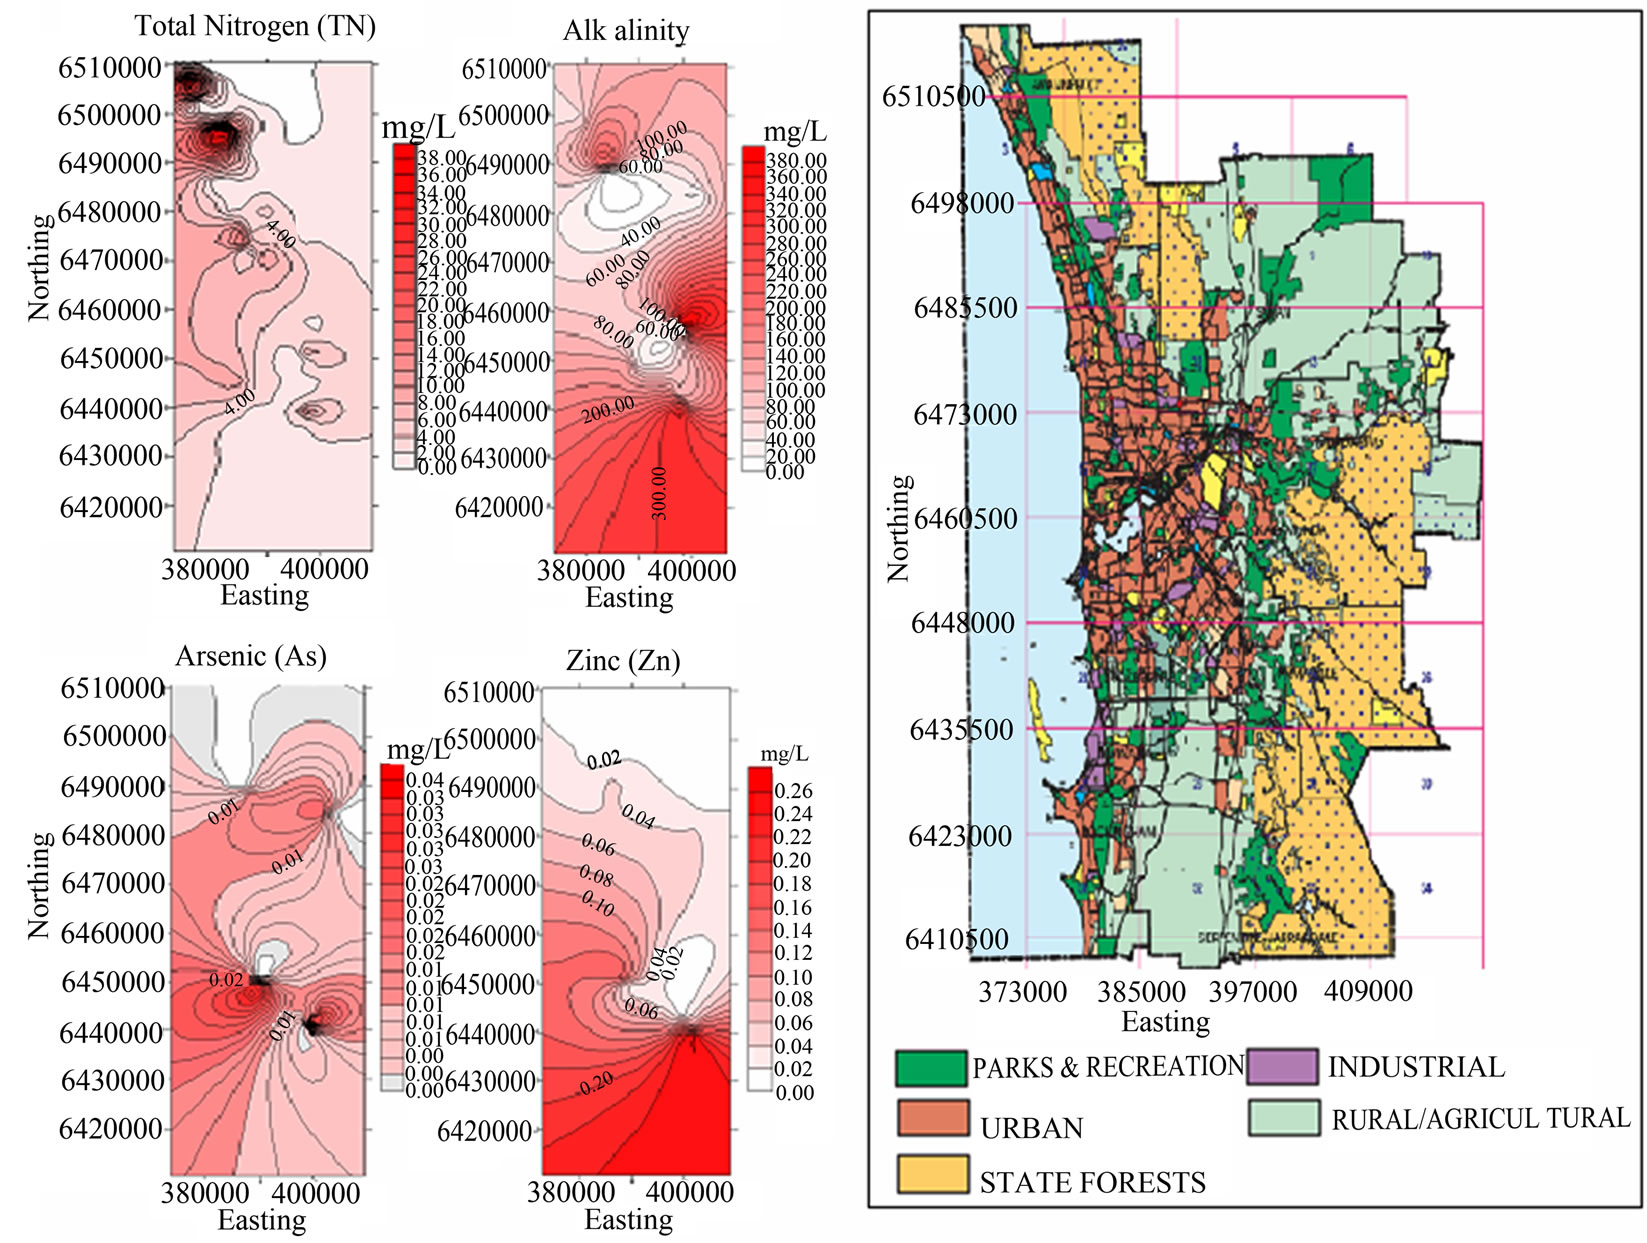
Figure 1. Spatial distribution of Total Nitrogen, Alkalinity, Arsenic, Zinc and comparison with land use pattern in Perth region (2005-2009).
areas are less like to resist changes in acidity levels. Studies have found that groundwater with alkalinity levels as low as 30 mg/L CaCO3 are vulnerable to rapid drops in acidity and increases in iron, aluminium and heavy metal concentrations [23]. Low alkalinity can be problematic during dewatering in preparation for new urban developments. Low alkalinity can support severe changes in pH levels. This analysis also confirms that observed pH levels are generally declining and there are areas with elevated levels of inorganic metals and non metals.
The concentration of Zinc in Australian drinking water supplies is generally around 0.05 mg/L but ranges up to 0.26 mg/L. There is no health guideline for zinc, however for aesthetic purposes a limit of 3 mg/L is placed by the ADWG. Water exceeding this amount can develop a “metallic taste” and can develop a “greasy” film when boiled [24]. In 2009, 48 groundwater wells were tested and 301 samples taken for zinc ranging from 0.001 mg/L to 1.5 mg/L. Average Concentrations for each site were calculated and ranged from 0.003 mg/L to 0.419 mg/L (Figure 1). Findings for zinc were found with hot spots located over Forrestdale Lake. Further investigation is required to decipher the source of the contamination.
Recent data (2005 - 2009) tells that, 44 groundwater wells across Perth were tested for arsenic and 283 samples were taken. Average arsenic concentrations ranged from 0.005 mg/L to 0.358 mg/L with average and median concentrations of 0.027 mg/L and 0.003 mg/L. In this period, 15 groundwater wells registered an average concentration in excess of the Australian Drinking Water Guideline of 0.007 mg/L (Figure 1). Arsenic can enter the groundwater by leakage of industrial effluents, waste incineration and burning of fossil fuels etc. External contaminants can also react with natural occurring arsenic in the soil and cause it to discharge into groundwater. The ADWG sets a limit of 0.007 mg/L for drinking water based on health reasons and possible links to carcinogenicity. According to the NHMRC (2004), arsenic concentrations in Australian waters tend to be less than 0.005 mg/L. From the spatial distribution map in Forrestdale Lake and North Lake show elevated levels of arsenic. North Lake is close to urban areas and Forrestdale is in a rural-residential setting. Further analysis is required to determine the cause of the contamination.
Addition to that, for the other parameters, the current groundwater quality was verified by analysing the 2005 - 2009 data. The study found that many areas in Perth have groundwater quality outside limits for ADWG guidelines. High nitrate levels are correlated with Total Nitrogen levels, with critical locations for some rural areas over the Gnangara and Jandakot Mounds. Ammonia also registered areas with critical levels exceeding ADWG guidelines of 1.5 mg/l for all testing periods. Furthermore, 70% of Total Nitrogen samples tested over the ANZECC trigger limit. Ammonia samples measured over the ANZECC trigger limit of 900 µg/L in 16% of samples. Arsenic quantities are also high with 15 sites found to be in excess of the ADWG limit. Chloride and Nickel is also extreme in 21 sites and 10 sites respectively. The pH levels of 33 sites are outside neutral limits of 6.5 - 8.5 with the majority showing acidic conditions. Interestingly, the majority of the samples for 2005 - 2009 are taken in close proximity to water catchment areas. It is presumed that these areas should have higher quality groundwater than other areas of Perth. The results suggest that groundwater conditions in other areas are likely to be of moderate quality.
The other testing periods (historic and recent) also found critical areas of Total Nitrogen in rural land east of Kwinana and in high density urban areas near Balcatta, with levels reaching as high as 89.6 mg/L. Also many rural areas have nutrient levels in excess of the ADWG guidelines. Urban areas also show elevated nutrient levels owing to residential activities and a history of agriculture and fertiliser use. Testing for the three periods indicates that nutrients levels in Perth are typically higher in rural areas where fertilizer is the primary pollution source. Perth sandy soils do not readily adsorb nutrients so fertiliser can easily leach into superficial aquifers, especially when over watered. Urban areas have also shown higher levels of Nitrogen but further investigations are required to determine if the pollution source is owing to municipal or historical agricultural use. Recent sampling data is limited to predominantly rural land close to water protected sites. Inorganic non metals and trace metals in groundwater in the Western Australia include site specific spills or leaks from industrial and waste disposal sites. A large number of contaminated sites have been recorded in industrial areas including North Fremantle, Welshpool and Kwinana. Restrictions have been placed on these sites that limit the land zoning to either industrial or commercial. Groundwater extractions are prohibited in the majority of these sites based on health concerns of the contaminants.
3.2. Temporal Change of Nutrient Content
Nutrient content was examined in more detail as it is considered the best indicator of anthropogenic processes and impact from land use activities. Figure 2 illustrates the change in Total Nitrogen (TN) and Total Phosphorous (TP) amount between historical and current periods. Critical changes are coloured red, low change areas are yellow and areas showing reduced nitrate content are shaded green. The temporal changes also show similar results as the spatial distributions for Total Nitrogen with a general rise in content towards the outer suburbs where rural land is more predominant. These distributions indicate critical areas near Carabooda and Neerabup, north of Perth. Both areas are in close proximity to rural land and Neerabup also lies next to industrial developments. The distributions show a reduction in Nitrogen in the inner urban suburbs of Perth towards the mouth of the Swan River. Variations to Total Phosphorus appear less severe than Nitrogen levels. Increased Total Phosphorus was only found in a few dispersed areas across Perth. Rural areas inland from the Cockburn Sound, Forrestdale and Southern River (south of Perth) were found to have critical changes to Phosphorus levels. Fertiliser content and characteristics of the soil in these areas should be analysed further to determine more conclusive outcomes.
3.3. Variation of Nutrient Content over Time
To establish a general understanding of temporal trends, changes in annual average Total Nitrogen and Total Phosphorous were considered. The study found that, there is a general rise in nutrient concentration in groundwater over time for the Perth metropolitan area. Figure 3 shows the average increasing Total Nitrogen and Total Phosphorous trend for the 500 groundwater wells. Similar increasing trends were found for all nutrient parameters including total nitrogen, nitrate, ammonia and total phosphorus.
Contrary to this trend, groundwater wells with elevated levels of total nitrogen were found to show decreasing levels in water protected areas. These findings indicate that nutrient content is affected by land use but can be controlled with proper management and monitoring processes. This result, combined with the large number of groundwater wells exceeding trigger limits, demonstrates the need for the establishment of long term monitoring and management programs over a broader region.
Results of the study are used to develop groundwater vulnerability maps while recommending the necessary regulations to control the contamination of ground water system while improving these invaluable resources. These recommendations will assist land users, land developers, planners and decision-makers in coming up with better land management concepts and land use procedures to ensure long-term sustainability minimize natural and anthropogenic impacts on groundwater resources.
4. Conclusions
Perth water sources have reached their sustainable limits
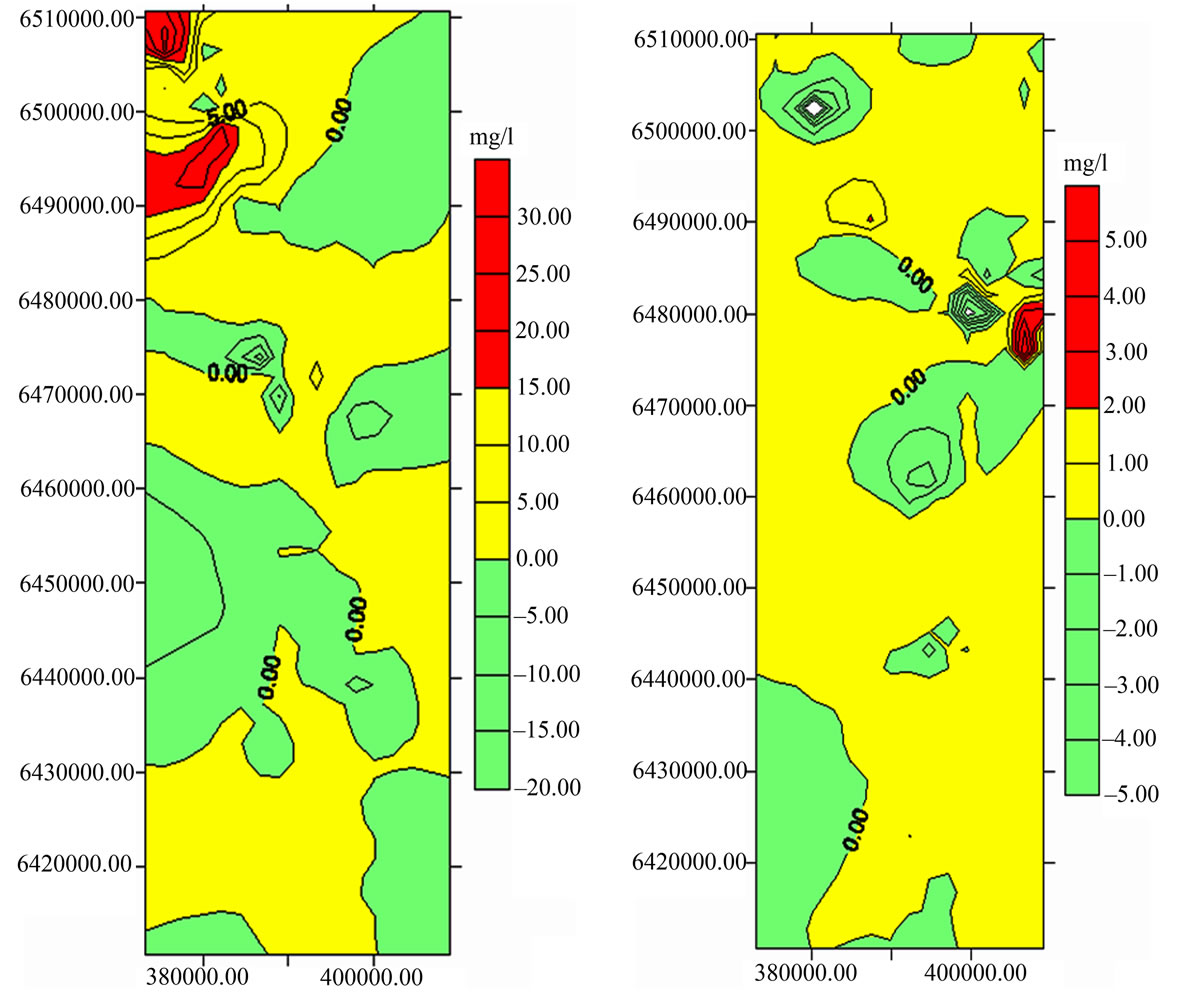 (a)
(a)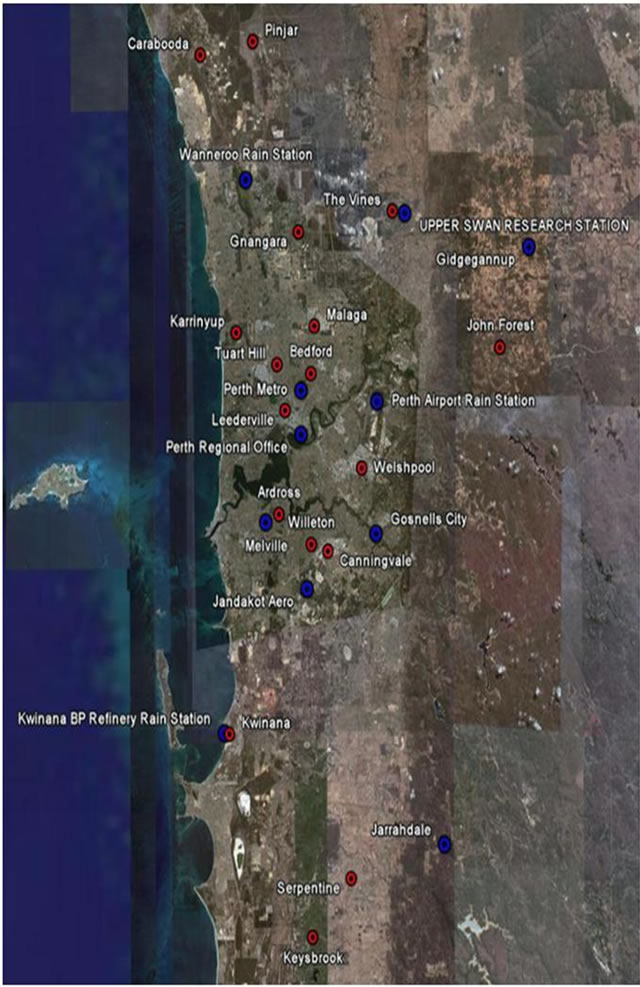 (b)
(b)
Figure 2. Variations in (a) Total Nitrogen and (b) Total Phosphorous between 1984 and 2009.
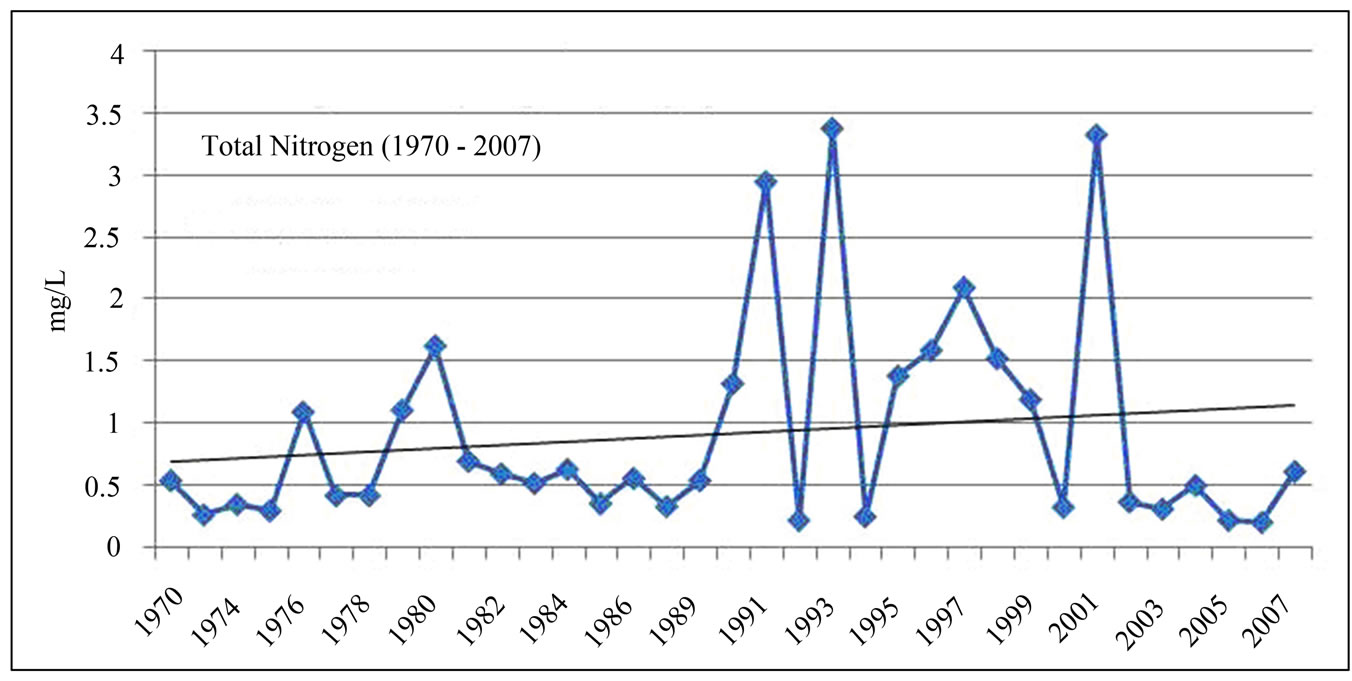
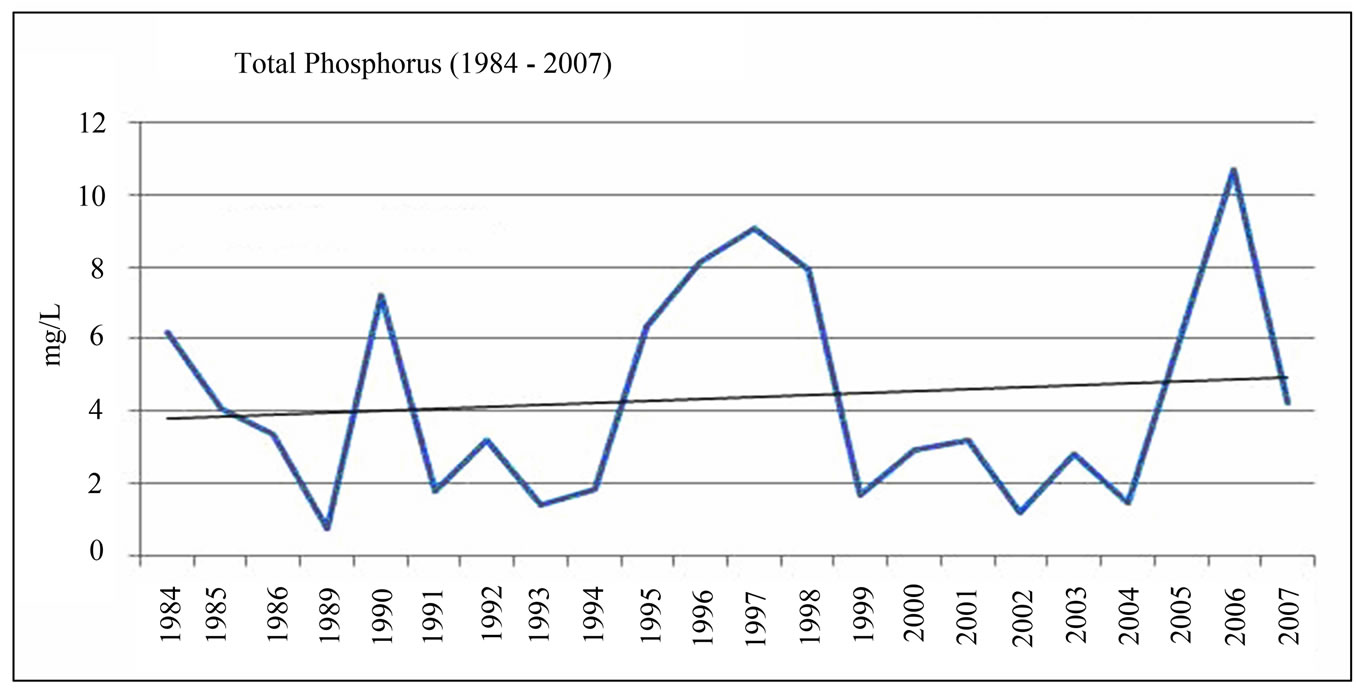
Figure 3. Variation of annual average Total Nitrogen and Total Phosphorous content.
so it is increasingly important to protect Perth’s groundwater to ensure its quality is maintained. This study found that groundwater beneath agricultural land was found to be particularly susceptible to nutrient loading due to the application of fertilisers. Nutrient levels were found to be rising over time due to increasing agriculture and urban development. Industrial areas were also found to have numerous contamination plumes that continue to migrate with the groundwater flow. Therefore this study concludes that there are many areas in Perth including rural areas like Carabooda Lake, Gnangara and Jandakot Mounds, Cockburn Sound, Forrestdale, Joondalup, and Ellenbrook and high density urban areas like Balcatta and Neerabup, industrial areas like North Fremantle, Welshpool and Kwinana are showing critical levels of nutrients, inorganic metals and heavy metals. Furthermore, temporal analysis indicates increasing trends in nutrient level These findings indicate that nutrient content is affected by land use but can be controlled with proper management and monitoring processes. This result, combined with the large number of groundwater wells exceeding trigger limits, demonstrates the need for the establishment of long term monitoring and management programs over larger target areas.
5. Acknowledgements
Author would like to acknowledge the data received for the Department of Water, and the Department of Environment and Conservation, Western Australia and Mrs. Kelly Heuchan and Mr. Ryan Agnew for their support in the initial analysis.
REFERENCES
- National Water Commission, “Groundwater Management Challenges: The Gnangara Mound,” Western Australia - Case Study, 2007.
- National Water Commission, “Australian Water Resource Assessment,” Commonwealth of Australia, 2005.
- Australian Bureau of Statistics, “Regional Population Growth Rate - Australia 2006 - 2007,” 2008. http://www.abs.gov.au
- Waters and Rivers Commission, “Water Facts,” Publication of the Government of Western Australia, Perth, 1998.
- D. A. V. Eckhardt and P. E. Stackelberg, “Relation of Ground-Water Quality to Land Use on Long Island, New York,” Ground Water, Vol. 33, No. 6, 1995, pp. 1019- 1031. doi:10.1111/j.1745-6584.1995.tb00047.x
- P. Hudak and S. Blanchard, “Land Use and Groundwater Quality in the Trinity Group Outcrop of North Central Texas,” Environment International, Vol. 23, No. 4, 1997, pp. 507-517. doi:10.1016/S0160-4120(97)00053-6
- K. K. Gardner and R. M. Vogel, “Predicting Groundwater Nitrate Concentration from Land Use,” Ground Water, Vol. 43, No. 3, 2005, pp. 343-352. doi:10.1111/j.1745-6584.2005.0031.x
- D. N. Lerner and B. Harris, “The Relationship between Land Use and Groundwater Resources and Quality,” Land Use Policy, Vol. 26, Supplement 1, 2009, pp. S265-S273. doi:10.1016/j.landusepol.2009.09.005
- K. Skeppstrom and B. Olofsson, “A Prediction Method for Radon in Groundwater Using GIS and Multivariate Statistics,” Science of the Total Environment, Vol. 367, No. 2-3, 2006, pp. 666-680. doi:10.1016/j.scitotenv.2006.02.044
- E. M. de Andrade, H. A. Q. Palácio, et al., “Land Use Effects in Groundwater Composition of an Alluvial Aquifer (Trussu River, Brazil) by Multivariate Techniques,” Environmental Research, Vol. 106, No. 2, 2008, pp. 170- 177. doi:10.1016/j.envres.2007.10.008
- M. Chen, R. M. Price, Y. Yamashita and R. Jaffe, “Comparative Study of Dissolved Organic Matter from Groundwater and Surface Water in the Florida Coastal Everglades Using Multi-Dimensional Spectrofluorometry Combined with Multivariate Statistics,” Applied Geochemistry, Vol. 25, No. 6, 2010, pp. 872-880. doi:10.1016/j.apgeochem.2010.03.005
- W. A. Davidson, “Hydrogeology and Groundwater Resources of the Perth Region, Western Australia,” Geological Survey of Western Australia, Perth, 1995.
- S. J. Appleyard, P. Manning and P. Thorpe, “Pest Control Deposits as Sources if Groundwater Contamination in Perth, Western Australia,” Land Contamination and Reclamation, Vol. 5, No. 4, 1997, pp. 292-305.
- D. Cain, D. R. Heisel and S. E. Ragone, “Preliminary Evaluations of Regional Groundwater Quality in Relation to Land Use,” Ground Water, Vol. 27, No. 2, 1989, pp. 230-244. doi:10.1111/j.1745-6584.1989.tb00444.x
- Department of Water, “Managing Western Australia’s Most Precious Resource,” Publication of the Government of Western Australia, Perth, 2008.
- C. Barber, R. Barron, J. Broun, L. Bates and K. Locksey, “Evaluation of Changes in Groundwater Quality in Relation to Land-Use in the Gwelup Wellfield, Western Australia,” CSIRO Division of Water Resources, Canberra, 1993.
- S. Hirschberg, “Point Sources of Groundwater Contamination in the Perth Basin and Their Significance,” Western Australia Geological Survey, 1991.
- Department of Environment, “Southwest Region,” 2008. http://portal.environment.wa.gov.au
- Golden Software, “Surface Mapping System,” SURFER Version 5.01, Golden Software Inc., Colorado, 1994.
- ANZECC, “Guidelines for the Assessment and Management of Contaminated Sites,” Publication of Australian and New Zealand Environment and Conservation Council, Canberra, 1992.
- Department of Environment, “Assessment Level for Soil, Sediment and Water,” 3rd Edition, Publication of the Government of Western Australia, Perth, 2003.
- Department of Planning and Infrastructure, “Metropolitan Region Scheme Maps, Online Sources,” 2008. http://www.wapc.wa.gov.au/Mapping/889.aspx
- Department of Environment and Conservation, “An Initial Assessment of Groundwater Acidification on the Gnangara Mound,” Unpublished Report, Government of Western Australia, 2008.
- National Health and Medical Research Council, “The Australian Drinking Water Guidelines,” Publication of the Natural Resource Management Ministerial Council, Canberra, 2004.