Journal of Service Science and Management
Vol.6 No.1(2013), Article ID:28840,8 pages DOI:10.4236/jssm.2013.61005
Capital Budgeting Techniques Used by Small Manufacturing Companies
![]()
University of New South Wales, Sydney, Australia.
Email: m.hasan@unsw.edu.au
Received October 31st, 2012; revised November 30th, 2012; accepted December 15th, 2012
Keywords: Capital; Budgeting; Manufacturing; Small
ABSTRACT
Small companies account for 40% of Australian jobs and yet most of the studies on capital budgeting techniques have been focused on large firms. A mistake in their capital budgeting process could lead to disastrous consequences as they do not have the financial clout to recover from them. The purpose of the paper is to investigate where small manufacturing companies in Australia stand in regard to the use of capital budgeting techniques and risk analysis. The research concludes that while there is an indication of usage of the Payback Period with Discounted Cash Flow (DCF) techniques, there is a need for more frequent usage of risk analysis as well as management sciences which is found lacking in the capital budgeting process of small companies.
1. Introduction
One of the most important aspects of managing a company, besides leading it towards the vision of its owners, is the management of capital. The use of capital budgeting techniques is hence an integral tool in capital management. Capital budgeting can be defined as the “total process of generating, evaluating, selecting and following up on capital expenditures”. Hence, capital budgeting techniques would be the set of tools with which financial managers use to establish criteria for investing capital into available opportunities. A mistake in its capital budgeting process thus would cause a detrimental effect to the financial position of the company in the future. The pressure on a financial manager is understandably enormous. Therefore, depending on the needs and direction of the company, the financial manager is to apply capital budgeting techniques that would maximize the value of the company.
Furthermore, Peterson [1] states that, to correctly implement these techniques, analysis of the following is required:
• Its future cash flow;
• The degree of uncertainty associated with these future cash flows;
• The value of these future cash flows considering their uncertainty.
Even though small manufacturing companies account for 41% of all employment in Australia, limited studies have been done on small manufacturing companies. Hence, the aim of this research is to ascertain where small manufacturing companies in Australia stand in regard to the use of capital budgeting techniques and risk analysis.
2. Literature Review
Surveys are few and far between when it comes to capital budgeting techniques and small manufacturing companies. Chadwell-Hatfield et al. [2] looked into the financial criteria used to evaluate projects, capital budgeting and risk analysis techniques employed by large and small US manufacturing firm. In their survey, it was found that a large number of firms did not formally analyse all proposals. The results also showed that multiple evaluation techniques were preferred in the analysis of proposals. Techniques that were problematic in theory appealed to managers in practice. They concluded that their results of the capital budgeting survey were inconsistent with previous studies and they felt that it was due to the sample that they chose. Block [3] noted that a number of patterns pertaining to capital budgeting were exhibited by small firms. Payback continued to be the dominant technique employed not due to lack of sophistication but rather the financial pressures placed on them by financial institutions. In spite of this, small business has become more sophisticated as over 27% used DCF as the primary method of analysis as compared to earlier studies. However, this conclusion may be somewhat misleading as the discount rate was not scientifically calculated. Several surveys of capital budgeting practices [4-7] reveal that the IRR is preferred over the NPV as an investment decision making tool. Practitioner’s preference for the IRR is explained by the fact that IRR is treated as a display method and is more cognitively efficient. Since the IRR is expressed as an interest rate, it more closely resembles an analog display, in which the IRR is simply compared to the required rate of return, whereas the NPV is expressed in dollars, resembling a precise digital display [8,9].
3. Research Methodology
A questionnaire was used to obtain information regarding the capital budgeting practices of the targeted manufacturing companies. The survey, complete with reply paid postage, consisted of 12 close ended questions and 6 open ended questions. Based on the Australian Research Council’s Standard Industrialization codes, a random selection of 360 manufacturing companies were selected from the Kompass Business Directory of Australia. According to the then House of Representatives Standing Committee on Industry, Science and Technology, manufacturing companies were deemed to be small if they employed less than 100 employees. The survey sought to include small manufacturing companies as well as a small proportion of medium sized companies. So the targeted companies were to have less than 150 workers under their employment It is against this criteria from where the companies were chosen from the Kompass Directory.
4. Survey Results
360 surveys were sent out to various companies selected from the Kompass Business Directory. A total of 62 surveys were returned yielding a response rate of 17 percent.
4.1. Company Information
According to Table 1, majority of the manufacturing companies surveyed are in the small company category.
It can be seen from Table 2 that 40.3% of the respondents had a turnover between $20M - $29M. Next, 42% of the respondents had a turnover range between $1M - $19M. 12.9% of those surveyed had a turnover of less than $1M while only 4.8% of those surveyed had more than $30M in annual turnover. This data shows that even though they are considered small manufacturing companies, they do have very large turnovers. Hence, they should at least be employing some sort of capital budgeting techniques that would properly manage their assets and capital to protect their future financial position.
From Table 3, it can be seen that majority of the respondents, 29 percent to be exact, were financial controllers of their respective companies. 21 percent of the respondents were managers, 19 percent were accountants with the rest being company secretaries, management accountant manager, directors and general managers.
Table 1. Number of employees.
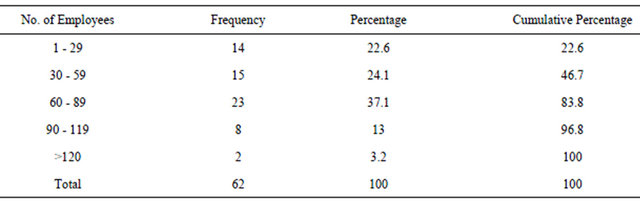
Table 2. Annual turnover of respondents.

Table 3. Position held by respondents.

This data shows that even though these companies are defined to be small by the ABS due to the fact that they have less than 100 employees, the principal decision making functions do not rest entirely on the shoulders of the owners or managers. Financial controllers and accountants have been employed to provide the owners with a better understanding of the consequences of their decisions in pursuing any particular project.
Respondents were asked to rank objectives of their company in terms of importance. The results are shown in Table 4.
From the above table it is obvious that the most important objective of the companies is to make as much profit as possible. Furthermore, 66.1% of the companies felt that increasing profitability is the most important with a mean score of 4.55. Companies also felt that increasing sales growth, providing a high quality of service and the provision of their particular business were high on their agenda. One company stated that in order to be a successful company, they needed to excel in all of the above objectives listed out. However, majority of the respondents felt that increasing employment did not have such a high priority on their list of objectives. This would probably be due to the fact that increasing employment would not necessarily aid in their aim on increasing profitability as it is widely known that labour costs are the highest contributing factor to the cost of production. As computers represent a lower cost in the long run, they are increasingly being used by manufacturers who only hire skilled labour to maintain these computers systems. Hence, the manufacturers do not view increasing employment as an important objective.
4.2. Financial Criteria
Respondents were asked about their use of capital budgeting techniques and the way with which they go about using it.
Table 4. Objectives of company.
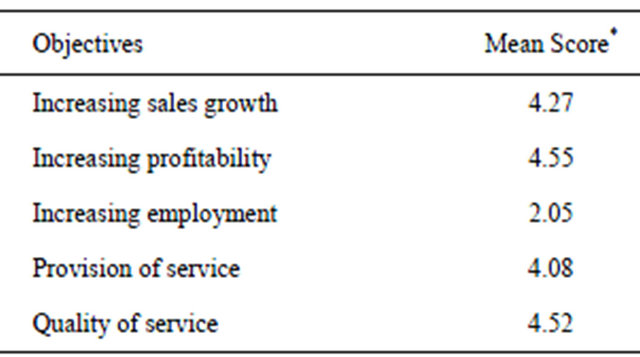
*(Likert scale; 1—least important, 5—most important).
Table 5. Main areas where new investments were made in (respondents could choose more than 1 option).

From Table 5 above it is observed that 38% of the proposed investments go into the replacement and maintenance of machinery. Expansion into new areas or market is next on the agenda with 29% of respondents. Extension of products was next with 14% with the rest being safety of environmental concern and R & D.
Respondents were asked which techniques whey used when deciding which projects to pursue. The results are shown in Table 6.
It can be seen from Table 6 that Payback period is the most heavily used method of evaluating projects with 48.4% of the respondents stating that they used the techniques most frequently. Only 4.8% of the respondents never used this technique. This would most probably have to do with it being one of the simplest techniques around that does not require expert knowledge in the field of finance. Having said that, companies may use this techniques because they have obligations to their banks that do not always see the innovativeness of their ideas or look at the NPV or IRR of the investment but rather how soon they could repay the loans that they take out. They would use this technique to provide a gauge as to how fast they could get their money back from the investment. The arithmetic mean is 3.45 years which equates to a minimum payback period yield of 29% which is unusually high. This criteria would result in many investments being rejected as the medium return on investment is not that high.
From Table 6 it can be observed that the Discounted Payback Period is not used frequently. It has a mean score of 1.93 which means that companies almost never used them. Only 48% of the respondents used it frequently and 56.5% never even used it at all. This may be due to the technique being not sophisticated enough plus the fact that it doesn’t provide a clear cut option for the financial controller to decide whether he/she should choose a particular project over others. NPV is the third most frequently used technique. With a mean score of 3.32, the NPV is considered to be moderately used. This technique is the third most popular. The reason for this could be the increase of use of more sophisticated discounted cash flow (DCF) techniques to compliment the Payback Period that they so regularly use. As the NPV helps managers determine how much they will make at the end of the project duration, it gives them an indication of the payback in dollar terms.
Only 12.9% of those surveyed used Profitability Index (PI) frequently, 33.9% never used this technique in the capital budgeting process. With a mean score of 2.39, it is not entirely favourable with financial managers but is still used once in a while. This technique could be used by them as a secondary tool to gauge a project. As PI is not entirely accurate when comparing between mutually exclusive projects, as the project may show the same increment in values but different net present values, this may explain the lack of usage. The mean score of 3.35 for the technique internal rate of return suggests that it is moderately used. It is also the next most popular technique after the Payback Period. This shows that the financial managers are using this technique along with NPV to compliment that of Payback Period. Even though it is not as commonly used as the Payback Period, it shows that small companies are beginning to adopt the usage of sophisticated capital budgeting techniques in their evaluation of investments. From Table 6, it shows that a whopping 43.6% of those surveyed have never used the technique Accounting Rate of Return while only 4.8% use it frequently. This shows that the technique is not popular among managers. This is because of the complexity of the techniques plus the fact that there are many variants and also that the techniques is flawed.
Respondents were asked of the techniques that they used, which were the ones that they used for outright acceptance or rejection of a project. They were also asked to provide criteria with which they would accept or reject a project based on that technique.
From Table 7, it can be seen that the 21% of 43 respondents that used Payback period as an outright acceptance/rejection tool, indicated that any investment would be acceptable if the payback period was between 3 to 5 years. 16% indicated that the cut off period was between 3 to 4 years. It also suggests that managers are flexible with the payback period when they indicated a range rather than just a specific deadline. It can also seen that the longest payback period that managers were willing to accept was 5 years. No respondent indicated a greater than 5 year payback period. The reason might be the deadline that banks set for them to repay the loan. It is also interesting to note that in the Australian manufacturing sector, 5 years is considered to be the adequate timeline for implementing any new strategy which could be another reason for the 5 year payback period.
In regard to NPV, it was found that only 11 companies used NPV as a technique that decided out rightly on whether the company should accept a project. All of the companies that indicated that NPV was used stated a >0 criterion when choosing to accept the project.
From Table 8, it can be seen that 32% of the respondents that used IRR as an outright rejection/acceptance tool, favoured an IRR of between 5% - 9%, 27% of the 22 respondents that used IRR as a tool for outright acceptance/rejection of investments, stated that the wanted a range between 10% - 14%. A further 18% stated that if the IRR for a project was less than 15%, they would reject the project. Only 23% of the respondents felt that they need at least a return of 20% before accepting a proposal with one company suggesting a return of 33%. This result is highly consistent with the economic climate. As a result of the global economic meltdown, most companies have set realistic rate of return in evaluating new investments.
Respondents were asked what determined their rate of return. The results are shown in Table 9.
From Table 9, it can be seen that 43.5% of the
Table 6. Techniques used in project evaluation.
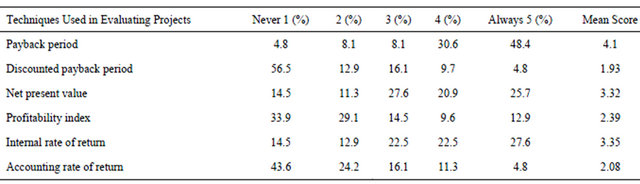
Table 7. Acceptance range for payback period.
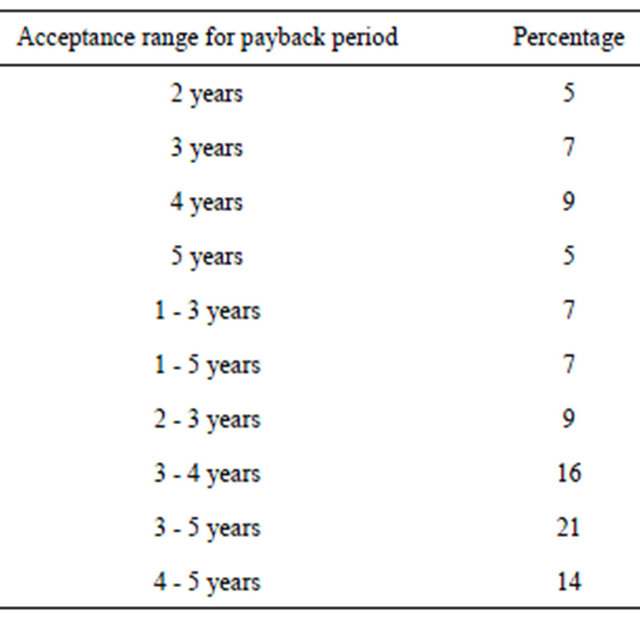
Table 8. Acceptance range of internal rate of return (IRR).

Table 9. Determination of rate of return.

companies use the cost of debt in determining their rate of return. The cost of debt refers to the cost that is incurred when incurring a debt from, say the bank. Hence, the interest that banks charge would be the cost of debt. This suggests that the manufacturers would base their rate of return on the debt incurred for investments like replacement of old machinery, extension of product lines etc. It can also be seen that only 8.1% of companies based their rate of return on the cost of equity capital which is the return that is required by suppliers of capital to compensate them for providing capital. No respondents chose Weighted Average Cost of Capital as their rate of return. It could be because it is highly complex and only large companies utilize such a return. From Table 9, it can be seen that 33.9% of those surveyed determined the rate of return based on their experience. 30.6% of the respondents felt that their rate of return should be in line with their expectations with respect to growth, this would also require the experience of the financial manager to determine what these expectations were and whether they could achieve those expectations based on present economic situations.
Respondents were asked what size in A$ must a project be to be subjected to formal quantitative analysis using capital budgeting techniques.
From Table 10, it can be seen that 18% of the respondents indicated that a project must be at least $15,000 in size before they would use capital budgeting techniques. Another 18% indicated at least $20,000, 16% at least $10,000 and 15% at least $50,000. 5% of the respondents actually indicated that projects needed to be $100,000 before they started to evaluate them. That might indicate that they are in an industry where costs in for example, replacement of machinery, are high.
Respondents were asked to rank stages in the capital budgeting process according to their importance. The results are given in Table 11. According to Table 11, Project definition and Cash flow estimation stage of the capital budgeting process is most critical. 58% of those that responded felt so while 0% thought it was the least critical stage of the capital budgeting process. This shows that manufacturers are focussed towards having a good start when it comes to evaluating projects. If they are not properly defined, the results of the financial analysis may not be accurate which would lead to unreliable analysis which affects the financial standing of the company. With a mean score of 2.09, Financial Analysis & Project Selection is the second most important stage of capital budgeting. 45.1% thought that they were the second most critical stage with 32.2% said that they were the third
Table 10. Project size before being subjected to scrutiny with capital budgeting techniques.

most critical stage. This shows that after correctly estimating the project and cash flows, capital budgeting techniques were to be applied to decide which projects maximised the wealth of the owners.
Project implementation is the 3rd most critical stage of the capital budgeting process; this stage is crucial as a project needs to be executed flawlessly to achieve the desired results. Hence, this stage deserves more recognition by the managers. With a mean score of 3.74, the project review stage is the least critical of the 4 stages. 74.2% of the respondents rated it the least important. This does not justify the importance of the stage.
4.3. Debt Management
Respondents were asked how much each factor proposed affected the way they chose the appropriate amount of debt for their companies. The details are shown in Table 12.
From Table 12, 32.3% of the respondents indicated that it was not important to maintain a certain level of debt to obtain tax cuts while 9.7% thought that it was very important. With a mean score of 2.6, this factor is moderately important for maintaining a certain level of debt. Maintaining a level of debt so that you can obtain the maximum tax benefit not only restricts your financial flexibility but may also cause cash flow problems. 33.8% of the respondents felt that the threat of the potential cost of bankruptcy was not an issue when deciding on a debt level to maintain. Interestingly, 40.3% thought that the threat was a deterrent to maintaining a high level of debt. This just shows the different style of management by different sets of financial managers. Some managers might not be daunted by the risk of bankruptcy while others would never even contemplate the remote possibility of bankruptcy.
43.5% of those surveyed believed that they should not compare their debt levels to others in the same industry. With a mean score of 1.89 it signifies that most managers do not manage their debt against such a barometer. This data shows that the debt levels of other companies should be used to indicate their well-being and not as a yardstick for your own debt level. From a mean score of 2.55 for credit rating, it indicates that this factor is moderately unimportant in the determination of the level of debt. This shows that the managers are not bothered that their credit rating may drop which affects their ability to get loans in the future at an acceptable rate and period. With a mean score of 3.45 for Transaction cost and fees for incurring debt, it shows that managers are somewhat concerned with the consequences of incurring debt. Financial flexibility, with a mean score of 3.93, is the most important factor when determining the amount of debt.
Table 11. Ranking of stages in the capital budgeting process.

Table 12. Factor affecting the appropriate amount of debt.

This indicates that managers are not willing to sacrifice their financial flexibility in case some lucrative project comes along and they are unable to act on it because of inflexible financial ability.
4.4. Risk Management
Respondents were asked if they used any method for incorporating risk in the evaluation of capital expenditure proposal. The results are shown in Table 13.
From Table 13, majority of the respondents (64.5%) cited that they have never used sensitivity analysis in incorporating risk into their project before. With a mean score of 1.82, it shows that this technique is only used sometimes which may be due to the complexity of this techniques. A whopping 71% of those replied had never used the technique of Monte Carlo simulation before. Again, this technique is highly complex and hence the reason for its lack of usage. Majority of those that replied (77.4%) never use the Bailout Factor before. With a mean score of 1.45, it is the least used risk analysis technique. Scenario forecast technique has the highest mean score, which suggest that although it is still being used sparingly, it is the most popular risk analysis technique. Contributing factors might be the fact that it is relatively simple to use and that it provides forecasts for both high and low risk projects. Hence, it gives the manager an idea of what is likely to happen in real terms when risk is factored in. With a mean score of 2.56, Measure Expected Variance in Returns is the second most popular technique. This may be due to the simplicity of the technique.
Respondents were asked how frequently they used certain methods for risk adjustment. The results are given in Table 14.
From Table 14, Shorten payback period with a mean score of 2.52, is used sparingly. Adjust estimated cash flows using probability factors has a mean score of 2.13 which suggest that it is only used once in a while. With a mean score of 3.15, Adjust rate of return is the most popular risk hedging technique. This is probably due to the fact that this is one of the simplest methods in hedging risk as one would only need to increase the rate of return to offset the effect of risk. With a mean score of 2.82, conservative forecast is the second most used technique amongst the respondents. Majority of the respondents (83.9%) have never use utility theory for risk adjustment technique before. No one used it frequently which suggests that this is a very unpopular technique.
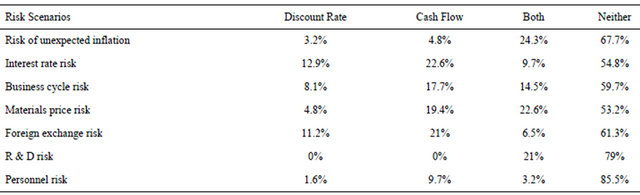
Respondents were asked when evaluating a project, did they adjust the discount rate or cash flows or both for certain risk factors. The results are given in Table 15.
From Table 15, it is observed that 67.7% of the respondents did not do anything in the face of risk of unexpected inflation. 3.2% adjusted their discount rate while 4.8% adjusted their cash flows. 24.3% chose to adjust both the discount rate and cash flows. This would suggest that either most of the respondents did not know what to do in a situation like this or that they did not see a need for any action.
5. Conclusions and Recommendations
The results indicate that even though the Payback period is still ever present in the evaluation of capital investments for small companies, it is encouraging to find that
Table 13. Use of risk analysis techniques.
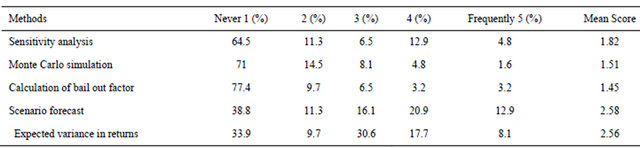
Table 14. Frequency of use of methods for risk adjustment.
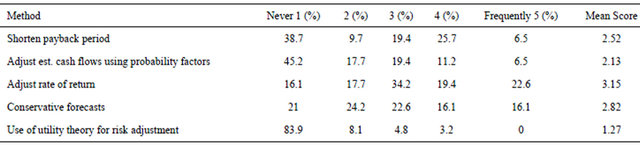
Table 15. Choice of measures when faced with risk scenarios.
more sophisticated techniques like the NPV and IRR are being utilized to aid them in the capital budgeting process. It is recommended that small companies continue to focus on utilizing such sophisticated techniques that maximises the wealth of owners instead of succumbing to the financial pressure put on them by financial institutions.
Project estimation and cash flow estimation was found to be the most important aspect of thew capital budgeting process. It is followed by financial analysis and project selection then project implementation and finally project review. Project evaluation is actually an integral part of the complete manufacturing strategy. Every investment or project should be followed up to determine that effectiveness of the decisions made in earlier stages of the capital budgeting process. It is further confirmed that project evaluation is not critical to those surveyed when a large number of them indicated that they did not perform postaudits on capital investment. So it is recommended that more attention should be paid onto project evaluation as not every capital investment is properly analysed and small companies are more susceptible to these possible mistakes made as they do not have the financial muscle to recover.
It was found that financial flexibility was a major factor in determining what level of debt the companies maintained. Other major factors included the volatility of earnings and cash flows, transaction cost for incurring debt and the potential cost of bankruptcy. It is hence not advisable to have such a high level of debt based on the above factors plus with the present economic climate, those factors would have a higher chance of occurring.
Uses of risk analysis techniques were found to be a minimum. Scenario forecast was the most widely used method, followed by measuring expected variance in returns. Complex techniques like Monte Carlo Simulation, Sensitivity Analysis and Calculation of bailout Factor are rarely used. It is hence recommended to integrate these risk analysis techniques into their capital budgeting process in light of the global economic and social instability.
6. Acknowledgements
This is an extended version of a paper that was published in the proceedings of 7th Asia Pacific Industrial Engineering and Management System Conference.
REFERENCES
- P. P. Peterson, “Capital Budgeting Techniques: Part 1,” 2001. http://garnet.acns.fsu.edu/ppeters/fin3403/readings/capbud/capbud1.htm
- P. Chadwell-Hatfield, B. Goitein, P. Horvath and A. Webster, “Financial Criteria, Capital Budgeting Techniques, and Risk Analysis of Manufacturing Firms,” Journal of Applied Business Research, Vol. 13, No. 1, 1993, p. 95.
- S. Block, “Capital Budgeting Techniques Used by Small Business Firms in the 1990s,” The Engineering Economist, Vol. 42, No. 4, 1997, pp. 289-302.
- D. A. Evans and S. M. Forbes, “Decision Making and Display Methods: The Case of Prescription and Practice in Capital Budgeting,” Engineering Economist, Vol. 39, No. 1, 1993, pp. 87-92
- E. J. Farragher, R. T. Kleiman and A. P. Sahu, “Current Capital Investment Practices,” The Engineering Economist, Vol. 44, No. 2, 1999, pp. 137-148.
- T. K. Mukherjee and G. V. Henderson, “The Capital Budgeting Process: Theory and practices,” Interfaces, Vol. 17, No. 2, 1987, pp. 78-80.
- L. J. Gitman and P. A. Vanderberg, “Cost of Capital Techniques Used by Major US Firms: 1997 vs 1980,” Financial Practice and Education, Vol. 10, No. 2, 2000, pp. 53-68.
- L. Gitman and J. Forrester, “A Survey of Capital Budgeting Techniques Used by Major US Firms,” Financial Management, Vol. 6, No. 3, 1977, pp. 66-71.
- D. Scott, and W. Petty, “Capital Budgeting Practices in Large American Firms: A Retrospective Analysis and Synthesis,” Financial Review, Vol. 19, No. 1, 1984, pp. 111-122.