Journal of Biomedical Science and Engineering
Vol. 5 No. 9 (2012) , Article ID: 22421 , 8 pages DOI:10.4236/jbise.2012.59065
Fetal distress prediction using discriminant analysis, decision tree, and artificial neural network
![]()
Department of Industrial Engineering & Management, National Chin-Yi University of Technology, Taichung, Chinese Taipei
Email: *huangml@ncut.edu.tw
Received 1 June 2012; revised 5 July 2012; accepted 15 July 2012
Keywords: Fetal Distress; Cardiotocography (CTG); Discriminant Analysis; Decision Tree; Artificial Neural Network
ABSTRACT
Fetal distress is one of the main factors to cesarean section in obstetrics and gynecology. If the fetus lack of oxygen in uterus, threat to the fetal health and fetal death could happen. Cardiotocography (CTG) is the most widely used technique to monitor the fetal health and fetal heart rate (FHR) is an important index to identify occurs of fetal distress. This study is to propose discriminant analysis (DA), decision tree (DT), and artificial neural network (ANN) to evaluate fetal distress. The results show that the accuracies of DA, DT and ANN are 82.1%, 86.36% and 97.78%, respectively.
1. INTRODUCTION
Data mining is the key core of knowledge discovery in database. Through retrieving hidden, previously unknown, credible, innovative, or effective knowledge from large dataset, data mining is powerful on realization, analysis and prediction of the unknown phenomena [1].
With the advances in medical technology, clinical difficult exists for doctors to diagnose diseases when facing the tremendous amounts of disease inspection reports generating from the latest medical examination equipment. Data mining has successfully assisted medical diagnosis in the past a few years to prevent misdiagnosis.
Caesarean section is one of the common surgical procedures in the obstetrics and gynecology. In Taiwan, the proportion of caesarean section has increased year by year. The reasonable explanation is the parents’ belief on fortunate birth timing. Regardless of parents’ belief, caesarean section must be taken when abnormal fetal position, fetal distress, or other emergency situation occurs. Fetal distress denotes the possibility of fetal hypoxia and/or metabolic acidosis [2]. It is usually a complication of the labor [3]. Adequate fetal oxygenation is essential for a healthy neonate [4], and efficient and effective diagnosis on fetal distress is an important issue.
The cardiotocography (CTG) and fetal scalp blood sampling (FBS) are commonly used on monitoring fetal distress [1]. CTG provides fetal development and health information, especially the maturation status of autonomous nervous system. The change of fetal heart rate (FHR) represents the response to external stimuli. In general, average of FHR, change of FHR, acceleration and deceleration of FHR, and fetal movement are essential parameters on medical diagnosis of fetal distress [5].
This study aims to predict the occurrence of fetal distress by applying data mining technique to establish classification models.
Discriminant analysis (DA) is to predict group membership for newly sampled data based upon a group of observations, whose memberships are already identified. The discriminant function is to minimize their group misclassifications [6]. Polat et al. [7] used generalized discriminant analysis and least square support vector machine on diagnosis of diabetes disease. Multivariate discriminant analysis was applied to build a predictive model and perform tissue-type classifications [8].
Decision tree (DT) is an approach to build a classification model and a tree-shaped structure was produced using inductive reasoning. Decision tree is highly suitable for conducting medical predictions and data analysis explanations [9]. One example is the application of contingent valuation and decision tree to investigate public preferences on water quality improvements by Atkins et al. [10]. And classification and regression trees (CART) algorithm is examined to classify hyper-spectral data of experimental corn plots into different categories of water stress, presence of weeds and nitrogen application rates by Waheed et al. [11].
The basic concept of artificial neural network (ANN) is that computer can imitate human nervous system and function like human thinking to solve problems. Kohonen [12] defined ANN are massively parallel interconnected networks of simple elements and their hierarchical organizations which are intended to interact with the objects of the real world in the same way as biological nervous systems do. Lin et al. [13] developed regression and artificial neural network models to predict the outcome of surgical treatment in older patients with hip fracture. Chang and Chen [9] combining decision tree with artificial neural network to construct the best predictive classification model on diagnosis of dermatology.
Due to fetal distress causing severe sequela on fetus, the purpose of this study is to establish classification models and compare accuracies among models to help obstetricians on diagnosis of fetal distress.
The rest of sections of this paper are organized as follows. Section 2 introduces the database and methods. Section 3 shows the analytic results of proposed models. In Section 4, we discuss the results and compare the results with other research and explain the limitations of our study.
2. MATERIAL AND METHODS
2.1. Data
The Cardiotocography data set used in this study is from UCI Machine Learning Repository [14]. It contains the Fetal Heart Rate, measurements from Cardiotocography, and the diagnosis group classified by gynecologist. There are 21 attributes, including 11 continuous, 9 discrete and 1 nominal scales. The number of observations is 2126 cases in total, including 1655 normal cases, 295 suspects, and 176 fetal distress cases. Tables 1 and 2 display the details for the dataset.
2.2. Methods
The methods used in this study including multiple group discriminant analysis, decision tree, and back propagation artificial neural network. Combinations of different number of neurons and different transfer functions were executed for artificial neural network. The dataset contains no missing values, and all the continuous attributes were used as the input for three analytic models. While attributes with high correlation were deleted from the original input dataset, the final input dataset includes attribute number 8, 9, 10, 11, 12, 13, 17, 18, 19 and 20 in Table 1. Figure 1 shows the study scheme for this study.
2.3. Discriminant Analysis (DA)
Discriminant analysis comes to understand the difference between/among groups with respect to the combination
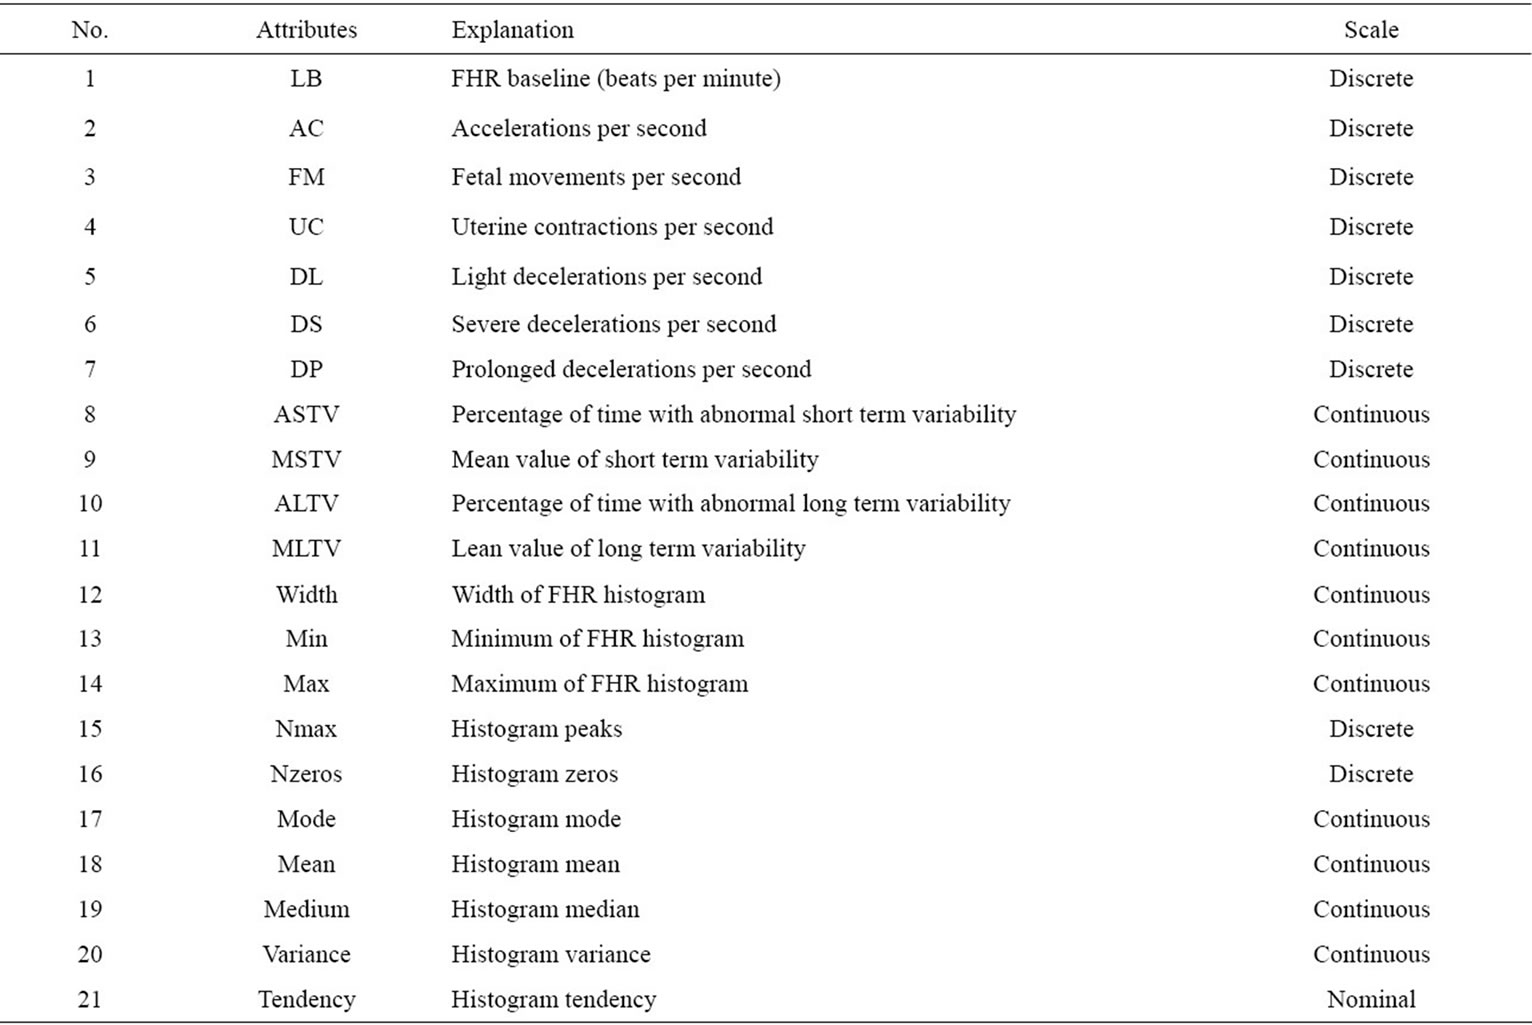
Table 1. Description of fetal distress dataset.
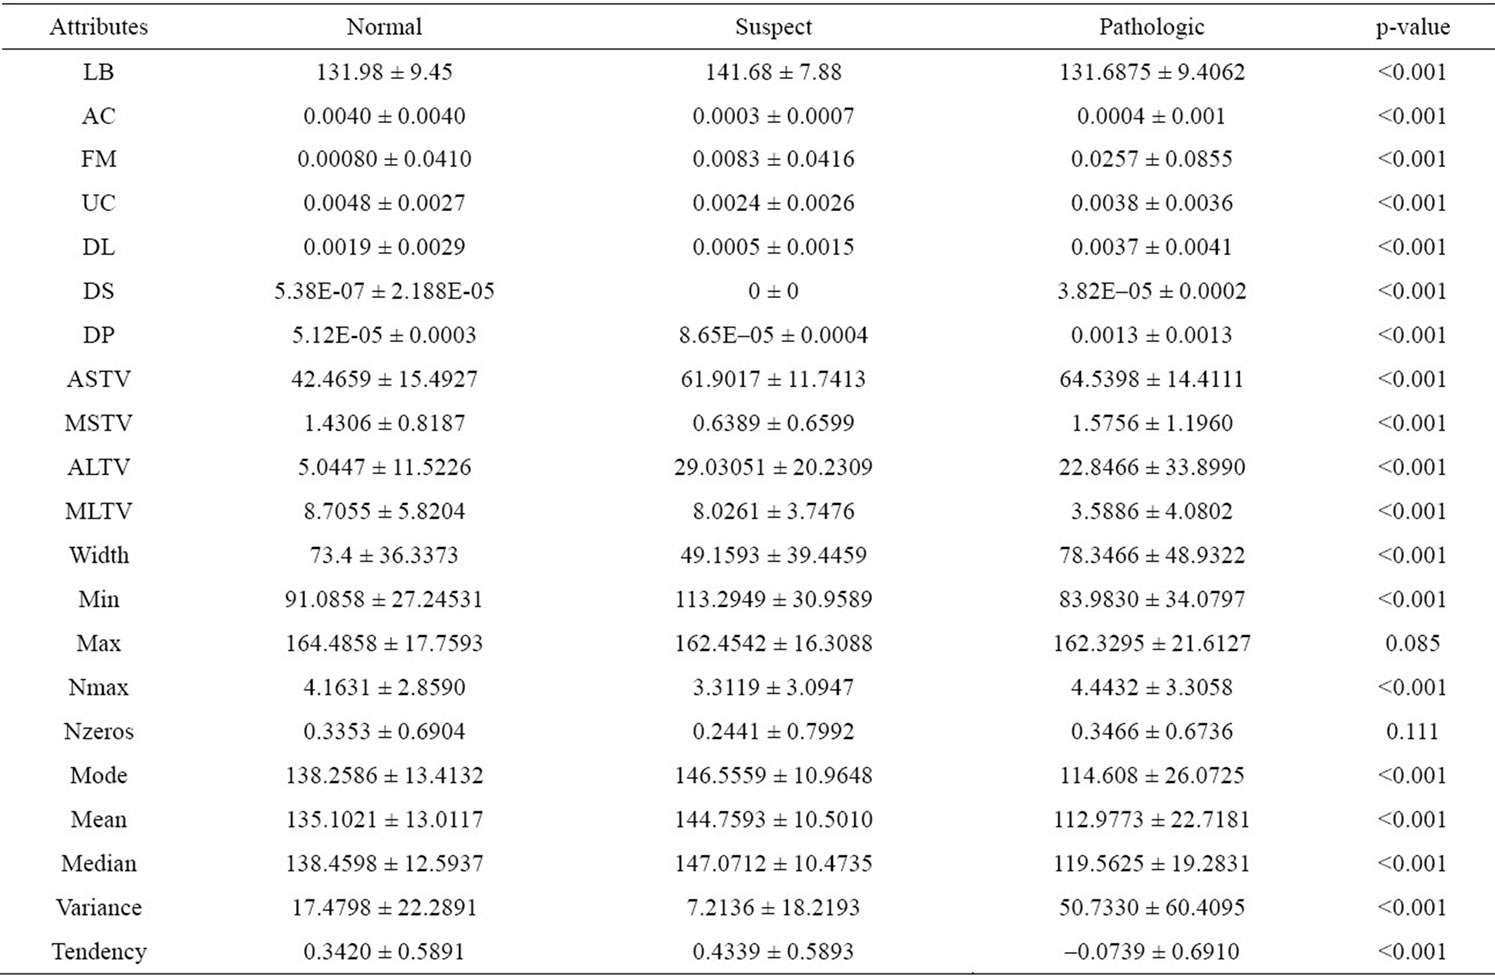
Table 2. ANOVA for data attributes.
of valuable attributes which best explains the data. Identifying the best set of attributes with significantly statistical differences between/among groups is the first step of discriminant analysis. The combination of attributes is used to form the discriminant function to separate groups of observations into predefined groups. It can be further applied to predict the associated group for new observations.
The idea underlying this classification method is to develop a linear combination, F, of n variables as F = β1x1 + β2x2 + ··· + βnxn with values for β1, β2, ···, βn chosen to maximize the difference between groups and to minimize the difference within groups. This widely used nonparametric statistical method is based on a projection of the multidimensional feature vector x onto an optimal chosen vector w (y = wTx) to maximize the ratio of between-class scatter to within-class scatter. Detailed descriptions of the statistical procedures involved in the assessment and use of a DA model can be found in the literature [15].
2.4. Decision Tree (DT)
Decision tree consists of root, decision nodes, branch nodes, and leaf nodes. It begins with the root, and each branch is a new decision node or a new leaf node of the tree. Each decision node represents a decision with respect to the attribute of classification observation. And each leaf node reflects one possible classification result.
The attribute with maximum information is chosen to develop the next node based upon the information gain from information theory. And the specific value for this attribute is determined to set up the branch. Continue this step to develop the decision tree until satisfying the predetermined stopping criteria. The following steps describe the details of building the decision tree:
Step 1: Split the whole dataset into training and testing sets.
Step 2: Use the training set as the input for tree root.
Step 3: Grow the tree by selecting one best attribute base upon the information gain theory for each node.
Step 4: Prune the grown tree by using the testing set until each node has only one node.
Step 5: repeat step 1 to 4 until all the nodes are leaf nodes.
2.5. Artificial Neural Network (ANN)
The artificial neural network is derived from imitating the picture of human neural system. ANN consists of many nonlinear neurons and the linkages communicating the neurons in the system. The neurons perform numer-
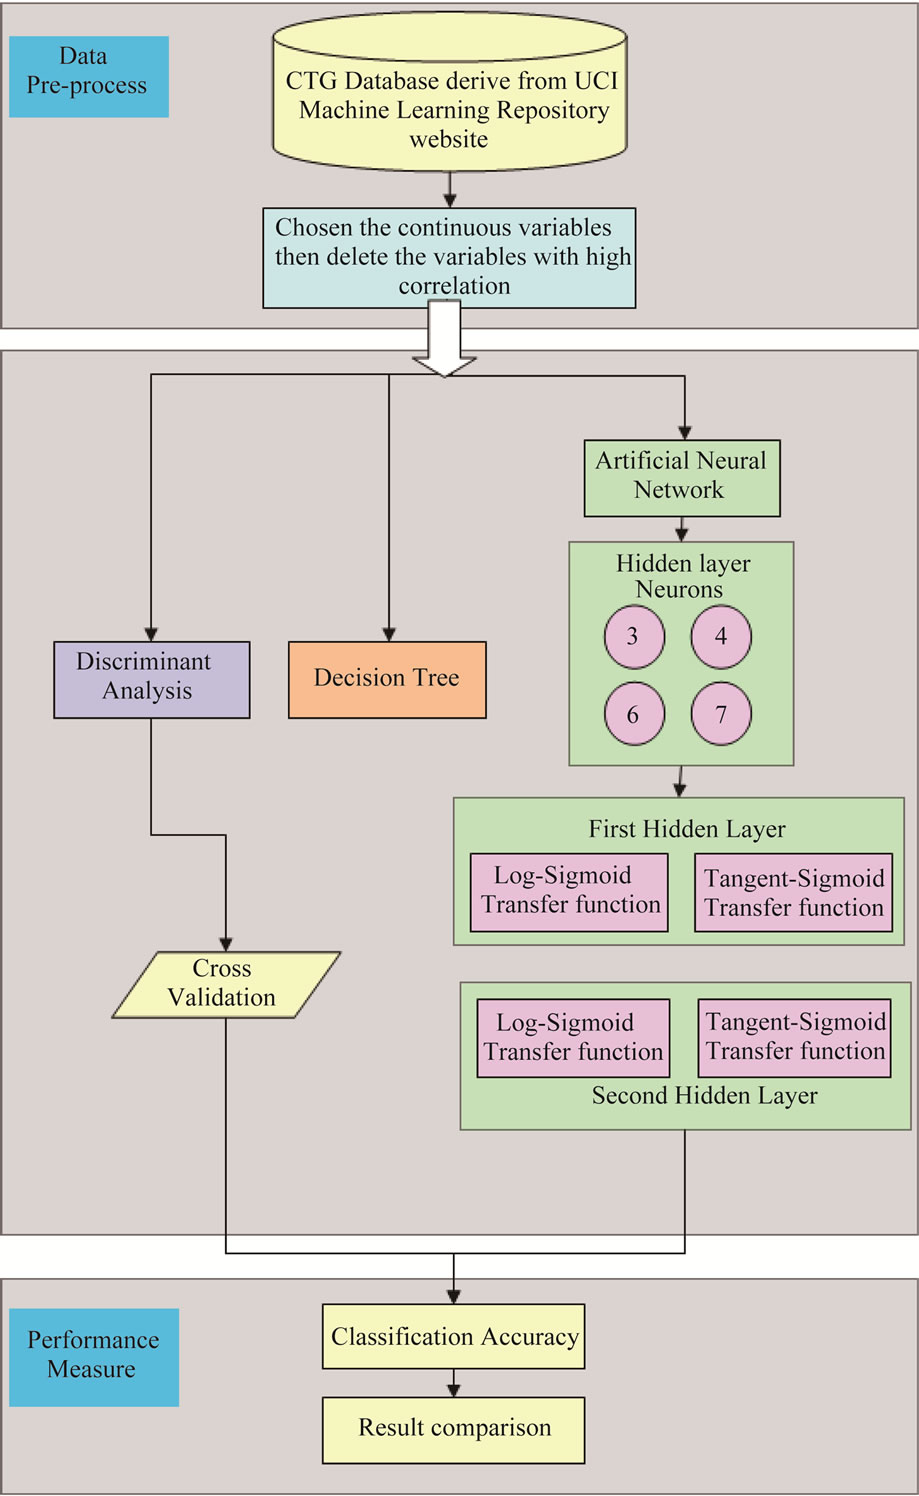
Figure 1. Flow chart of this study.
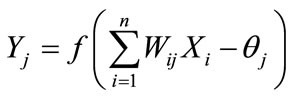
ous operations simultaneously. And the operation results are treated as the input for other neurons. The relationship between input and the output can be expressed as below:
 (4)
(4)
where Xi is the input of imitating neurons, Yj is the output of imitating neurons, f is the transfer function dealing with the transformation, which is the sum of weighted products from input neurons, Wij is the strength of the linkage between neurons, and  is the threshold value.
2.6. Back Propagation Neural Network (BPNN)
Back propagation neural network is a multilayer perceptron (MLP) and the generally used learning algorithm is error back propagation. This combination is called as back propagation neural network, which is one of the most commonly applied neural networks. One weight is determined for each attribute, and the transformation of sum of the weighted attributes are treated as the input of next neuron. An ANN consists of one input layer, one output layer, and one or more hidden layers that extract essential information during learning. The parameters are adjusted iteratively with a supervised learning process during which the network learns to associate input vectors with the appropriate pattern class. The gradient steepest descent algorithm with back-propagation of error and a momentum term were used during training in this study. Figure 2 displays a standard BPNN, consisting of the following layers:
1) Input Layer: represent the input of network, and the number of neurons depends on the associated problems.
2) Hidden Layer: represent the interaction of input units. There is no standard to determine the number of neurons, and the most commonly used method is try and error. The number of hidden layer could be zero, one, or more than one.
3) Output Layer: represent the output of the network, and the number of neurons depends on the associated problems.
Matlab7.6 software was used for BPNN model in this study. Two hidden layers with Log-sigmoid transfer function and Tangent-sigmoid transfer function were used in this study. There is no standard guide line for setting the number of neurons for hidden layers. Although the more neurons, the less error, the error could not be further reduced after reaching some certain number of neurons. Table 3 displays suggestions for determining the number of neurons from the related research, where ni denotes the number of neurons for input layer; ni denotes the number of neurons for output layer.
The transfer function is to convert the aggregation of input information to allow the output values locate within a reasonable range. Log-sigmoid transfer function and Tangent-sigmoid transfer function are commonly used for MLP and the output values rang 0 and 1, –1 and 1, respectively. Figures 3 and 4 show the transformation for Log-sigmoid transfer function and Tangentsigmoid transfer function.
3. RESULTS AND DISCUSSION
3.1. Discriminant Analysis Result
Minitab 14 was used for discriminant analysis. All dataset was first normalized. Attribute “Max”, marked as high correlation with other attributes, was deleted before analysis. Therefore, the attributes fed in the discriminamt models are attribute number 8, 9, 10, 11, 12, 13, 17, 18, 19 and 20 in Table 1. Table 4 shows the results after cross validation of discriminant analysis. The classification accuracies for normal, suspect and pathologic groups are 0.847, 0.753, and 0.688, respectively. And the overall accuracy is 0.820 Units.
3.2. Decision Tree Result
Answer Tree software was used to develop the decision tree in this study. The whole dataset was split into training and testing sets. 80% of the whole dataset was treated
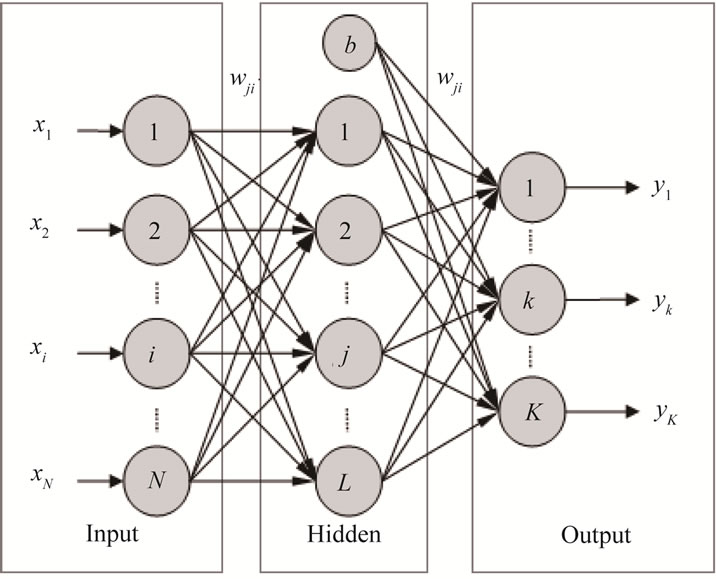
Figure 2. The structure of back propagation neural network.
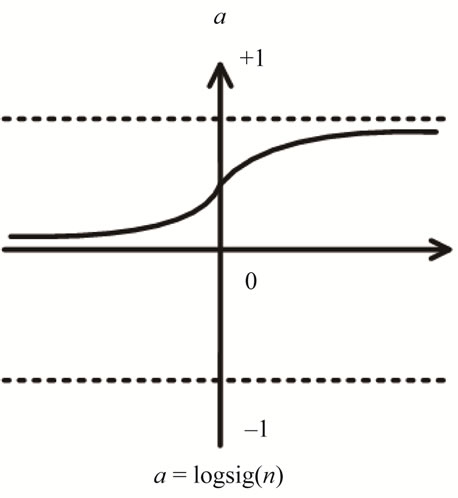
Figure 3. Log-sigmoid transfer function.
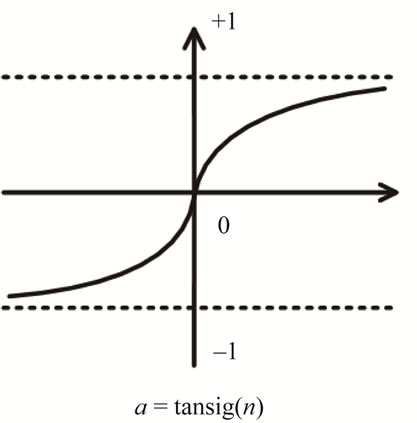
Figure 4. Tangent-sigmoid transfer function.
as training set, and the remaining 20% was used as testing set. Ten-fold cross validation technique was employed to assess how well the tree structure generalized from the data. Table 5 shows the 10-cross validation results and Figure 5 illustrates the decision rules and classification results. The classification accuracies for normal, suspect and pathologic groups are 0.932, 0.681, and
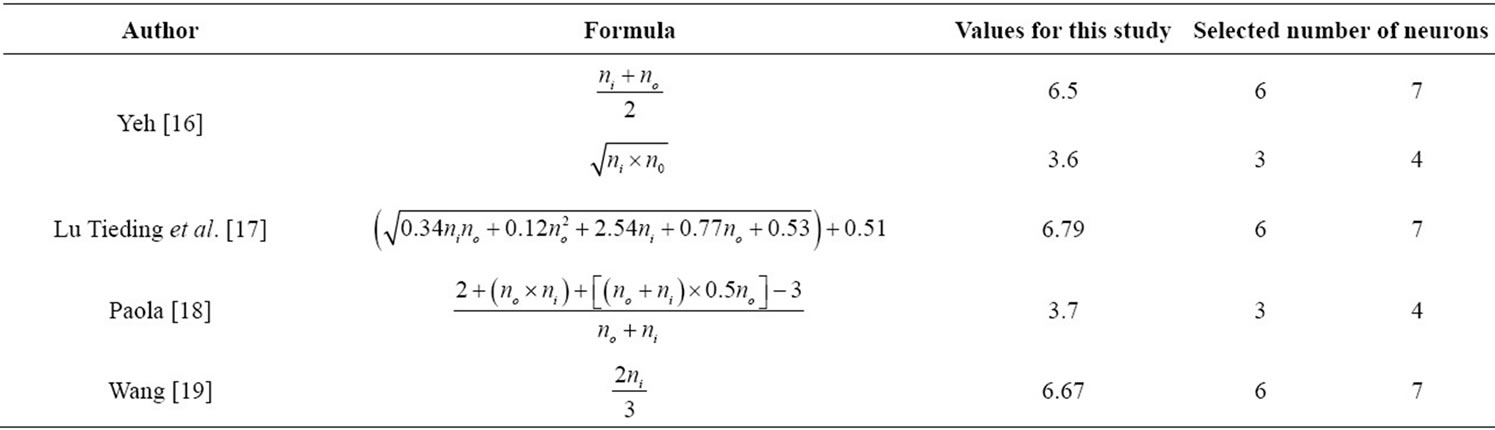
Table 3. Calculation of number of neurons for hidden layer.
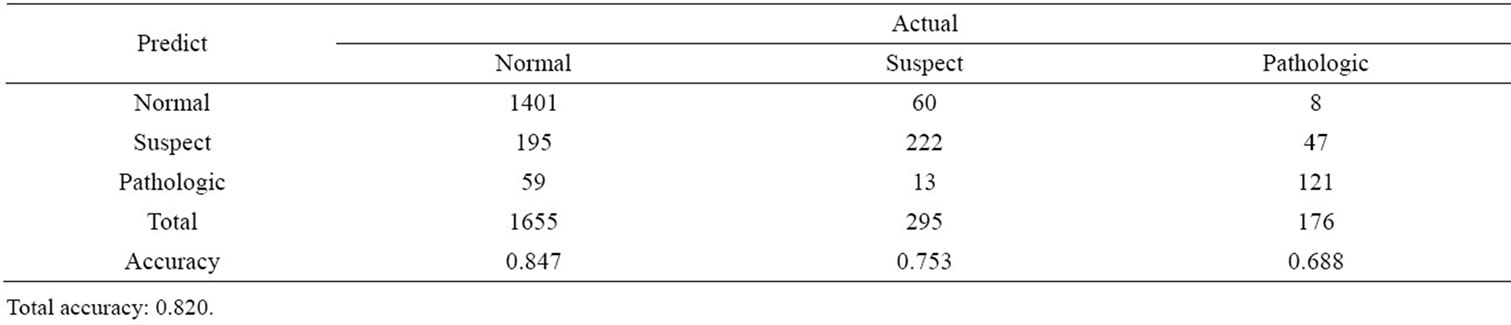
Table 4. Cross-validation results of discriminant analysis.
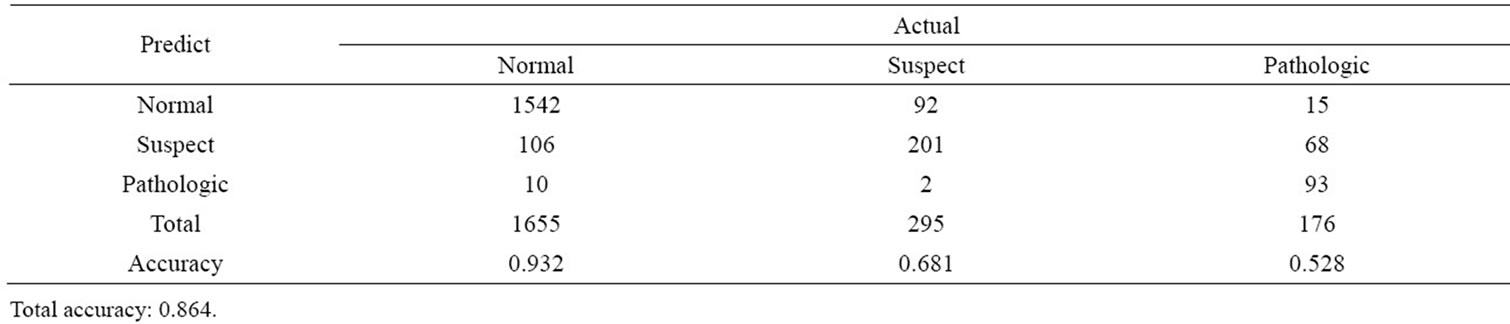
Table 5. Cross-validation results of decision tree.
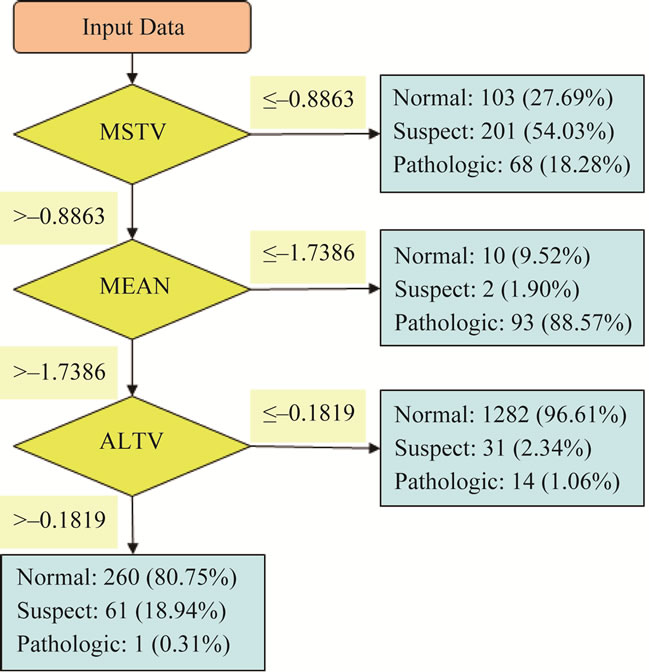
Figure 5. Decision rules and classification results.
0.528, respectively. And the overall accuracy is 0.864. Table 6 and Figure 5 illustrate the decision rules and classification results. From Table 6 and Figure 5, rule number 1 predicts more “suspect” when (MSTV ≤ –0.8863); sample will be classified as “Pathologic” if (MSTV > –0.8863) and (MEAN ≤ –1.7386) based on rule number 2; sample will be classified as “Normal” if (MSTV > –0.8863) and (MEAN > –1.7386) based on rule number 3 and 4. Compared with discriminant analysis and artificial neural network, the advantage of decision tree illustrates precise information that helps for immediate diagnosis of fetal distress.
3.3. Back Propagation Neural Network Result
Matlab7.6 software was applied to build the neuron network. Eighty percent, 10%, and the remaining 10% of the whole dataset were randomly selected as training, testing, and validation sets, respectively. Two hidden
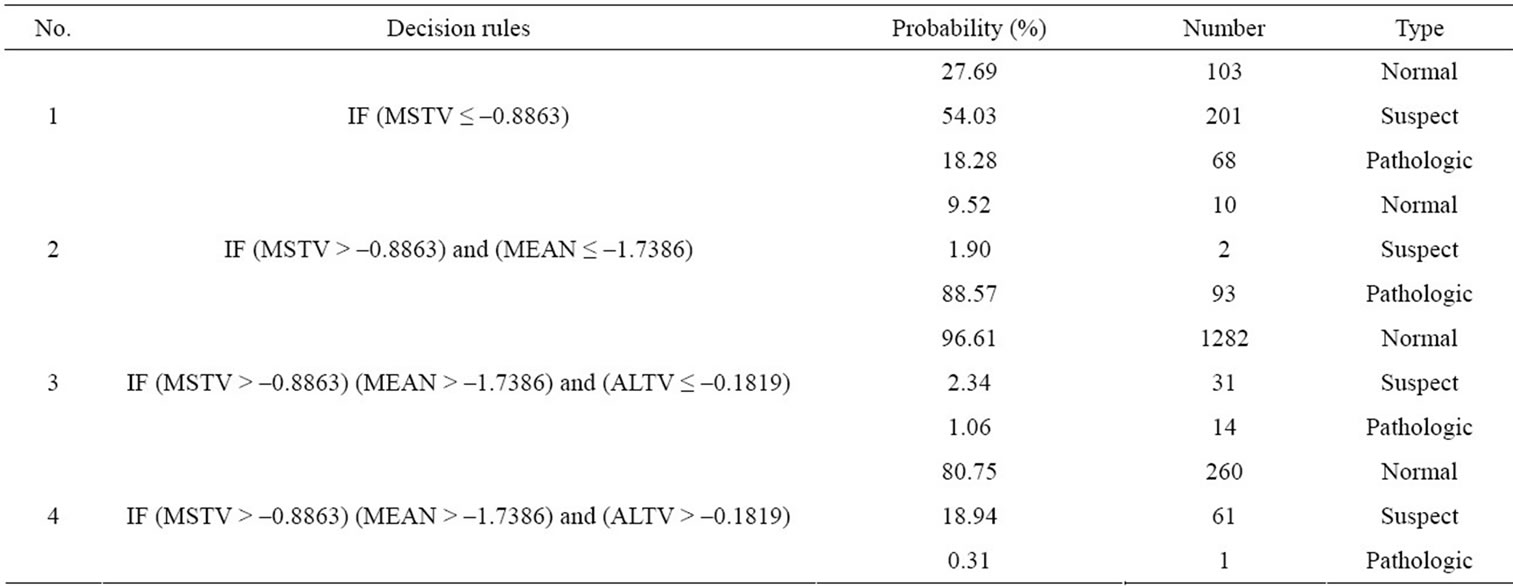
Table 6. Decision rules and classification results.
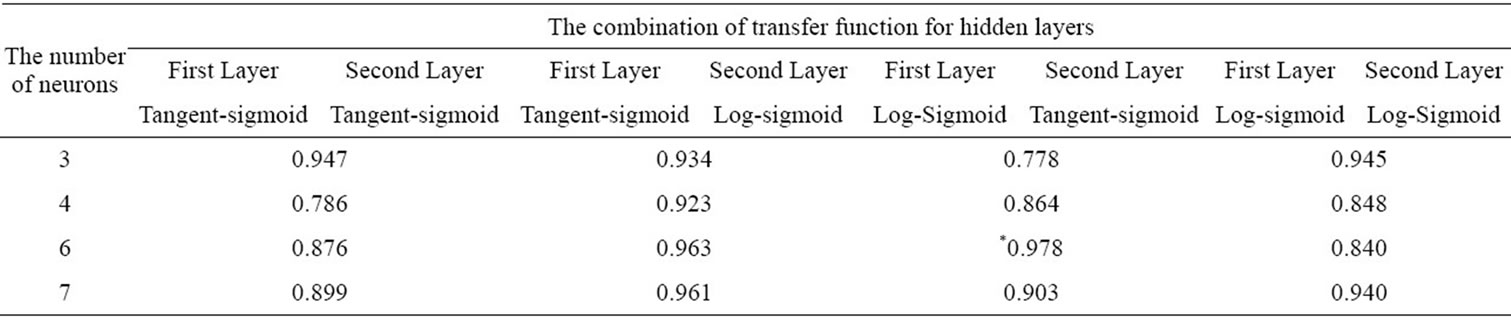
Table 7. Accuracies for ANN with combination of neurons and transfer functions.
layers with neurons number 3, 4, 6, and 7 were executed, and the two transformation functions were Log-Sigmoid and Tangent-sigmoid functions. Table 7 shows the classification results. The highest classification accuracy 0.978 was obtained with 6 neurons in hidden layer, and LogSigmoid and Tangent-sigmoid functions were used in the first and the second layers, respectively.
The classification models we established were applied on CTG database to predict the occurrence of fetal distress. The accuracies obtain from DA and DT models are 0.820 and 0.864, respectively. The highest accuracy in different combination of transfer function in hidden layers of ANN model is 0.978. The results show that the classification accuracy of ANN model is better than DA and DT models.
Yarnguy and Kanarkard [20] use of radial basis function network (RBF) classifier committees trained on different features for improving classification accuracy in CTG diagnosis. The results showed that the committee correct identification was 0.998, which is higher than our study. The disadvantage of unknown data process via RBF classifier still remains in their study. The reason why our results shows lower classification accuracy might be we only use the continuous attributes in our models, the information implicit in discrete attributes perhaps possess valuable information.
4. CONCLUSIONS
This study analyzes Cardiotocography data set from UCI Machine Learning Repository website with discriminant analysis, decision tree, and artificial neural network techniques to create the classification models to predict fetal distress. Similar study with ANN application of the exceptional accuracy 0.988 was done on breast cancer diagnosis [21]. And the other study with the application of decision tree reached 0.801 accuracy was found on glaucoma diagnosis [22]. Although the highest accuracy is derived from the ANN model in this study, but the processes in ANN model just like a “black box”, we couldn’t understand how it works inside. The accuracy derived from the DT model isn’t higher than ANN model, but it shows the concise and effective decision rules to classify the situation of fetus. Those decision rules could support obstetrician determine whether the fetus is suffering fetal distress effectively and efficiently.
This database contains 21 attributes, involving 11 continuous attributes and 10 discrete attributes. Since discrete attribute could not be applied in discriminant model, the continuous attributes were employed in this study. The weakness of the study is the information implicating by the discrete attributes was not considered. The future study will use the classification techniques which can be fit in discrete attributes, e.g. logistic regression and rough set etc. In addition, feature selection technique can also be considered to use in data preprocessing stage. That is, first, extracting the effective attributes, then use the extracted attributes to establish models. It will reduce the analysis time and drop the stored space significantly and the efficiency of data analysis may be highly improved.
![]()
![]()
REFERENCES
- Maimon, O. and Rokach, L. (2005) The Data mining and knowledge discovery handbook. Springer, New York. doi:10.1007/b107408
- Chandraharan, E. and Arulkumaran, S. (2007) Prevention of birth asphyxia: Responding appropriately to cardiotodograph (CTG) traces. Best Practice & Research Clinical Obstetrics and Gynaecology, 21, 609-624. doi:10.1016/j.bpobgyn.2007.02.008
- Lunghi, F., Magenes, G., Pedrinazzi, L. and Signorini, M. G. (2005) Detection of fetal distress though a support vector machine based on fetal heart rate parameters. Computers in Cardiology, 25-28 September 2005, 247-250. doi:10.1109/CIC.2005.1588083
- Vigil-De Gracia, P., Simití, E. and Lora, Y. (2000) Intrapartum fetal distress and magnesium sulfate. International Journal of Gynecology & Obstetrics, 68, 3-6.
- Romano, M., Bracale, M., Cesarelli, M., et al. (2006) Antepartum cardiotocography: A study of fetal reactivity in frequency domain. Computers in Biology and Medicine, 36, 619-633. doi:10.1016/j.compbiomed.2005.04.004
- Sueyoshi, T. (2001) Extend DEA-discriminant analysis. European Journal of Operational Research, 131, 324-351. doi:10.1016/S0377-2217(00)00054-0
- Polat, K., Günes S. and Arslan, A. (2008) A cascade learning system for classification of diabetes disease: Generalized discriminant analysis and least square support vector machine. Expert System with Applications, 34, 482-487. doi:10.1016/j.eswa.2006.09.012
- Piacenti da Sliva, M., Zucchi, O.L.A.D., Ribeiro-Silva, A., et al. (2009) Discriminant analysis of trace elements in normal, benign and malignant breast tissues measured by total reflection X-ray fluorescence. Spectrochimica Acta Part B, 64, 587-592. doi:10.1016/j.sab.2009.05.026
- Chang, C.L. and Chen, C.H. (2009) Applying decision tree and neural network to increase quality of dermatologic diagnosis. Expert Systems with Applications, 36, 4035-4041. doi:10.1016/j.eswa.2008.03.007
- Atkins, J.P., Burdon, D. and Allen, J.H. (2007) An application of contingent valuation and decision tree analysis to water quality improvement. Marine Pollution Bulletin, 55, 591-602. doi:10.1016/j.marpolbul.2007.09.018
- Waheed, T., Bonnell, R.B., Prasher, S.O. and Paulet, E. (2006) Measuring performance in precision agriculture: CART-A decision tree approach. Agricultural Water Management, 84, 173-185. doi:10.1016/j.agwat.2005.12.003
- Kohonen, T. (1988) An introduction to neural computing. Neural Networks, 1, 3-6. doi:10.1016/0893-6080(88)90020-2
- Lin, C.C., Ou, Y.K., Chen, S.H., et al. (2010) Comparison of artificial neural network and logistic regression models for predicting mortality in elderly patients with hip fracture. International Journal of the Care of the Injured, 41, 869-873.
- Frank, A. and Asuncion, A. (2010) UCI Machine Learning Repository. University of California, School of Information and Computer Science. Irvine. http://archive.ics.uci.edu/ ml
- Kleinbaum, D.G., Kupper, L.L. and Muller, K.E. (1998) Applied regression analysis and other multivariate methods. 2nd Edition, PSW-Kent, Boston.
- Yeh, Y.C. (2003) Application and practice of artificial neural network. Scholar Books Co., Ltd., Taipei.
- Lu, T., Chen, X. and Zhou, S. (2010) Optimization for impact factors of dam deformation based on BP neural network model. International Conference on Intelligent Computation Technology and Automation, Changsha, 11- 12 May 2010, 854-857.
- Paola, J.D. (1994) Neural network classification of multispectral imagery. Master’s Thesis, University of Arizona, Tucson.
- Wang, C. (1994) A theory of generalization in learning machine with neural application. Ph.D. Thesis, University of Pennsylvania, Philadelphia.
- Yarnguy, T. and Kanarkard, W. (2011) A radial basis function committee machine for cardiotocography classification. The 12th Graduate Research Conference, Khon Kaen University, Khon Kaen, 262-267.
- Huang, M.L., Hung, Y.H. and Chen, W.Y. (2010) Neural network classifier with entropy based feature selection on breast cancer diagnosis. Journal of Medical Systems, 34, 865-873. doi:10.1007/s10916-009-9301-x
- Huang, M.L. and Chen, H.Y. (2011) Glaucoma classification model based on GDx VCC measured parameter by decision tree. Journal of Medical Systems, 34, 1141-1147. doi:10.1007/s10916-009-9333-2
NOTES
*Corresponding author.