Intelligent Information Management
Vol.2 No.7(2010), Article ID:2217,10 pages DOI:10.4236/iim.2010.27052
Predicting ERP User Satisfaction―an Adaptive Neuro Fuzzy Inference System (ANFIS) Approach
1Faculty of Management Studies, Anna University, Chennai, India
2Department of Industrial Engineering, Anna University, Chennai, India
E-mail: {cvenugopal, prasannasiva11}@gmail.com, ksprao@annauniv.edu
Received April 7, 2010; revised May 12, 2010; accepted June 21, 2010
Keywords: ANFIS, ERP Implementation outcome, Prediction, Failure Detection, CSFs, Causal Factors
Abstract
ERP projects’ failing to meet user expectations is a serious problem. This research develops an Adaptive Neuro Fuzzy Inference System (ANFIS) model, to predict the key ERP outcome “User Satisfaction” using causal factors present during an implementation as predictors. Data for training and testing the models was from a cross section of firms that had implemented ERPs. ANFIS is compared with other prediction techniques, ANN and MLRA. The results establish that ANFIS is able to predict outcome well with an error (RMSE) of 0.277 and outperforms ANN and MLRA with errors of 0.85 and 0.86 respectively. This study is expected to provide guidelines to managers and academia to predict ERP outcomes ex ante, and thereby enable corrective actions to redirect ailing projects.
1. Introduction
The track record of successful IT projects of which Enterprise Resource Planning (ERP) is a subset projects remains poor. The latest CHAOS study of the Standish Group reports a marked decrease in IT project success rates, with only 32% succeeding in “on time” and “on budget” delivery with required features and functions. 44% were delivered late or over budget, and/or with less than the required features and functions. 24% were cancelled prior to completion or delivered and never used [1]. This is worse than the figures of about decade back as observed by Robey in 2002: “About half of ERP projects fail to achieve anticipated benefits” [2].
Information systems (IS) project failures often encounter project “escalation” defined as a continued commitment to a failing course of action despite “uncertainty surrounding the likelihood of goal attainment” [3]. Escalation research lists issues that cause escalation and suggests strategies for de-escalation which includes abandoning or “redirecting” the project [4,5]. While these are acceptable as reactive steps a proactive approach of predicting impending failures, would be invaluable as one could then attempt to forestall or at least redirect the project far better.
The essence of proactive control is having predictive capabilities. The challenge is to move from the diagnosis of the source of past problems to the prediction and forecasting of potential problems in new projects [6]. Can a robust, easy to use and reliable predictor be developed that would “red flag” impending failures in ERP implementations? This is the research question we seek to answer in this paper. This research has developed a method of predicting User Satisfaction, a key measure of ERP project success using ex ante causal factors as predictors.
This study consolidates and extends an earlier study which gathered data from a cross section of business organizations that had implemented ERP systems in the last three years and developed and tested a measurement model for causal factors for success [7]. Data was collected, using a structured questionnaire, on Critical Success Factors (CSFs), identified in literature as being causal for the success of an ERP implementation [8] and overall User Satisfaction , a key indicator of the success [9,10]. Respondents to our questionnaire represented different user cohorts: Strategic Users, Technical Users and Operational Users. The validity and reliability of the measurement model and its innate value as a predictor of ERP success was established using Structural Equation Modeling (SEM) with LISREL 8.7.
In the present study the data from the earlier study was used to develop predictive models for ERP implementation outcomes measured in terms of User Satisfaction. Three prediction techniques, Multiple Linear Regression Analysis (MLRA), Artificial Neural Networks (ANN) and Adaptive Neuro Fuzzy Inference System (ANFIS) were tested. Of the three ANFIS was found to be significantly better in predicting User Satisfaction of an ERP project.
This paper is organized as follows: Section 2 presents the literature review and establishes the need and relevance of this research work. Section 3 outlines the method used in the research. This section also explains different prediction techniques with specific emphasis on ANFIS. Section 4 presents the results of the modeling and compares the results of the various techniques used. Section 5 concludes the paper with the direction for continuing research.
2. Literature Review
We looked at the several studies on the Critical Success Factors (CSFs) of an ERP implementation. CSFs can best be defined in the words of Somers and Nelson [8] as “key players and activities...playing a pivotal role in (determining) an organization’s experience with the ERP implementation”. By their very definition then, CSFs should be good predictors or causal factors as key determinants of outcome―“the organization’s experience” or User Satisfaction. In this study, therefore, we have used CSFs and Causal Factors interchangeably.
One of the earliest researchers on CSFs, Davenport [11] identifies six factors mostly relating to the directional or strategic aspects of an ERP project. These include factors related to top management support, use of a cross functional steering committee, communication, cross functional implementation teams etc.
Parr and Shanks [12] focus on the process management aspects of an implementation. The key factors identified include management support, an organizational commitment to change and appropriate definition of scope. Hong and Kim [13] stress on the organization preparedness aspects of the implementation namely organizational fit, system adaptation levels, resistance to change, etc.
Somers and Nelson [8] work considered the most comprehensive [14] identifies a set of 22 CSFs. They used the Cooper and Zmud’s [15] six stage model of IT implementation to track the importance of different factors across the six stages of: initiation, adoption, adaptation, acceptance, routinization & infusion.
CSFs have been listed extensively but not too many attempts are evident to group and measure CSFs present in an implementation. Attempts at grouping in literature are: Parr et al. who suggested into four categories [12]: 1) Management 2) Software 3) Project & 4) People. Wixom and Watson [16] suggest three groups: Organizational, Project & Technical. Holland and Light [17] two groups: Strategic & Tactical.
The other research gap we found is the lack of studies that systematically addressed the issue of ERP project risk detection. In his doctoral desertaion Marbach [18] suggests the following nomological network to categorise IT risk literature: describe, identifiy, detect, assess & address. While there has been a fair amount of work relating to the first two, not too much work is evident in the areas of detect and assess and much less in the area of address. These areas seem to be dominated by practitioner approaches and case studies with not too many empirical studies. Finally, we could not find research that combined empirical data with a dynamic modeling approach which would address both issues of detection and assessing and provide through simulation, a means to address the third―“addressing the risk”.
In addition, there have been several studies over the last two and a half decades on measuring IS success with one of the earliest studies being the work of Davis [19] who cites “Lack of user acceptance” as the main impediment of success. Other researchers who studied enterprise systems success and corrective measures include Markus and Tannis [20], Shang and Seddon [21] and Myers et al. [22]. The often cited work on IS systems success of DeLone and McLean [9,10] posit six major dimensions of Information success and identify User Satisfaction as “probably the most widely used single measure of I/S success” [9]. In conclusion, study of literature establishes the validity of causal factors in impacting I/S project success and confirms the use of overall user satisfaction as a good and acceptable omnibus measure for determining success or failure of an I/S implementation project.
3. The Method
The conceptual model underlying the present study is given in Figure 1.

Figure 1. Conceptual model.
Through an earlier empirical study [7], data was collected from a cross section of around 60 organizations and 156 respondents representing three user cohorts: Strategic, Technical & Operational responded to a pretested and validated (for content validity) structured questionnaire. Respondents rated the CSFs present in their organizations during ERP implementation. The CSFs list used for this research was drawn from prior research, and confirmed by an expert panel as relevant for the current context. The CSFs were also validated as relevant as per Structuration, Expectations-Confirmation, Lewins Change and Agency theories. Responses were captured on a Likert scale with end values of 5 = Completely Agree and 1 = Completely Disagree. From the same set of respondents their overall satisfaction, a measure of Success of the ERP project was also captured on a seven point Likert Scale with end values of 7 = Completely Satisfied and 1 = Completely Dissatisfied.
The data collected was checked and 142 responses were found to be complete and used for further analysis. Exploratory Factor Analysis (EFA) with SPSS 7.0 using Principle Component Analysis and Varimax rotation, revealed the presence of three distinct constructs, that logically mapped to Process Factors, Strategic Factors, and Vendor (related) factors. Confirmatory Factor Analysis (CFA) using Structural Equation Modeling (SEM) using LISREL 8.7 confirmed the construct validity, and discriminant validity of the constructs in addition to confirming good overall model fit. Table 1 gives the complete set of measures and the constructs that they map to.
Scale reliability tests were conducted―Table 2. High factor loadings in excess of 0.7 and high Croanbach Alpha values in excess of 0.8 confirmed the additivity of the measures [23]. This allowed for the creation of summated factors scores using the Bartlet method which was found to give better reliability when compared to the Andersen―Rubin method. These factors scores for Strategic, Process and Vendor factors were used as the predictors and User Satisfaction as the dependent variable.
The overall dataset consisted of 142 responses. This was used for the model building and testing exercise. A sample of the data set showing the independent variables as well as the dependent variable for the model is given in Table 3.

Table 1. Construct and measures.

Table 2. Scale reliability test.
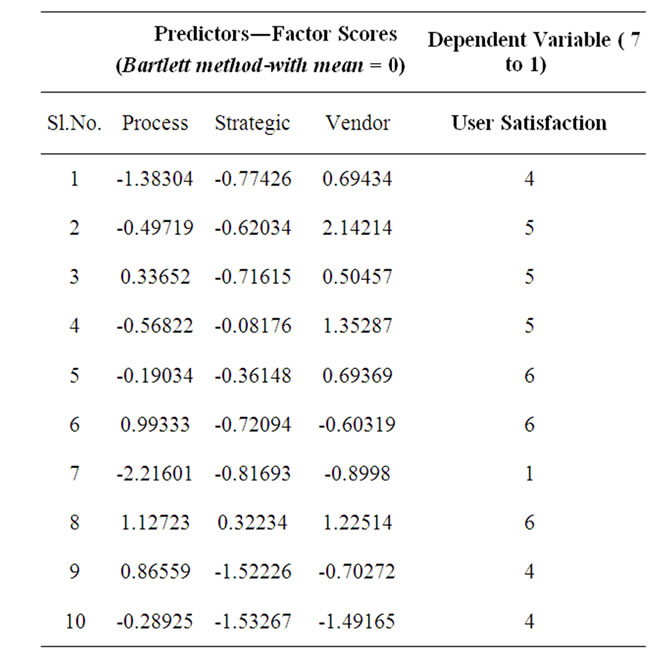
Table 3. Sample dataset―training and test.
4. Modeling―Results and Discussions
Three different prediction techniques were used: 1) Mutiple Linear Regression Analysis (MLRA), 2) Artificial Neural Networks (ANN) and 3) Adaptive Neuro-Fuzzy Inference System (ANFIS). In all cases about 70% of the data was used to build/train the model. The balance 30% of the data was used for testing the model. Each of these is discussed in the following paragraphs.
4.1. Multiple Linear Regression Analysis (MLRA)
Linear least squares regression analysis is still the most common technique used, as observed in the literature [24]. Being a pure statistical technique MLRA has a few important underlying assumptions. These are 1) “linearity”―the assumption that the predictor variable is linearly related to the dependent variable, 2) no “multicolloinearity”―the individual predictors are not correlated to each other, 3) no “heteroscadacity”―the error variances of the predictor variables are constant across the range of data. These conditions make the use of MLRA restrictive especially when modeling issues related to human jugdement where multicollinearity and heteroscadacity are sometimes unavoidable [25]. However, despite its limitations MLRA is an established technique and this study compares the results of MLRA with results obtained from other prediction techniques.
4.2. Artificial Neural Networks (ANN)
The most common model-building technique identified in the literature as an alternative to MLRA is backpropagation trained feed-forward neural networks [24] often referred to simply as back-propagation networks. ANNs are complex and flexible nonlinear systems with the ability to deal with noisy or incomplete input patterns, high fault tolerance, and the ability to generalize from the input data. [26]
Neural networks excel at applications where pattern recognition is important, and precise computational answers are not required [24]. ANN works on the principle of an adaptive learning algorithm and uses an information processing system composed of a large number of interconnected processing elements (neurons) working in tandem.
Neural networks are made of basic units arranged in layers. A unit collects information provided by other units (or by the external world) to which it is connected with weighted connections called synapses. These weights, called synaptic weights multiply (i.e., amplify or attenuate) the input information. A positive weight is considered excitatory, a negative weight inhibitory. One of the most popular architectures in neural networks is the multi-layer perceptron which is illustrated in Figure 2.
Learning happens through a methodology of continuously altering the weights to achieve closer and closer values to the desired outputs. One algorithm that performs this is known as the back propogation algorithm. The back propagation algorithm is a generalization of the
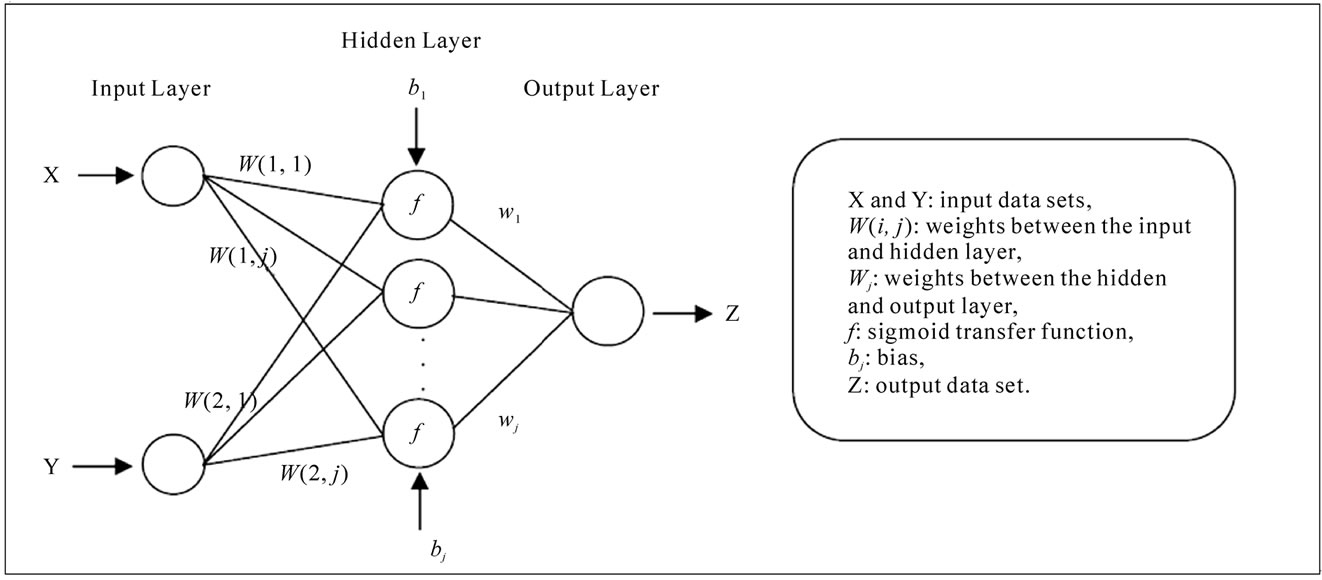
Figure 2. ANN-multilayered perceptron.
least mean square algorithm. The network weights are modified to minimize the mean squared error between the desired and actual outputs of the network. The network is trained using a training data set where the input and output values are known. After the training is completed, the weights are frozen and the model can be used for prediction of outputs for new sets of input values.
4.3. Adaptive Neuro-Fuzzy Inference Systems (ANFIS)
While ANN is a good technique that emulates the way a human brain makes a judgement, a limitation is the way it handles the input data. In the case of human reasoning, input data need not always be crisp but could have linguistic labels like “small”, “high”etc. Also, the response to the data need not always follow a strict “yes-no” rule but could have a range of responses across a continuum. Such a pattern of responses is referred to as the membership function and such reasoning is called “fuzzy” reasoning. A fuzzy inference system using fuzzy rules can model qualitative aspects of human behavior. This was first explored by Takagi and Sugeno [27] and has since been used in numerous applications involving predictions [28].
Fuzzy inference systems are composed of five functional blocks as given in Figure 3. These are 1) a rule base containing a number of if-then rules 2) a database which defines the membership function, 3) a decision making interface that operates the given rules 4) a fuzzification interface that converts the crisp inputs into “degree of match “with the linguistic values like high or low etc., and 5) a de fuzzification interface that reconverts to a crisp output [28].
Adaptive Neuro Fuzzy Inference system (ANFIS) is a hybrid technique which combines the adaptive learning capability of ANN along with the intuitive fuzzy logic of human reasoning formulated as a feed-forward neural network. Hence, the advantages of a fuzzy system can be combined with a learning algorithm [28]. Fusion of Artificial Neural Networks (ANN) and Fuzzy Inference Systems (FIS) is used by researchers in various scientific and engineering areas due to the growing need of adaptive intelligent systems to solve the real world problems. ANN learns by adjusting the weights of interconnections between layers. FIS uses fuzzy set theory, fuzzy if-then rules, and fuzzy reasoning. Given in the following section are details of the model developed.
A typical ANFIS consists of five layers, which perform different actions in the ANFIS are detailed below. For simplicity, we have illustrated a system that has two inputs x and y and one output Z. The rule base, for illustrative purposes consists of two if-then rules of the Takagi-Sugeno type.
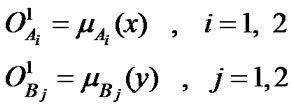
Layer 1: All the nodes in this layer are adaptive nodes. They generate membership grades of the inputs. The node function is given by:
 (1)
(1)
where x and y are inputs and Ai and Bj are appropriate membership functions (MF’s), which can be triangular, trapezoidal, Gaussian functions or other shapes. In our study, the Gaussian MF’s has been utilized and three input parameters are: Process, Strategic and Vendor.
Layer 2: The nodes in this layer are fixed nodes which multiply the inputs and send the product out. The outputs of this layer are represented as:
 (2)
(2)

Figure 3. Fuzzy inference system.
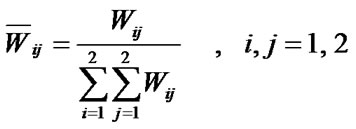
Layer 3: The nodes in this layer are also fixed nodes. It calculates the ratio of a rule’s firing strength to sum of the firing strengths of all the rules. This action is represented as follws:
 (3)
(3)
This is called normalized firing strength.
Layer 4: Each node in this layer is an adaptive node, whose output is simply the product of the normalized firing strength and a first-order polynomial (for a first order Sugeno model).
Thus, the outputs of this layer are given by:
![]() (4)
(4)
Parameters in this layer are referred to as consequent parameters.
Layer 5: The single node in this layer computes the overall output as the summation of all incoming signals, i.e.
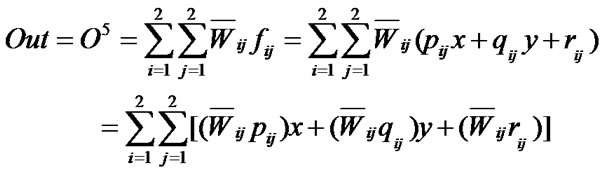 (5)
(5)
where the overall output Out is a linear combination of the consequent parameters when the values of the premise parameters are fixed. It uses Sugeno type fuzzy inference systems and Gaussian membership function is used to train the given data set. The ANFIS structure used is illustrated in Figure 4.
This model uses eight rules which are as given below:
1) (Process = in1mf1) & (Strategic = in2mf1) & (Vendor = in3mf1) => (UserSatisfaction = out1mf1)
2) (Process = in1mf1) & (Strategic = in2mf1) & (Vendor = in3mf2) => (UserSatisfaction = out1mf2)
3) (Process = in1mf1) & (Strategic = in2mf2) & (Vendor = in3mf1) => (UserSatisfaction = out1mf3)
4) (Process = in1mf1) & (Strategic = in2mf2) & (Vendor = in3mf2) => (UserSatisfaction = out1mf4)
5) (Process = in1mf2) & (Strategic = in2mf1) & (Vendor = in3mf1) => (UserSatisfaction = out1mf5)
6) (Process = in1mf2) & (Strategic = in2mf1) & (Vendor = in3mf2) => (UserSatisfaction = out1mf6)
7) (Process = in1mf2) & (Strategic = in2mf2) & (Vendor = in3mf1) => (UserSatisfaction = out1mf7) (1)
8) (Process = in1mf2) & (Strategic = in2mf2) & (Vendor = in3mf2) => (UserSatisfaction = out1mf8) (1)
The graphical representation of the eight rules is given in Figure 5.
After training (using 99 data sets), the model was tested with the balace 44 data sets. The results of the
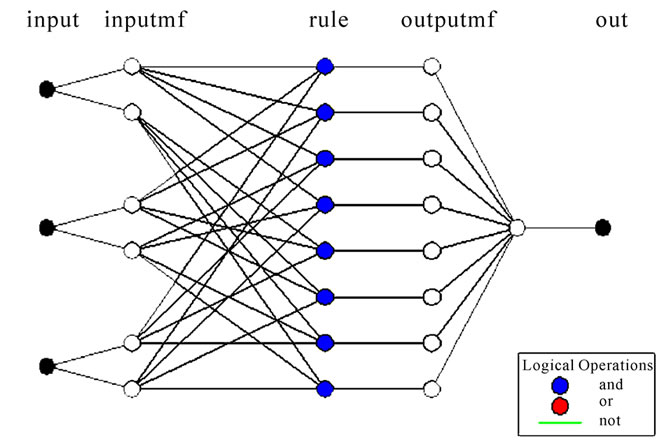
Figure 4. ANFIS structure.
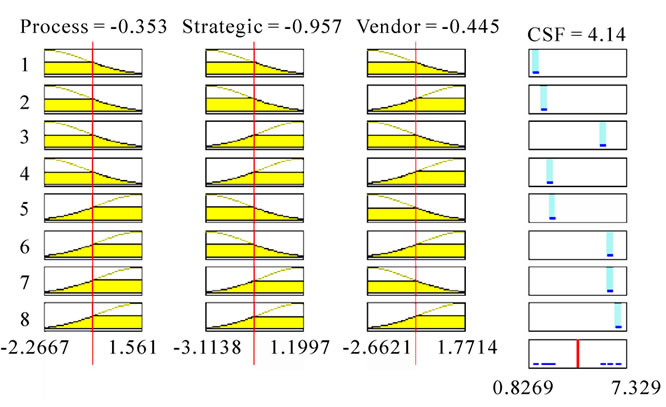
Figure 5. ANFIS rules.
predicted data were compared with the actual data are given in Figure 6.
The contour diagrams of the output and its predictor variables are given in Figures 7(a), 7(b), 7(c).
4.3.1. Prediction with ANN
The prediction was carried out using ANN. The ANN structure used in our study is given in Figure 8. The same training set of 99 used for the ANFIS model was used for the ANN modelling as well. The testing set consisted of the same 44 that were used to test the ANFIS model.
The model developed is able to predict User Satisfaction with a Root Mean Square Error (RMSE) of 0.85 and a Mean Average Percentage Error (MAPE) of 0.195. The prediction results of the ANN model for the test data is as given in Figure 9.
4.3.2. Prediction with MLRA
The predictors given in Table 4 above were regressed against User Satisfaction which is a measure of ERP success. The resulting regression equation is given in equation (6). Table 4 lists the coefficients and the results of the significance tests.
User Satisfaction = 4.86 + 0.812 Process + 0.496 Strategic – 0.010 Vendor (6)
Process and Strategic predictors have a very strong influence on the prediction of User Satisfaction with P < 0.05, but the Vendor predictor (with P > 0.05), does not contribute much to the prediction of User Satisfaction.
The model is tested for assumption violations of multiple regressions. Plotting the residuals versus the predicted variable is a basic method of identifying such violations. An assumption often encountered violation in non-normality. A diagnostic for the same is a histogram of the residuals as well as a normality probability plot of residuals. A normal distribution makes a straight diagonal line and the residual line closely following the diagonal indicates that the distribution is normal [10]. Figure 10 gives the residual plots and as can be seen the specified model does not violate the core assumptions of multiple regression.

Figure 6. Prediction results.
 (a)
(a)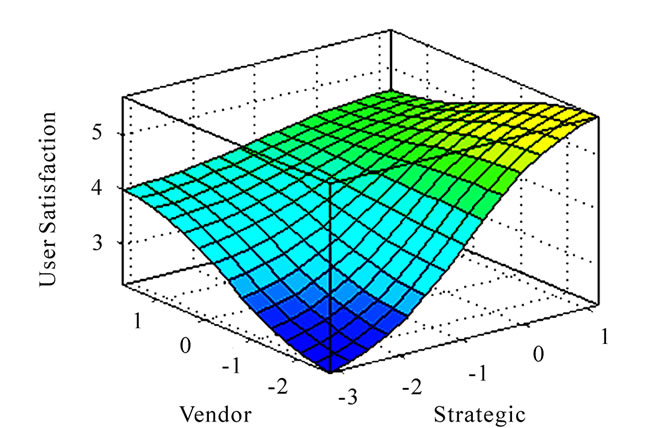 (b)
(b) (c)
(c)
Figure 7. (a) Contour diagram; (b) contour diagram; (c) contour diagram.

Figure 8. ANN structure.
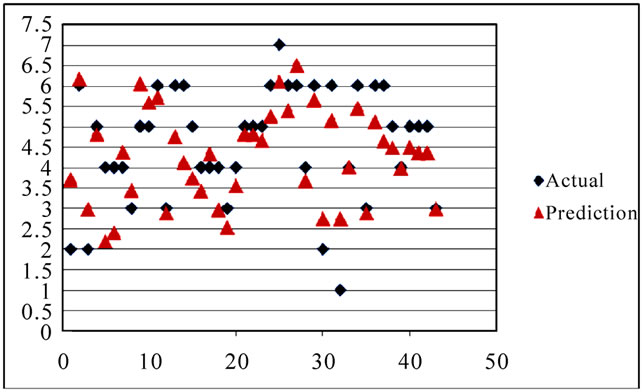
Figure 9. ANN prediction results.
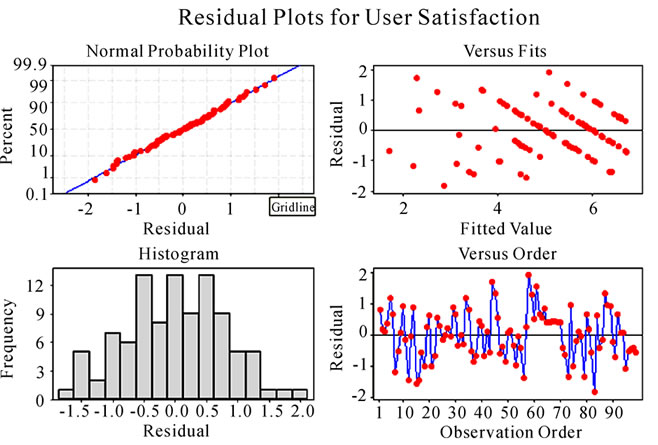
Figure 10. Residual plots for user satisfaction.
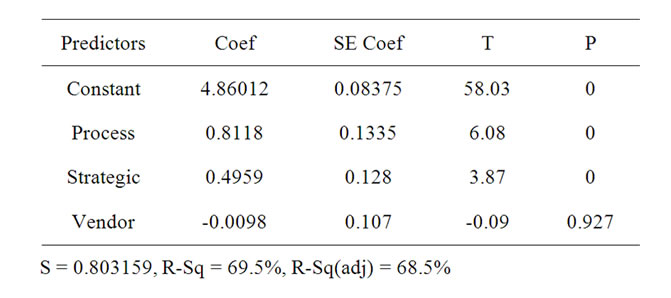
Table 4. Regression results.
4.3.3. Models Comparision
Figure 10 compares the results of prediction using MLRA, ANN and ANFIS with the actual outcomes. The Mean Average Percentage Error (MAPE) and Root Mean Square Error (RMSE) are used to test the efficacy of the prediction techniques. They are calculated using equations (7) & (8). Lower values are indicative of better fit. As can be seen from Table 5 ANFIS outperforms both ANN and Regression significantly.
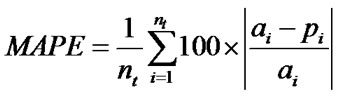 (7)
(7)
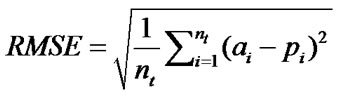 (8)
(8)
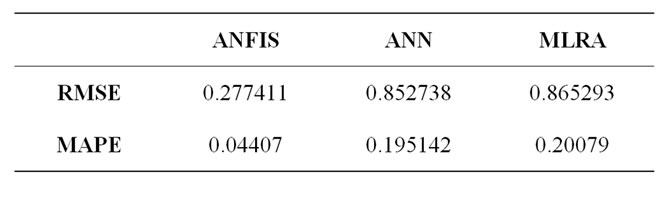
Table 5. Comparitive results.
where a is actual value, p is predicted value and nt is the number of testing samples. The results show that ANFIS has a significantly better prediction capability. The RMSE of ANFIS is almost three times better than the other two methods. The MAPE results are also much better for ANFIS. This establishes that ANFIS as a modelling tool is an excellent predictor of ERP implementation outcomes.
5. Conclusions
This study has modeled the ERP Implementation process, using causal factors Strategic, Process and Vendor as predictor variables and User Satisfaction as the dependent variable. These factors represent the relevant causal factors that impact the success or failure of an ERP implementation in terms of User Satiscaftion.
Data for the modeling is from a prior study that developed and tested a measurement model for assessing the causal factors for ERP implementation outcomes using Structural Equation Modeling (SEM). About 150 respondents from about 60 business organizations representing different user cohorts, Strategic, Operational and Technical, responded to a structured questionnaire. This generated the data on the causal factors and also User Satisfaction. This data was used for further analysis in this study.
We developed/trained Multiple Linear Regression Analysis (MLRA), Artificial Neural Network (ANN) and Adaptive Neuro Fuzzy Inference System (ANFIS) prediction models using part of the dataset (99 responses) and tested using the balance (43 responses). Of the three techniques ANFIS outperformed ANN and MLRA in terms RMSE and MAPE.
The study established the efficacy of ANFIS as a good predictor of project risk of ERP implementations measured in terms of User Satisfacion considered as a good measure to evaluate overall IS success. It has important significance to practitiones who can use the survey instrument developed along with the model to asses the risk of their ERP project very early in the implementation cycle. The model developed can be used by the management to asses the predicted User Satisfaction levels well in advance and thereby take appropriate corrective measures. The utility would be further enhanced if the model developed could be supplemented with a decision support system (DSS) that would help practioners simulate the outcome of the implementations dynamically by altering the value of the three predictor factors and assessing the response of the model in terms of user satisfaction. This is the continuing work that is being carried out by the authors and would be reported in a subsequent paper.
6. References
[1] New Standish Research Report, “Roadmap to the Megaples,” 2009. http://www.standishgroup.com
[2] D. Robey, J. Ross and M. Boudreau, “Learning to Implement Enterprise Systems: An Exploratory Study of the Dialectics of Change,” Journal of Management Information Systems, Vol. 19, No. 1, 2002, pp. 17-46.
[3] J. Brockner, “The Escalation of Commitment to a Failing Course of Action: Towards Theoretical Progress,” Academy of Management Review, Vol. 17, No. 1, 1992, pp. 39-61.
[4] M. Keil, “Pulling the Plug: Software Project Management and the Problem of Project Escalation,” MIS Quarterly, Vol. 19, No. 4, 1995, pp. 421-447.
[5] M. Keil, “Why Software Projects Escalate―an Empirical Study and Analysis of Four Theoretical Models,” MIS Quarterly, Vol. 24, No. 4, 2000, pp. 631-664.
[6] A. J. Al-Shehab, R. T. Hughes and G. Winstanley, “Modelling Risks in IS/IT Projects through Causal and Cognitive Mapping,” The Electronic Journal of Information Systems Evaluation, Vol. 8, No. 1, 2005, pp. 1-10.
[7] C. Venugopal and S. Rao, “Detecting Project Risks in ERP Projects Measurement Models for Critical Success Factors and Success of ERP Implementations,” Proccedings of International Conference on Advances in Industrial Engineering Applications, Chennai, India, 2010.
[8T. M. Somers and K. Nelson, “The Impact of Critical Success Factors across the Stages of Enterprise Resource Planning Implementations,” Proceedings of the 34th Annual Hawaii International Conference on System Sciences, Hawaii, 2001, pp. 8016-8025.
[9] W. H. DeLone and E. R. McLean, “Information Systems Success: The Quest for the Dependent Variable,” Information Systems Research, Vol. 3, No. 1, 1992, pp. 60-95.
[10] W. H. DeLone and E. R. McLean, “The Delone and Mclean Model of Information Systems Success―a Ten Year Update,” Journal of Information Systems, Vol. 19, No. 4, 2003, pp. 9-30.
[11] T. H. Davenport, “Putting the Enterprise into the Enterprise System,” Harvard Business Review, Vol. 76, No. 4, 1998, pp. 121-131.
[12] A. Parr and G. Shanks, “A Model of ERP Project Implementation,” Journal of Information Technology, Vol. 15, No. 4, 2000, pp. 289-303.
[13] K. K. Hong and Y. G. Kim, “The Critical Success Factors for ERP Implementations: An Organizational Fit Perspective,” Information and Management, Vol. 40, No. 1, 2002, pp. 25-40.
[14] J. Hedman, “Enterprise Resource Planning Systems: Critical Factors in Theory and Practice,” Lund University, 2004.
[15] R. B. Cooper and R. W. Zmud, “Implementation Technology Implementation Research: A Technological Diffusion Approach,” Management Science, Vol. 36, No. 2, 1990, pp. 123-139.
[16] B. H. Wixom and H. J. Watson, “An Empirical Investigation of the Factors Affecting Data Warehousing Success,” MIS Quarterly, Vol. 25, No. 1, 2001, pp. 16-41.
[17] P. Holland, B. Light and N. Gibson, “A Critical Success Factors Model for Enterprise Resource Planning Implementation,” Proceedings of the 7th European Conference on Information Systems, Vol. 1, 1999, pp. 273-297.
[18] A. T. Marbach, “Detecting Risk in Information Technology Projects,” Doctoral Thesis, University of Texas, Arlington, 2003.
[19] F. D. Davis, “User Acceptance of Information Technology: System Characteristics, User Perceptions and Behavioral Impacts,” International Journal of Man Machine Studies, Vol. 38, No. 3, 1993, pp. 475-487.
[20] M. L. Markus and C. Tanis, “The Enterprise System Experience-from Adoption to Success,” In: R. W. Zmud, Ed., Framing the Domains of IT Management: Projecting the Future through the Past, Chapter 10, Pinnaflex Educational Resources Inc., Cincinnati, 2000, pp. 173-207.
[21] S. Shang and P. B. Seddon, “Assessing and Managing the Benefits of Enterprise Systems: The Business Manager’s Perspective,” Information Systems Journal, Vol. 12, No. 4, 2002, pp. 271-299.
[22] B. L. Myers, L. A. Kappelman and V. R. Prybutok, “A Comprehensive Model for Assessing the Quality and Productivity of the Information Systems Function,” Information Resources Management Journal, Vol. 10, No. 1, 1997, pp. 6-25.
[23] J. F. Hair, W. Black, R. E. Anderson and R. L. Tatham, “Multivariate Data Analysis (6/E),” Pearson Education, 2008.
[24] B. Eftekhar, K. Mohammad, H. E. Ardebili, G. Mohammad and E. Ketabchi, “Comparison of Artificial Neural Network and Logistic Regression Models for Prediction of Mortality in Head Trauma Based on Initial Clinical Data,” BMC Medical Informatics and Decision Making, Vol. 5, No. 3, 2005, pp. 1-8.
[25] A. R. Gray and S. G. MacDonell, “A Comparison of Techniques for Developing Predictive Models of Software Metrics,” Information and Software Technology, Vol. 39, No. 6, 1997, pp. 425-437.
[26] D. W. Patterson, “Artificial Neural Networks: Theory and Applications,” Prentice Hall, Englewood Cliffs, 1996.
[27] T. Takagi and M. Sugeno, “Fuzzy Identification of Systems and its Applications to Modeling and Control,” IEEE Transactions Systems, Man, Cybernetics, Vol. 15, No. 1, 1985, pp. 116-132.
[28] J. S. R. Jang, “Adaptive-Network-Based Fuzzy Inference system,” IEEE Transactions on Systems, Man, and Cybernetics, Vol. 23, No. 3, 1993, pp. 665-685.