iBusiness
Vol.2 No.2(2010), Article ID:1954,11 pages DOI:10.4236/ib.2010.22016
An Expert System Approach to Medical Region Selection for a New Hospital Using Data Envelopment Analysis
![]()
Graduate School of Management, Ming Chuan University, Ming Chuan, Taiwan, China.
Email: ctlin@mail.ypu.edu.tw, clee@mcu.edu.tw, ivy.cute916@msa.hinet.net
Received February 22nd, 2010; revised March 27th, 2010; accepted May 1st, 2010.
Keywords: Practice location, equality of medical resources distribution, data envelopment analysis, effectiveness
ABSTRACT
An appropriate medical region must be selected before establishing a new hospital. Once established, a hospital may bring many medical doctors and facilities to the area. Not only can the distribution of medical resources in that area be influenced, but also competition among different hospitals can be enhanced. The government needs to consider the issue of medical resource distribution; therefore, medical region selection has important policy implications. This study uses data envelopment analysis (DEA) to establish the effective indicators, and also uses an expert system on the equality of medical resource distribution to identify medical areas lacking medical resources and where there is relatively less competition. As a result, this study can provide the necessary information to facilitate the choice of region for a new hospital. This method not only avoids assigning a hospital to a medical region where there are surplus resources, but it can also reduce the risk of excessive competition.
1. Background
Prior to the establishment of the National Health Insurance system, there were 716 hospitals and 61,105 acute beds in Taiwan. However, by 2006, the number of hospitals was reduced by 193 to 523, whereas the number of acute beds had increased by 11,827 to 72,932 [1]. This development indicates the tendency for hospitals to continue to expand to obtain higher medical payments [2].
The government adopted a hands-off approach to physician training and hospital management until the establishment of the Department of Health, Executive Yuan, in 1971 [3]. Taiwan is divided into 17 different healthcare districts, and relevant criteria for assessing medical resources are also established by the Department of Health [4]. According to the standard developed by the Department of Health for medical districts without sufficient medical resources (defined as districts with less than 20 general sickbeds per 10,000 population), no medical districts lacked medical resources as of 2006, except the medical area of Yulin County, which probably had 25 general sickbeds per 10,000 population. Thus, most districts have over 30 general sickbeds per 10,000 population; half of these have a sufficient amount of medical resources, with over 60 general sickbeds per 10,000 population. Hospitals established in districts with sufficient medical resources immediately suffer not only excessive competition in health-care markets, but also barriers to expansion or the establishment of new hospitals [3]. Moreover, the Department of Health has been developing a new project called the “Global Budget System” since 1998, in which annual total medical expenditure is calculated based on medical-care payments for each person and the actual number of medical insurance objects [5]. Besides the payment of total medical claims for general hospitals, payment for dentists, Chinese medicine doctors, and family doctors exists on a different basis. Therefore, if an inappropriate medical district is selected, one might simultaneously face several problems; for example, greater competition and a lower average payment value. Furthermore, since medical services are not mobile, and patients must attend hospitals in person, careful medical district selection has become a key issue for those establishing new hospitals. Once established, a hospital may bring many medical doctors and facilities to the area, which strongly influences the distribution of medical resources, and competition among different hospitals can be enhanced. Therefore, choice of the medical area for a new hospital has important policy implications.
When the market is in balance, all doctors share the same effective demand. Similarly, it is wise for doctors to establish their practices in areas with a low density of doctors per capita to equalize distribution [6]. Additionally, Newhouse et al. [7] found that cities with smaller populations could be considered only after the number of doctors in urban areas reaches a certain ratio. Economic capability in the medical market may, therefore, profoundly affect doctors’ choices of where to locate their practices. Chiang [8] noted that the reason remote areas have fewer doctors is not because of the unequal distribution of medical resources, but rather because considerable room remains in cities for new market entrants. Thus, more doctors are needed to ensure that remote areas have sufficient medical resources and services. The only way to solve the problem of insufficient numbers of doctors in remote areas is to increase the supply of doctors. In Taiwan, for example, the Taiwanese government is trying to provide more doctors to remote areas by increasing the quota for medical students and also promoting the Medical Group Practice Center [3]. Because of this successful medical policy, the number of doctors has increased from 24,399, before the implementation of the health-care project in 1994, to 34,864 in 2006; an increase of 10,465 (about 43%) in 12 years [9]. Intensifying competition among doctors in the medical market can be a problem; thus, doctors must seriously consider whether they should locate their practices in a medical district with a smaller number of doctors to avoid excessive competition.
In economics, the market concentration ratio is widely used to measure the degree of competition [10], particularly the Herfindahl index, which is used to calculate the square of the total occupancy rate of all hospitals in the market. Competition increases with decreasing Herfindahl index [11]. In a medical district with a population of 10,000 people, when the Herfindahl index drops to 100 (from 1000), the number of doctors increases from 10 to 100, but the occupancy rate of each doctor remains unchanged; i.e., the degree of competition increases. Thus, capacity must be calculated before a new hospital is established. Furthermore, the capacity itself, the number of doctors, and the amount of additional medical resources in this market must also be considered.
The quantity of medical resources in a medical district can be measured by analyzing whether it has an equal distribution of medical resources when compared with other related medical districts. If a medical district suffers from an unfair distribution of medical resources, it might be a suitable location for establishing a new hospital. Two methods are commonly adopted for measuring equality, namely the proportional method and the index method [12]. Regardless of which method is used, numerous different metrics or criteria must be considered in the data. Furthermore, unless a medical district exists having its entire metrics superior to those of other districts, it will be extremely difficult to evaluate and justify districts which are superior to others, without using any weightings or transfer functions. Due to the limitations of traditional methods, the major purpose of this study was to establish a Performance Index using Data Envelopment Analysis (DEA), in which the Performance Index is adopted to evaluate the equality of distribution of medical resources in a medical district. The DEA model can provide an objective and fair solution to the above problem without requiring any presuppositions [13].
The function of the expert system lies in offering, judging, explaining, and making policy decisions to the specific field question [14], and compared with a human expert, the expert system has several beneficial characteristics: no time restrictions, low cost of operation, ease of distribution and duplication, consistency, ability to deal with time-consuming or complicated problems, and can be adapted to specific fields [15]. The question of medical region selection for new hospitals is complicated, and thus an expert system can perform better than a human expert.
This study used data envelopment analysis (DEA) to establish the effective indicators and to help choose the correct expert system. In particular, this study used the relevant medical care materials and the peoples’ awareness of accessibility of medical treatment in 2006, and then applied the DEA method to identify the equality of medical resource distribution in Taiwan, to understand which medical areas lack medical resources, have relatively less competition, and in which, therefore, it is appropriate to add medical resources. This study may provide the necessary information to facilitate the choice of region for placement of a new hospital, avoiding placement in a medical region with a medical resource surplus, and reducing the risks associated with excessive competition.
2. Literature Review
Five definitions are most frequently quoted for equity of health-care distribution [16-21], as follows: equality of choice sets, equality of access, equality of expenditure, equality of needs, and equality of health.
2.1 Equality of Choice Sets
This means that all individuals should be provided with identical sets of choices [16,17]. This idea is similar to the theory of Penchansky and Thomas [22] regarding availability of enough doctors, hospitals, and equipment. This study measures choice set equality based on the percentage of doctors and acute beds; the number of choice sets increases with increasing percentage. When medical care facilities are established in districts with fewer choice sets, Phelps’ spatial theory, which holds that doctors would like to run their practices in sparsely populated areas, is demonstrated. Similarly, medical institutes face reduced competition as the number of choice sets decreases.
2.2 Equality of Access
This means that all individuals have equal access to medical care. Access not only indicates the convenience of obtaining medical care for all individuals, but also demonstrates the relationship between people and sites of medical care. For example, access involves distances and traffic problems [22]. Equality of access thus improves with decreasing distance. This study measures the equality of access based on the percentage of doctors, the length of road, and the percentage of the people able to obtain medical treatment within an acceptable time, with a higher value representing higher accessibility. Action [23], Coffey [24] and Cauley [25] indicated that the time taken to get medical treatment influences consumers’ medical demand. When the distance and time to obtain medical treatment are long, then the demand for medical treatment is very low. Using a questionnaire survey, one can identify the time delay that consumers find acceptable for obtaining medical treatment. When a medical institute chooses a medical area with lower accessibility, it is in agreement with D’Aspremont et al. [26], who indicated that factory dealers try their best to be far away from each other, the so-called principle of maximum differentiation. In addition, by choosing a medical area with lower accessibility, consumer demand will also increase, and there will not be much competition for medical facilities.
2.3 Equality of Expenditures
This means medical care is distributed fairly among different individuals. Outpatient services and hospitalization charges are generally included in medical expenditures. Two indicators, average expenditure on outpatient services and average expenditure on hospitalization, are used to measure expenditure equality. A higher value indicates that each person’s expenditure is higher. One does not use the percentage of doctors (western medicine) as an indicator of expenditure on outpatient services or the percentage of acute beds as an indicator of expenditure on inpatient services because these two indicators cannot tell us the differences that arise from regional differences in the number of people seeking medical treatment or differences in each person’s hospitalization cost. On the other hand, the average of each person’s outpatient expenditures and the average of each person’s inpatient expenditures can account for the difference in the number of people. In addition, after Taiwan implemented the Global Budget System, patient’s expenditures after seeking medical advice were paid by the Bureau of National Health Insurance [27], so the relationship with the number of patients is diminished [28]. Furthermore, in a medical region with a large number of doctors, more doctors’ increasing demand, thus increasing outpatient numbers, which increases each person’s average expenditure on medical treatment [29]. Thus, in medical regions with higher average individual expenditures on medical treatment, the number of doctors will be higher, resulting in relatively high competition.
2.4 Equality of Needs
Equality of needs means that medical resources should be distributed based on public need. Sometimes, necessity can be defined as obtaining or maintaining high-level medical services. Generally, medical treatment can be considered as health-care provided based on the medical knowledge of doctors and professionals [30,31]. In fact, when the unit of medical service is used to assess the need for medical treatment, the commonly applied methods include times of outpatient service, hospitalization, or surgery. Two indicators, percentage of doctors providing outpatient services and percentage of acute beds, are used to measure equality of needs. A higher value represents a greater amount of medical resources that the medical demands obtain each time. When a hospital chooses an area with lower medical resources, and the difference in the amount of medical treatment is considered, the effective demand should be the same for each doctor [12]. Similarly, when a medical institute is established in a region with lower medical resources, the competition is relatively low for the medical demands of each person.
2.5 Equality of Health
This means that the distribution of medical resources must result in all persons having equal health status, as reflected by life expectancies, death rates, infant death rates, and rates of injury and sickness. Owing to the elements of care that influence health status, numerous other relevant physiological and social factors can be identified [32]. Male and female survival rates are two indicators used to measure health equality. A higher value represents better health status in a medical area. Since nonprofit hospitals do not consider maximizing profit their main purpose, and they obtain their funds through charitable contributions or government subsidies, nonprofit hospitals can always manage [12]. The nonprofit hospital exists, as stated by Weisbrod [33], because there are some unmet demands for medical treatment; when the service provided is less than that required by society, people will organize a nonprofit hospital in order to offer services to provide the needed services. Thus, nonprofit hospitals must consider health equality as one of the standards used to determine where they should be established. A medical region that has a worse health status needs a nonprofit hospital.
The definition of the equality of distribution for medical resources indicates that non-profit hospitals should consider all five dimensions. Since for-profit hospitals do not always have to assume a major social responsibility, they only need to consider the first four dimensions.
3. Methods
The proportional and index methods are the most common methods of measuring equity. When the proportional method is used to distribute health care, the medical insurance expenditures among different groups can be adopted to compensate for the percentage differences [34]. The index method is the most frequently quoted method to measure equality; for example Van Doorslaer et al. [35] and Schalick et al. [36]. Wagstaff et al. [37] discuss three indices: “the disease centralization index, the centralization index of medical treatment expenditures, and the index of fairness.” This permits us to measure the degree of inequity in medical resources in advance. However, regardless of the method used, both methods (proportional and index) are only capable of dealing with single targets. When several indices are measured simultaneously, as in the present study, one weighted set or alternatively a transfer function must be provided. Additionally, the weighted set and the function choice are considered subjective.
The DEA model provides a single objective and fair method that does not require setting default weights to solve problems involving multiple objectives. Furthermore, the proposed method has good unit invariance. The earliest DEA model uses efficiency as the evaluation basis [38]. n decision management units (DMUs) (
 ) are accessed, and m types of input
 and p types of output
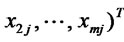
  are produced. The model for assessing the oth DMU is as follows:
 (1)
(1)
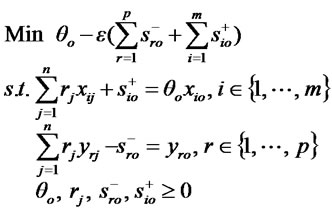
where  represents technical efficiency, and Equation (1) is the input-oriented CCR model. Consequently, the efficiency of this equation is also known as “input based efficiency.” Furthermore, output can also be taken as the output-oriented CCR model, which can be presented as follows:
 (2)
(2)
where the value of  is termed the “output based efficiency.” The relation between input and output based efficiency can be represented as
 .
.
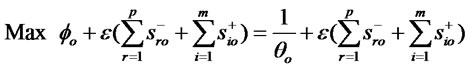
Chang et al. (1995) explained measurement effectiveness by implementing the CCR model. When the input in Equation (2) is set to , the output-oriented CCR model with a constant input should be:
 (3)
(3)
The effectiveness is the reciprocal of efficiency,  , by calculating Equation (3) namely
 . That is, when all DMU inputs are constants, the output-oriented DEA model equals the relative efficiency measured based on outputs. According to its meaning in management, it can be explained as “value the target unscrupulously”. Unscrupulousness here does not mean ignoring efficiency but instead stresses the macro-perception for measuring environmental change and developing a strategy for seeking long-term efficiency [39].
4. Research Process
This study implemented the DEA method by analyzing the equality of distribution of medical resources using four (for-profit hospitals) and five (nonprofit hospitals) dimensions, respectively. Furthermore, to avoid losing the meaning of performance value, in which too many DMUs, resulting from performance assessment, contribute to a performance value of 1, every effort should be made to ensure that the relationship between the number of DMUs and the number of input-output items meets the experience principle: namely, the number of DMUs is three times that of input-output items [40].
However, in this study, the DMU contains 16 medical districts (with Keelung City belonging to the same medical district as Taipei City and Taipei County), and the evaluation index contains eight items for for-profit hospitals and ten items for nonprofit hospitals. Therefore, the ratio index can be considered the criterion for evaluating the development of each medical district, where Table 1 illustrates the definition of each index. Although the experience principle is not always met, the major goal of this study was still to determine which medical districts have insufficient medical resources. It is extremely satisfying to obtain an analysis result in which few DMUs have a performance value of 1. This study used the DEA to build the structure for an expert system of assessment, as in Figure 1.
The relevant data from the “Health and Vital Statistics”, “Statistical Yearbook of the Highway Bureau”, and “National Health Insurance Statistics” for 2006 were gathered [1,41]. The percentage of people who can obtain medical treatment within an acceptable time, which is part of the equality of access indicator, was determined from a questionnaire survey conducted by the Department of Health, which identified the time delay that consumers find acceptable for obtaining medical treatment.
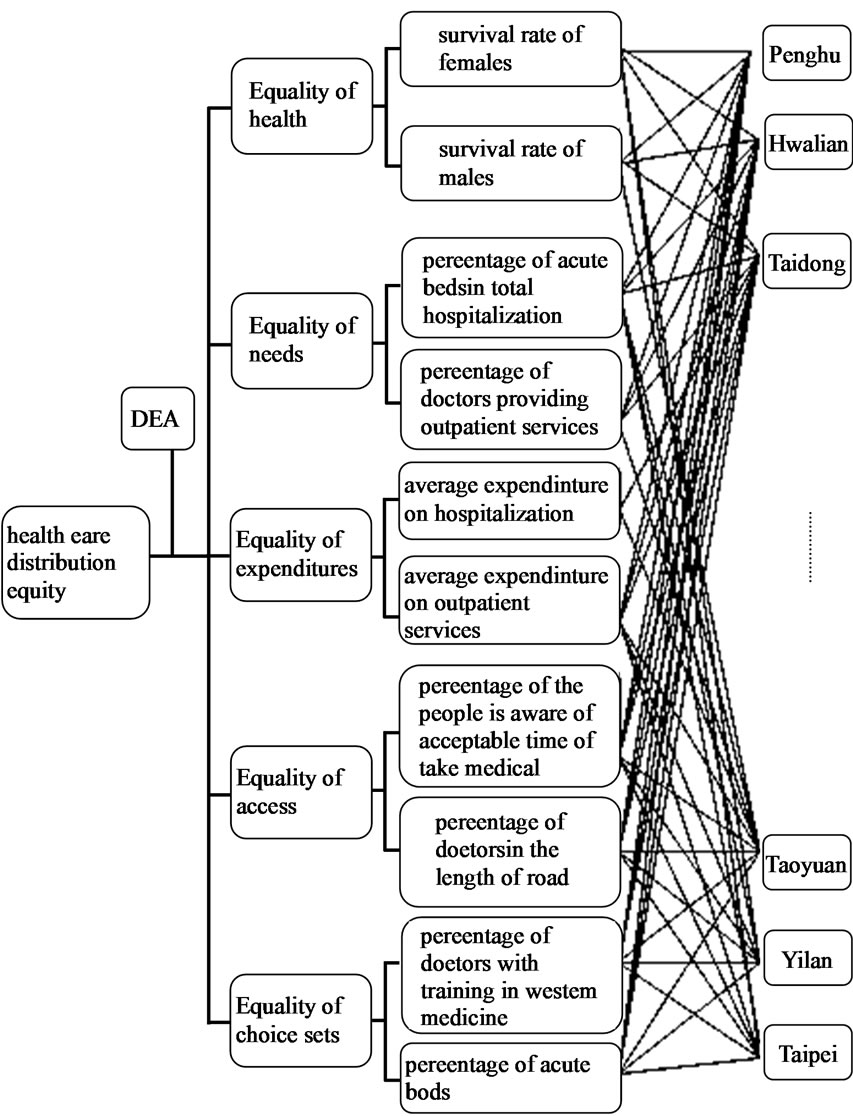
Figure 1. Structure of the equality of medical resources distribution
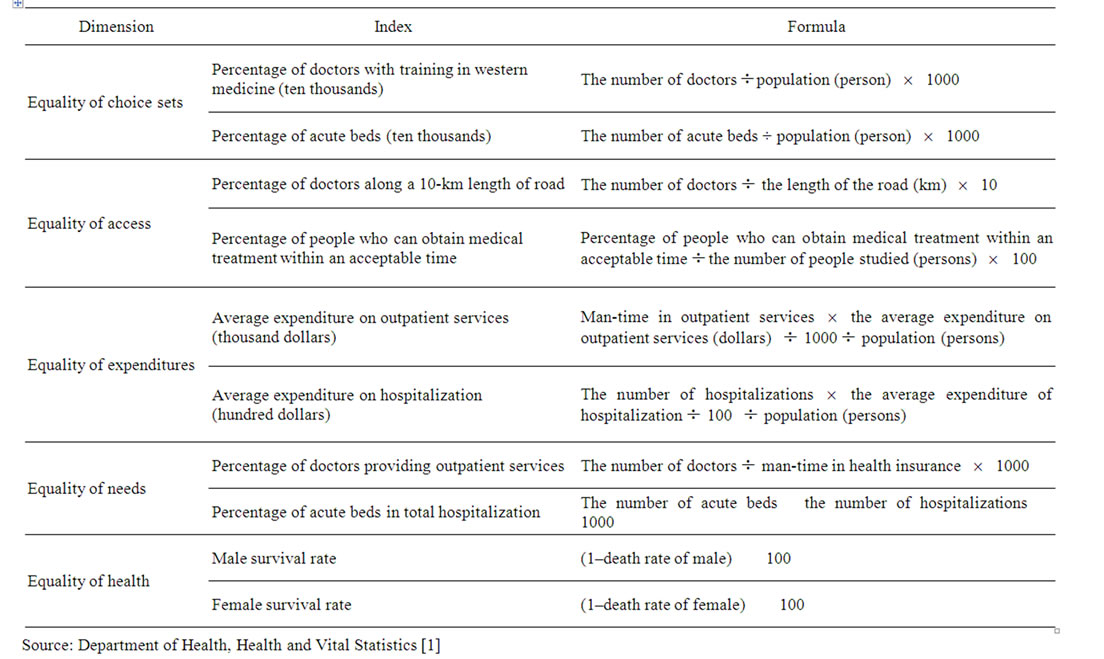
Table 1. Index for measuring health care distribution equity
A telephone questionnaire survey was conducted, using stratified percentage systematic sampling; 3,269 people were included in the sample. The equality index of the distribution of medical resources for each medical district was calculated based on the formula in Table 1, and the observed values are listed in Table 2.
The Department of Health currently divides Taiwan into 17 medical areas and 63 medical sub-areas. This division is based on the principle of regarding adjacent counties and cities as single areas [4]. For example, Taipei city and Taipei County are included in the same area. However, given that Keelung City is geographically surrounded by Taipei County, it seems sensible to also include it in the Taipei city and county medical area. Thus, this study analyzed 16 medical areas rather than 17.
The Department of Health directly signs insurance contracts with hospitals/clinics, but not with individual doctors. Doctors are allowed to simultaneously work for hospitals/clinics both within and outside the NHS system, so it is extremely reasonable to use the Department of Health figure for the number of hospitals. However, individuals who participate in the National Health Insurance system in specific areas are not necessarily residents of those areas, so a significant difference exists between the number of individuals insured under the NHS and the number of residents in an area. Thus, to avoid misunderstanding, data gathered by the Department of Health shows a rather high ratio of the insured.
5. Discussions
Based on Equation (3) in this study, Table 3 shows the analysis for the 16 medical districts. The closer the performance value calculated using Equation (3) is to 1, the fairer is the distribution of medical resources in that district, resulting in more sufficient medical resources. However, when the performance value is less than one, including situations where it is much less than 1, that district has an unfair distribution of medical resources, leading to greater insufficiency. Therefore, if the efficiency value of all medical districts is near 1, the distribution of medical resources in each district is fair. Table 3 shows that, whether from the perspective of for-profit or nonprofit hospitals, medical districts with fair distribution of (i.e., sufficient) medical resources in 2006 included Taipei (Taipei City, Taipei County, and Keelung City), Yilan County, Taichung (Taichung City, Taichung County) and Peng-hu County. Based on the results of this study, it is not wise to establish a new hospital in a district with sufficient medical resources, regardless of whether it is a for-profit or nonprofit hospital. Establishing a new hospital in such an area means that it will face excessive competition.
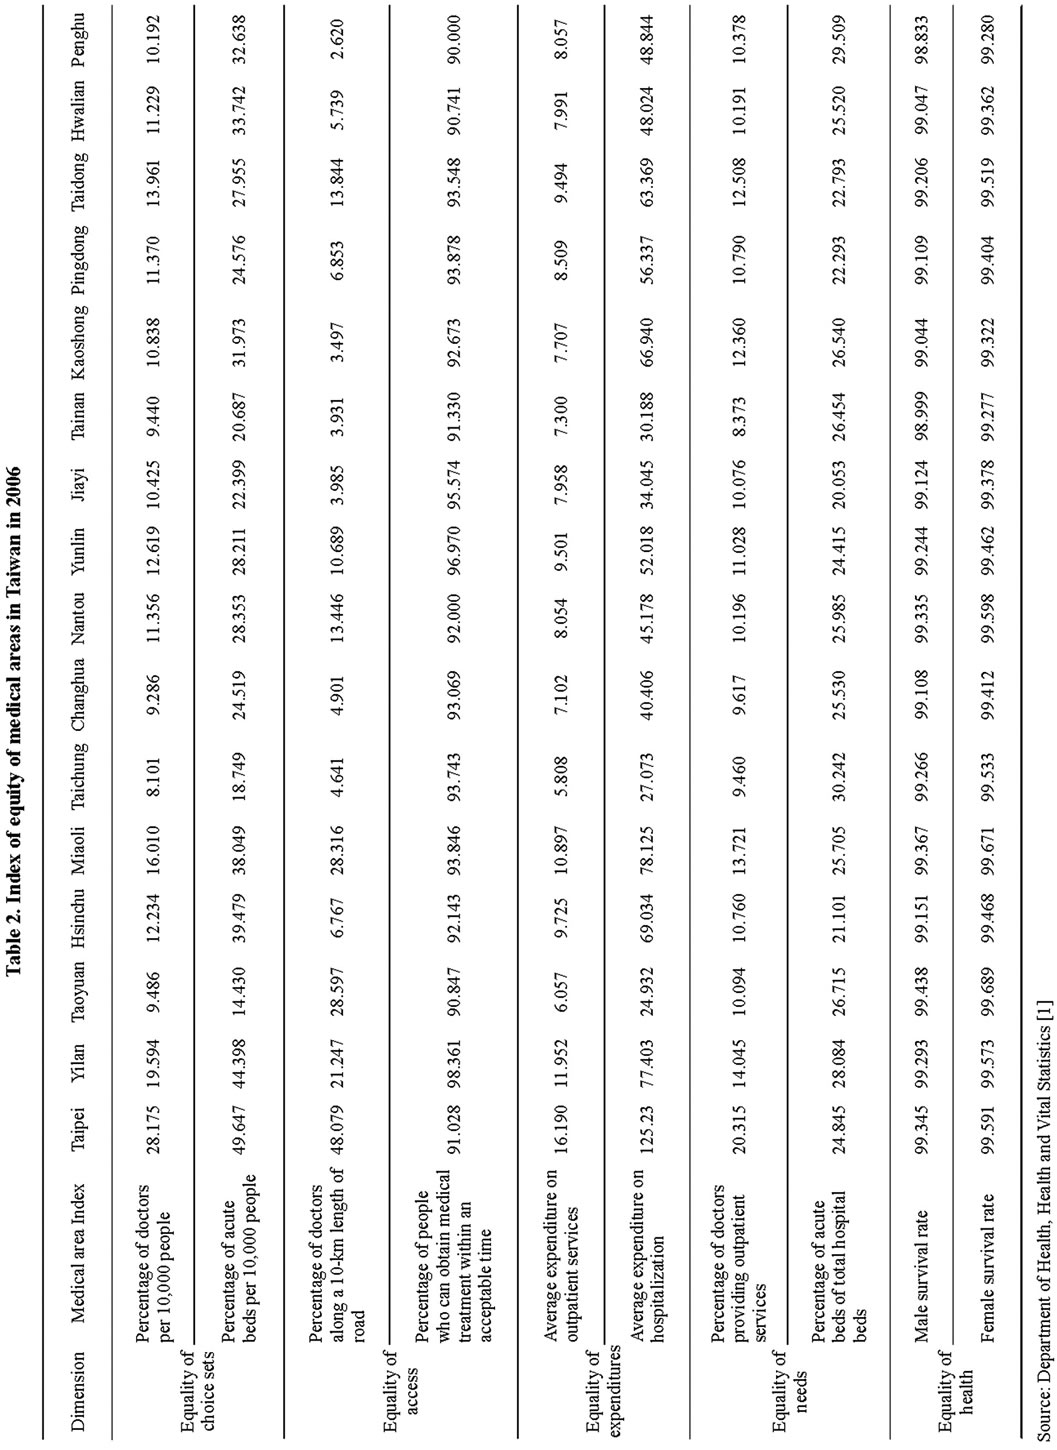
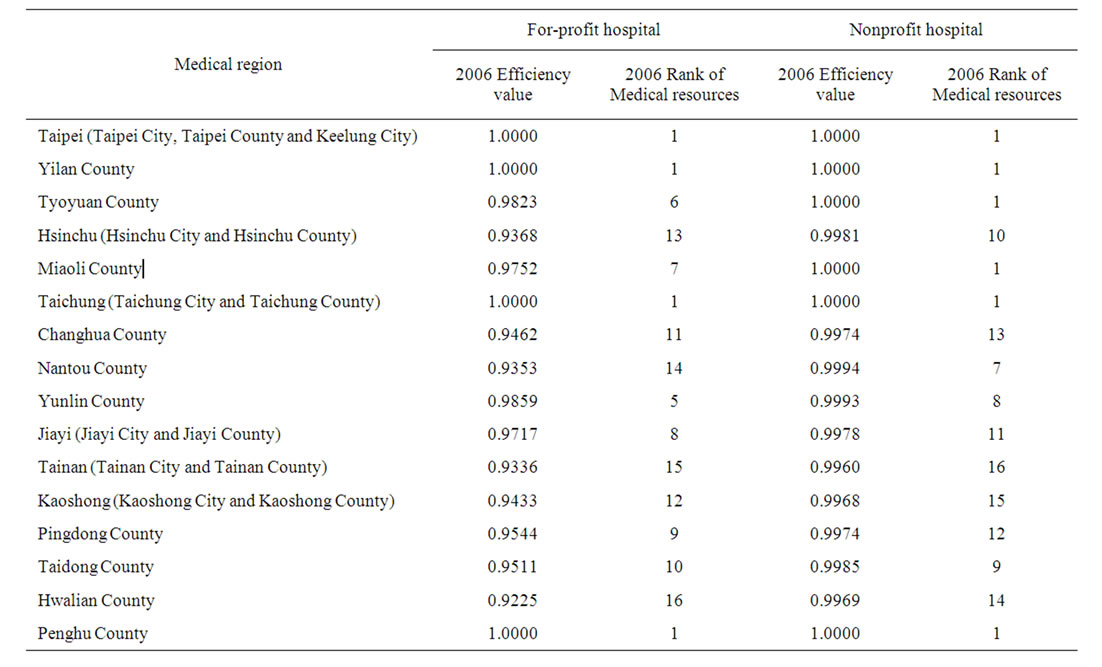
Table 3. Efficiency values and their ranks of distribution in medical treatment of each medical area in Taiwan
Additionally, if the performance values of individual medical districts are all close to 1, from the perspective of nonprofit hospitals, the distribution of medical resources in each medical district will be abundant, which seems clearly different from the perspective of for-profit hospitals. This situation applies because, regardless of the differences between medical districts in terms of medical resources, these differences have almost no effect on their survival rate. The Department of Health defines districts with less than 20 sickbeds per 10,000 people as having insufficient medical resources. The present study found that, of the 16 medical areas, the fewest acute beds were found in YunLin County (20.76 beds per 10,000 people) in 2006. Thus, no medical district in Taiwan has insufficient medical resources.
Notably, although Jiayi and Penghu Counties were assessed as having insufficient medical resources, the performance values of PengHu Counties in 2006 were 1.00, suggesting that the medical resources in Penghu Counties are sufficient. The government has regarded Jiayi county as seriously lacking medical resources, but if one examines Jiayi (Jiayi City and Jiayi County) medical area, the medical resources have already been improved. Careful investigation shows that the number of doctors in Jiayi County increased 54% from 1997 to 2006, while the number of emergency sickbeds increased 66%. Therefore, upgrading the number of doctors and hospital facilities appears highly effective in maintaining sufficient medical resources. Particularly after “God’s Help Hospital” was expanded and the Buddhist Tzu-Chi Dalin General Hospital and Chang Gung Memorial Hospital were established, Jiayi County appears to have already achieved sufficient medical resources. Penghu County is a separate island located off the coast of Taiwan, and the local government has been continuously and progressively promoting and implementing the “Integration Medical Service Outsourcing Project for Off-shore Islands Area of Penghu County,” which provides integrated medical services, including outpatient services, emergency treatment, health-care planning, home healthcare interviewing services, health education programs, and a patient referral system based on outsourcing and multiple solutions, thus helping maintain sufficient medical resources. In Penghu County, from 1997 to 2006, increases were achieved of 30% in the number of doctors, 30% in the number of outpatients, and 65% in the average outpatient service fee.
From the perspective of for-profit hospitals, the ranks of medical districts with the greatest insufficiency of medical resources in 2006 were Hwalian County, Tainan (Tainan City and Tainan County), Nantou County, Hsinchu (Hsinchu City, Hsinchu County), Kaoshong (Kaoshong City and Kaoshong County), Changhua County, Taidong County, Pingdong County, Jiayi (Jiayi City and Jiayi County), Miaoli County, Tyoyuan County, and Yilan County. From Figure 2, according to the first quartile (Q1 = 0.9384), second quartile (Q2 = 0.9631), and third quartile (Q3 = 0.9965) of relative efficiency value, the 16 regions can be grouped into four areas. In the first group are those areas with sufficient medical resources (Taipei (Taipei City, Taipei County, Keelung City), Yilan County, Taichung (Taichung City, Taichung County) and Penghu County). The second group is those areas of insufficient medical resources (Jiayi (Jiayi City, Jiayi County), Miaoli County, Taoyuan County and Yunlin County) with a relative efficiency value between the second quartile (Q2, 50%) and the third quartile (Q3, 75%). The third group is those areas of scant medical resources (Kaoshong (Kaoshong City, Kaoshong County), Changhua County, Taidong County and Pingdong County) with a relative efficiency value between the first quartile (Q1, 25%) and the second quartile (Q2, 50%). The fourth group is those areas with serious insufficiency of medical resources (Hwalian County, Tainan (Tainan City, Tainan County), Nantou County, and Hsinchu (Hsinchu City, Hsinchu County)), with a relative efficiency value less than the first quartile (Q1, 25%).
Using non-parametric methods, the Mann-Whitney test and the Kruskal-Wallis test, it was found that the medical efficiency values among the four groups was significantly different, (Mann-Whitney P = 0.001; KruskalWallis P = 0.002), which implies an unfair medical resource distribution among the four groups. Though the second group ((Jiayi (Jiayi City, Jiayi County), Miaoli County, Taoyuan County, and Yunlin County) has an acceptable level of medical resources, they are not sufficient. The third group (Kaoshong (Kaoshong City, Kaoshong County), Changhua County, Taidong County and Pingdong County) has scant medical resources – less than the average level – and needs to improve as quickly as possible. The fourth group has a serious insufficiency of medical resources (Hwalian County, Tainan (Tainan City, Tainan County), Nantou County and Hsinchu (Hsinchu City, Hsinchu County)), and also needs to improve as quickly as possible. Thus, for-profit hospitals should regard this area of very poor medical resources as a priority area to establish new medical facilities where they will not face excessive competition.
In fact, it is difficult to consider Hsinchu medical district as a place with insufficient medical resources, because of its high-tech industry image. But the “biomedical garden” of Hsinchu County has already been classified as 1 of 12 construction projects in the Loving Taiwan plan in 2008, and building is to commence in 2009, which should improve the medical resources of the Hsinchu area in the future. Other areas with insufficient medical resource include Nantou County, Hwalian County, Taidong County, and Pingdong County. In particular, Nantou County, Hwalian County, Taidong County, and Pingdong County have poor medical resources in remote areas of all four counties; the hospital centers are in the city, which results in large differences in accessibility to medical treatment. The government always classifies Jiayi County, Penghu County, and Yunlin County as areas that need early improvement, but only the medical resources in Penghu County have been effectively improved, suggesting that the government has not been successful in improving the medical resources in every medical area. When selecting an appropriate
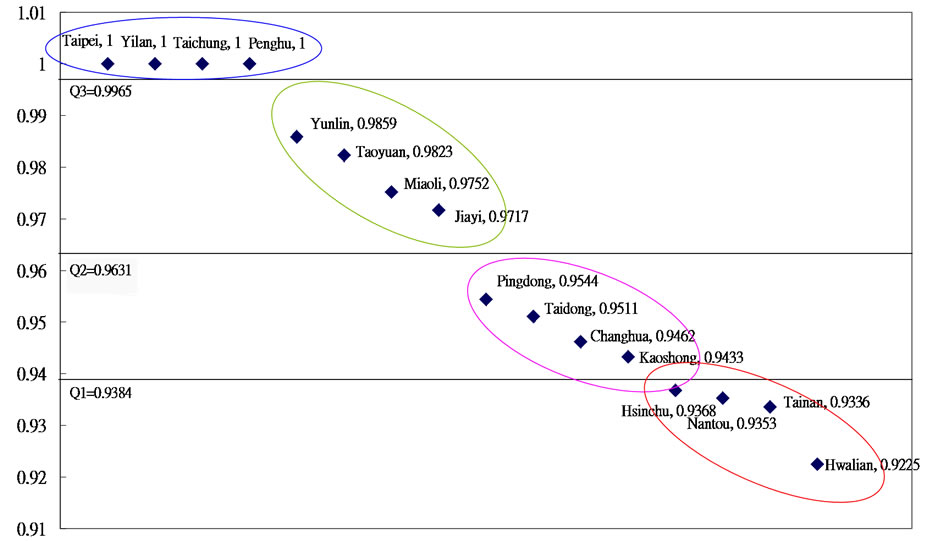
Figure 2. The relative efficiency of the distribution of medical treatment in every medical area of Taiwan
resources and the local traffic situation, which are disad- vantages faced by distant counties such Nantou, Ping location for a new hospital, the sufficiency of medical dong, Hwalian and Taidong County, should be the main considerations. Thus, the government should encourage the establishment of new private hospitals in Hsinchu (Hisnchu City, Hsinchu County), Miaoli County, Changhua County, Yunlin County, Jiayi (Jiayi City, Jiayi County), Tainan (Tainan City, Tainan County), and Kaoshong (Kaoshong City, Kaoshong County). In the cases of Nantou County, Pingdong County, Hwalian County, and Taidong County, the government still needs to offer sufficient incentives, for example, by providing government scholarships to medical students, promoting expansion projects for local public hospitals, and providing subsidies.
6. Conclusions
The value of this paper lies in evaluating the equality of the distribution of medical resources using the DEA model, while also setting up an assessment model using an expert system that measures many indicators while avoiding subjective comparisons. This study is extremely helpful in expanding the theory of DEA modeling into a practical application related to medical economics and management policies.
The medical regions in Taiwan with the greatest need to improve medical resources were listed individually based on the results of the DEA method. This study also illustrates how the DEA method may be implemented to assist decision-makers in avoiding risk and avoiding the establishment of new hospitals in medical districts with an excess supply of medical resources. These results may then provide a reference point for for-profit and nonprofit hospitals when selecting new hospital locations; and, for the government, these results are a guideline for developing future medical policies. In particular, this study assessed the equality of access indicator (percentage of people who can obtain medical treatment within an acceptable time) using a questionnaire survey. The purpose of the survey was to identify the time it took to obtain medical treatment that people found acceptable, which can more clearly reflect people’s perception of the accessibility of medical care, and serve as a convincing indicator of accessibility. Finally, this study proposes the following:
1) Both the DEA method and the process mentioned in this study should be applicable when private medical institutes are seeking locations for new hospitals. These findings not only help to evaluate the actual differences before establishing new hospitals, but also to reduce unnecessary risks resulting from excessive competition.
2) The first priority for improvement are those areas with a serious insufficiency of medical resources, including Hwalian County, Tainan (Tainan City, Tainal County), Nantou County, and Hsinchu (Hsinchu City, Hsinchu County). Next, those areas with scant medical resources, including Kaoshong (Kaoshong City, Kaoshong County), Changhua County, Taidong County and Pingdong County), need improvement. Finally, areas with insufficient medical resources, including Jiayi (Jiayi City, Jiayi County), Miaoli County, Taoyuan County and Yunlin County, need to be addressed.
3) Based on the study conducted here, the government should encourage private medical institutes to establish new hospitals in medical regions such as Taoyuan County, Hsinchu (Hsinchu City, Hsinchu County), Miaoli County, Changhua County, Yunlin County, Jiayi (Jiayi City, Jiayi County), Tainan (Tainan City, Tainan County), or Kaoshong (Kaoshong City, Kaoshong County), where they can benefit from relatively low competition and a reasonable traffic situation.
4) For regions in which traffic adversely affects accessibility to medical treatment, such as Nantou County, Pingdong County, Hwalian County, and Taidong County, the government should continue providing incentives, such as scholarships to students, expanding the local public hospital, and offering suitable subsidies.
5) For medical regions with sufficient medical resources, including Taipei (Taipei City, Taipei County and Keelung City), Yilan County, Taichung (Taichung City, Taichung County), and Penghu County, the government should consider delaying the establishment of new public hospitals and transferring public hospitals to private organizations, which would also reduce the government’s financial burden.
REFERENCES
- Department of Health, “Health and Vital Statistics,” Department of Health, Taiwan, 2006.
- T. C. Liu and P. C. Wu, “The Choice of Medical Institutions under NHI-An Example of Pediatric Patients in Taipei,” Journal of Healthcare Management, Vol. 2, No. 2, 2002, pp. 87-108.
- D. L. Jiang, “Health Policy: Taiwan Experience,” ChuLiu, Taipei, 1999.
- W. C. Hsiao, C. L. Yang and J. R. Lu, “Health Care Financing and Delivery in the ROC: Current Conditions and Future Challenges,” Industry of Free China, 1990, pp. 1-19.
- Y. C. Lee, M. S. Lai and P. C. Sheng, “The Development and the Implication of Annual Health Care Expenditure Target for Global Budget Payment System of National Health Insurance in Taiwan,” Journal of Healthcare Management, Vol. 2, No. 2, 2001, pp. 72-86.
- C. E. Phelps, “Health Economics,” Addison Wesley Educational Publishers Inc, New York, 1997.
- J. P. Newhouse, A. P. Williams, B. W. Bennett and W. B. Schwartz, “Does the Geographical Distribution of Physicians Reflect Market Failure,” Bell Journal of Economics, Vol. 13, No. 2, 1982, pp. 493-505.
- T. L. Chiang, “Deviation from the Carrying Capacity for Physicians and Growth Rate of Physician Supply: The Taiwan Case,” Social Science and Medicine, Vol. 40, No. 3, 1995, pp. 371-377.
- Department of Health, “Health and Vital Statistics,” Department of Health, Taiwan, 2001.
- F. X. Xiao, “Industrial Economics,” Root International Information Co., Ltd., 2002.
- R. E. Santerre and S. P. Neun, “Health Economics: Theories, Insights, and Industry Studies,” Harcourt Brace and Company, Fort Worth, 2002.
- R. F. Lu and Q. R. Xie, “Health Economics,” Taipei, 2000.
- L. M. Seiford, “Data Envelopment Analysis: The Evolution of the State of the Art (1978-1996),” Journal of Productivity Analysis, Vol. 7, No. 2-3, 1996, pp. 99-137.
- L. G. Xue, “Expert System in Library,” Index of NCL Taiwan Branch Bulletin, Vol. 5, No. 1, 1991, p. a10.
- B. K. Duval and L. Main, “Expert Systems: What is an Expert System?” Library Software Review, Vol. 13, No. 1, 1994, pp. 44-46.
- J. Le Grand, “Equity and Choice,” Harper Collins, London, 1991.
- J. Le Grand, “Health and Health Care,” Social Justice Research, Vol. 1, 1987, pp. 257-274.
- G. Mooney, “Equity in Health Care: Confronting the Confusion,” Effective Health Care, Vol. 1, No.4, 1983, pp. 179 -185.
- G. Mooney, J. Hall, C. Donaldson and K. Gerard, “Utilization as a Measure of Equity: Weighing Heat?” Journal of Health Economics, Vol. 10, No.4, 1991, pp. 475-480.
- G. Mooney, J. Hall, C. Donaldson and K. Gerard, “Reweighing Heat: Response to Culyer, Van Doorslaer and Wagstaff,” Journal of Health Economics, Vol. 11, No.2, 1992, pp. 199-205.
- A. J. Culyer and A. Wagstaff, “Equity and Inequity in Health and Health Care,” Journal of Health Economics, Vol. 12, No. 4, 1993, pp. 431-457.
- R. Penchansky and J. W. Thomas, “The Concept of Access: Definition and Relationship to Consumer Satisfaction,” Medical Care, Vol. 19, No. 2, 1981, pp. 127-140.
- J. P. Action, “Nonmonetary Factors in the Demand for Medical Services: Some Empirical Evidence,” Journal of Political Economy, Vol. 83, No. 3, 1975, pp. 595-614.
- R. M. Coffey, “The Effect of Time Price on the Demand for Medical Care Services,” Journal of Human Resources, Vol. 18, No. 3, 1983, pp. 407-424.
- S. D. Cauley, “The Time Price of Medical Care,” Review of Economics and Statistics, Vol. 69, No. 1, 1987, pp. 59-66.
- C. D’Aspremont, J. J. Gabszewicz and J. F. Thisse, “On Hotelling’s Stability in Competition,” Econometrical, Vol. 47, No. 5, 1979, pp. 1145-1150.
- Bureau of National Health Insurance, “The National Health Insurance Statistics,” Taiwan, 2006.
- T. E. Getzen, “Health Care is an Individual Necessity and a National Luxury: Applying Multilevel Decision Model to the Analysis of Health Care Expenditures,” Journal of Health Economics, Vol. 19, No. 2, 2000, pp. 259-270.
- L. F. Rossiter and G. R. Wilensky, “Identification of Physician-Induced Demand,” Journal of Human Resources, Vol. 19, No. 2, 1984, pp. 231-244.
- R. M. Anderson and J. F. Newman, “Societal and Individual Determinates of Medical Care Utilization in the United States,” Milbank Mem Fund Quarterly, Vol. 51, No. 1, 1973, pp. 95-124.
- C. Cox, “Physician Utilization by Three Groups of Ethnic Elderly,” Medical Care, Vol. 24, No. 8, 1986, pp. 667-676.
- C. Donaldson and K. Gerard, “Economics of Health Care Financing: The Visible Hand,” St. Martin’s Press, New York, 1993.
- B. A. Weisbrod, “Toward a Theory of the Voluntary NonProfit Sector in a Three-Sector Economy”. In E. Phelps, Ed., Altruism, Mortality and Economic Theory, Rusell Sage Foundation, New York, 1975.
- S. W. H. Cheng and J. R. Su, “The Incidence of Expenditures and Revenues in Taiwan’s National Health Insurance,” Taipei International Conference on Health Economics, Taipei, 1999.
- E. Van Doorslaer, A. Wagstaff, H. Van Der Burg, T. Christiansen, D. D. Graeve, I. Duchesne, U. G. Gerdtham, M. Gerfin, J. Geurts, L. Gross, U. Hakinen, J. John, J. Klavus, R. E Leu, B. Nolan, O. O’Donnell, C. Propper, F. Puffer, M. Schellhorn, G. Sundberg and O. Winkelhake, “Equity in the Delivery of Health Care in Europe and the US,” Journal of Health Economics, Vol. 19, No.5, 2000, pp. 553-583.
- L. M. Schalick, W. C. Hadden, E. Pamuk, V. Navarro and G. Pappas, “The Widening Gap in Death Rates among Income Groups in the United States From 1967 to 1986,” International Journal of Health Services, Vol. 30, No. 11, 2000, pp. 13-26.
- A. Wagstaff, E. Doorslaer and P. P. Van, “Equity in the Finance and Delivery of Health Care: Some Tentative Cross -Country Comparison,” Oxford Review of Economic Policy, Vol. 5, No. 1, 1989, pp. 89-112.
- A. Charnes, W. W. Cooper and E. Rhodes, “Measuring the Efficiency of Decision Making Units,” European Journal of Operational Research, Vol. 2, No. 6, 1978, pp. 429-444.
- P. L. Chang, S. N. Hwang and W. Y. Cheng, “Using Data Envelopment Analysis to Measure the Achievement and Change of Regional Development in Taiwan,” Journal of Environmental Management, Vol. 43, No.1, 1995, pp. 49-66.
- F. Pedraja-Chaparro, J. Salinas-Jimenez and P. Smith, “On the Quality of the Data Envelopment Analysis Model,” Journal of the Operational Research Society, Vol. 50, No. 6, 1999, pp. 636-644.
- Highway Bureau, “Statistical Yearbook of Highway Bureau,” M. O. T. C., Ministry of Transportation and Communications, Taiwan, 2006