Journal of Geographic Information System
Vol.5 No.4(2013), Article ID:35346,9 pages DOI:10.4236/jgis.2013.54035
Mangrove Forests Mapping in the Southern Part of Japan Using Landsat ETM+ with DEM
1Center for Environmental Remote Sensing (CEReS), Chiba University, Chiba, Japan
2Institute of Geography, Vietnamese Academy of Science and Technology (VAST), Hanoi, Vietnam
Email: *bayansaideh@gmail.com
Copyright © 2013 Bayan Alsaaideh et al. This is an open access article distributed under the Creative Commons Attribution License, which permits unrestricted use, distribution, and reproduction in any medium, provided the original work is properly cited.
Received April 24, 2013; revised May 24, 2013; accepted June 24, 2013
Keywords: Mangrove Forests; NDWI; NDVI; DEM; Japan
ABSTRACT
A regional map of mangrove forests was produced for six islands located in the southern part of Japan by integrating the spectral analyses of Landsat Enhanced Thematic Mapper plus (ETM+) images with a digital elevation model (DEM). Several attempts were applied to propose a reliable method, which can be used to map the distribution of mangrove forests at a regional scale. The methodology used in this study comprised of obtaining the difference between Normalized Difference Water Index (NDWI) and Normalized Difference Vegetation Index (NDVI), band ratio 5/4, and band 5, from Landsat ETM+, and integrating them with the topographic information. The integration of spectral analyses with topographic data has clearly separated the mangrove forests from other vegetation. An accuracy assessment was carried out in order to check the accuracy of the results. High overall accuracy ranging from 89.3% to 93.6% was achieved, which increased the opportunity to use this methodology in other countries rich in mangrove forests.
1. Introduction
Mangrove forests are of great environmental and land cover-mapping importance, they extend throughout tropical and sub-tropical ecosystems. Mangroves have important aesthetic, historical and cultural values [1]. In addition, mangroves have significant economical and environmental values beside their influence on global climate change. They protect coastlines against high tidal waves and floods, host a number of animal species, provide food for many marine species, and act as filters of sediments and nutrients in coastal catchments [2].
On the other hand, mangroves have strong relationships with the surrounding environments, since the occurrence of mangrove species at a certain location is related to the surrounding ecological gradients such as elevation, tidal inundation, water salinity, and soil pH [3]. Within the same environment there are other types of vegetation such as pastures, coastal shrubs and forests that grow up alongside with mangroves. The problem with these other types of vegetation is that they have spectral similarity with mangroves at a finer level [4]. Thus, it is anticipated that producing maps of mangrove forests at a regional scale will usually require high spatial resolution remotely sensed data.
The importance of remote sensing for mangrove forests mapping is well established. Many papers have produced to analyze the change detection of mangrove forests using aerial photographs [5], and to monitor coastal ecosystem changes supported by multi-temporal and multi-spatial resolution remote sensing data [6]. In addition, several studies have been proposed for mapping mangroves at local scale using different spatial resolution satellite data, including Landsat Thematic Mapper (TM) [7], Advanced Spaceborne Thermal Emission and Reflection Radiometer (ASTER) [3], Satellite Pour l’Observation de la Terre (SPOT) [1], Synthetic-aperture radar (SAR) [8], Compact Airborne Spectrographic Imager (CASI) [2], IKONOS [9] and Quickbird [10]. On the other hand many methods have been proposed for identifying and mapping mangrove forests from remote sensing data. For instance, [3] proposed a Bayesian probability method incorporating ecological parameters to develop a post classifier for mangrove forests that can be used as a guideline for producing mangrove maps at a finer level. [11] used principle component analysis and band ratios in addition to other techniques to compare the relative effectiveness of multi-spectral remote sensing data in mapping mangrove forests in Turks and Caicos Islands, and [12] compared different classifiers for SPOT XS and Terra ASTER data. More recently, [9] applied an ISODATA unsupervised classification technique on IKONOS and QuickBird images to distinguish different species of mangrove forests in Mabala and Yélitono mangrove islands of Guinea, West Africa.
Various studies, however, are primarily based on supervised classifications. For example, [4] mapped mangrove forests in the western Waitemata Harbour, Auckland, New Zealand by applying the maximum likelihood classification method (MLC) on Landsat TM and SPOT XS imagery. This study reported that supervised classification techniques can lead to more useful results when it is used for mapping mangrove forests. [13] assessed mangrove forests in the Mekong Delta in Vietnam through applying vegetative index differencing, and supervised classification method to SPOT XS. [14] monitored mangrove forest of Sundabans, the border between Bangladesh and India, by executing the MLC method on multi-temporal Landsat data.
The World Mangrove Atlas provided a realistic assessment of existing mangroves and their evolutionary trends at both global and local scales [15]. It is the most widely used reference to map the global distribution of mangroves. Moreover, two global land cover projects used to map mangrove forest independently as a separate land cover class using different sources of remotely sensed data: Global Land Cover 2000 (GLC 2000) [16], and Global Land Cover by National Mapping Organizations (GLCNMO) [17].
In this context, the aim of this study is to develop an efficient method to extract mangrove forests at a regional scale using remote sensing data. The specific objectives are: using Landsat Enhanced Thematic Mapper plus (ETM+) together with a Digital Elevation Model (DEM): 1) to discriminate between mangrove and non-mangrove forests; 2) to assess the capability of data used for mapping mangroves distribution; 3) and to map the extent of mangrove forests in Japan as a case study of a regional scale.
2. Study Area and Satellite Data
2.1. Study Area
The study area is located in the southern part of Japan. It extends from Kyushu Island (32˚28'N, 131˚02'E) to Iriomote Island (24˚20'N, 123˚49'E), one of the Ryukyu Islands, Japan, as shown in Figure 1. The study area comprises six islands: Kyushu, Tanega, Amami-O, Okinawa, Ishigaki and Iriomote. Climatically, these islands
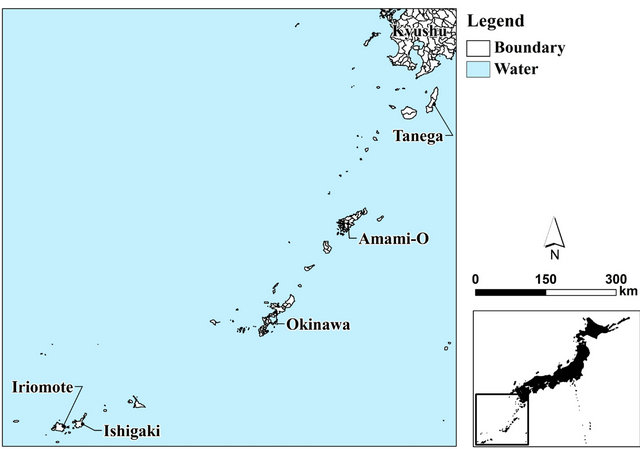
Figure 1. Location map of the study area.
lie in the transition from subtropical to tropical conditions. They include a diverse array of natural subtropical forests including broadleaf evergreen and deciduous forests, needle leaf evergreen and deciduous forests, mixed forest, tree open and mangrove forest in addition to agricultural land [17]. Mangrove forests can be found in some of these islands in a variety of settings as a coastal fringe, and along some rivers.
2.2. Satellite Images and Reference Data
The Landsat ETM+ and DEM acquired by the Shuttle Radar Topography Mission (SRTM) of the National Geospatial Intelligence Agency (NGA) 2010 were the main satellite data used in this study. These data are available at the Global Land Cover Facility (GLCF) [18] and the US Geological Survey (USGS) Center for Earth Resources Observation and Science (EROS) [19].
In this study, it was difficult to obtain all the Landsat ETM+ images at the same date, because some images were very cloudy in which mangrove forests were difficult to be observed. Thus, other cloud-free images at different dates were used. Moreover, two Landsat ETM+ images, acquired in 2004 and 2007, were used in this study. In these images, there was stripe noise due to an error in the Scan Line Corrector (SLC) of Landsat ETM+. However, the mangrove forest locations were not affected by the SLC error, and the images were still usable. Table 1 shows the information related to the satellite images used in this study for all islands.
Various reference data were used to validate the results of this study. The reference data mainly include: 1) aerial photographs at a nominal scale of 1:20,000 obtained in 1987; 2) vegetation maps published by the Natural Environment Biodiversity Center, Ministry of the Environment, at scales 1:50,000 and 1:25,000 acquired in 2001-2006, respectively; 3) detailed topographic maps at scale 1:25,000 published during the period from 2004 to 2006.
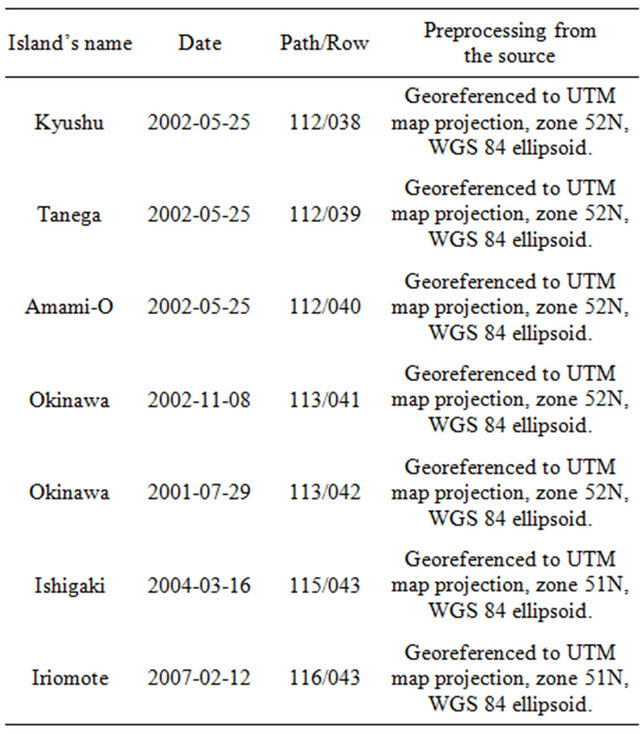
Table 1. Information of landsat ETM+ data used in this study.
3. Methodology
3.1. Image Processing
A subset of each of Landsat ETM+ and DEM image covering the study area (6 Islands) were used. The images were resampled to a pixel size of 30 m × 30 m using the nearest neighbour method. The Landsat ETM+ images were in the Universal Transverse Mercator (UTM) projection (Zones 51 and 52) and the WGS84 ellipsoid, as shown in Table 1. For each Landsat ETM+ image, a false color composite image was generated from bands 4, 5, and 7 and displayed in red, green and blue (RGB) colors, respectively. The false color composite images were used for the purpose of visual interpretations and analyses.
Since mangroves are an intensive mixture between two land cover classes that are the forest and water classes, the water was masked out using the infrared bands 4, 5 and 7 in all Landsat ETM+ images.
3.2. Spectral Analysis of Mangrove Forests
Mangroves are a typical example of an evergreen forest [20], situated in the intertidal zone along tropical coastlines of saline water and can be found along riverbanks. It is easy to differentiate among mangrove forests and other evergreen inland forests when doing a field survey. However, it maybe difficult to differentiate between these forests using remote sensing data, especially when mangrove forests are not covering a wide area, as was the case for this research study. Therefore, it is important to realize the environmental conditions in which mangrove forests live, to be able to classify this vital land cover, as a separate class. As stated earlier, mangrove forests exist usually along the coastline, which means in low elevation areas. Thus, it is very important to include the topographic condition as one factor when mapping the mangrove forests. Another important factor is that the mangrove forests exist in an aquatic environment, which indicates that water is a predominant factor. These two factors are considered common factors of all mangrove forests, which are not restricted to specific species of mangrove. These two factors are the basis of mapping mangrove forests which can be used not only at a local scale but also at a regional scale. Therefore, to develop an efficient method for mapping mangroves, the spatial distribution of mangrove forests and their spectral characteristics should be taken into consideration. Specifically, normalized difference water index (NDWI), normalized difference vegetation index (NDVI), and topographic conditions should be considered, in order to maximize the contrast between mangrove and non-mangrove forests.
3.2.1. NDWI and NDVI
The Normalized Difference Water Index (NDWI) proposed by [21] was used to assess the vegetation water content using remote sensing data based on physical principles. NDWI is sensitive to changes of water content of vegetation canopies. It is considered as an independent vegetation index that was developed to delineate vegetation water content features, and to enhance their presence in remotely-sensed digital imagery. NDWI is expressed using the following:
 where NIR is the reflectance or radiance in a near infrared wavelength channel (0.78 - 0.90 μm), and SWIR is the reflectance or radiance in a short wave infrared wavelength channel (1.55 - 1.75 μm).
NIR and SWIR correspond to bands 4 and 5 for ETM+ images, respectively. The NIR reflectance is affected by leaf internal structure and leaf dry matter content. Therefore, this channel is located in the high reflectance plateau of vegetation canopies [21], and it is frequently used for vegetation analysis. On the other hand, the SWIR reflectance reflects changes in the vegetation water content, and it is sensitive to water conditions in leaves as well as on the topsoil [13]. NDWI is one of the indices that contrast the SWIR channel with the NIR channel that are sensitive to the mass or volume of water and not to the fractional percentage of water [22].
Normalized Difference Vegetation Index (NDVI) was used widely to monitor the quality and distribution of vegetation. NDVI was, in fact, often referred to as a greenness index. This index can be computed with a simple formula [23].

where Red is the reflectance or radiance in a visible wavelength channel (0.63 - 0.69 μm), and corresponds to band 3 for ETM+ images.
In this article, NDVI images were generated to enhance mangrove forests that have higher NIR reflectance, and lower red light reflectance. Also, NDVI images were produced to eliminate water bodies, those of low red light reflectance, and those of very low NIR reflectance.
Since NDWI and NDVI were used to detect the vegetation water content, and to monitor the distribution of vegetation, respectively; the difference between these two indices successfully emphasized the existence of aquatic vegetation on the images [13], which implies positive illustration of mangrove forests locations (Figure 2(a)).
3.2.2. Band Ratio
The band ratio was used to enhance the spectral differences between bands, and to reduce the effects of topography. Dividing one spectral band by another can produce an image that provides relative band intensities. In the resultant image of band ratio, certain ground features tend to be highlighted based on unusual or anomalous ratio values, and also eliminate the effects of dark shadow. In this present study, band ratio 5/4 was used to improve the difference between mangroves and nonmangrove forests. The selection of this band ratio was based on the physical properties and canopy spectra of mangrove forests, which had already been used for mapping mangrove forests in Belize [11]. Figure 2(b) illustrates the output image of a band ratio derived from Landsat ETM+, and it can easily recognize mangrove forests, which are shown in dark grey.
3.2.3. Band 5
The Band 5 of Landsat ETM+ was frequently applied to monitor vegetation moisture content. This band has wavelength (1.55 - 1.75 µm), and is located in the short wave infrared, as mentioned earlier. The spectral profile of band 5 showed a lower digital number (DN) value within mangrove forest compared with other classes [24]. This makes band 5 very useful for distinguishing mangrove forests from other vegetations. In band 5, the mangrove forests appeared in dark grey (Figure 2(c)).
3.2.4. Digital Elevation Model
The classification of a study site can be improved with the addition of a digital elevation model (DEM). A DEM is an important factor for classifying forest vegetation
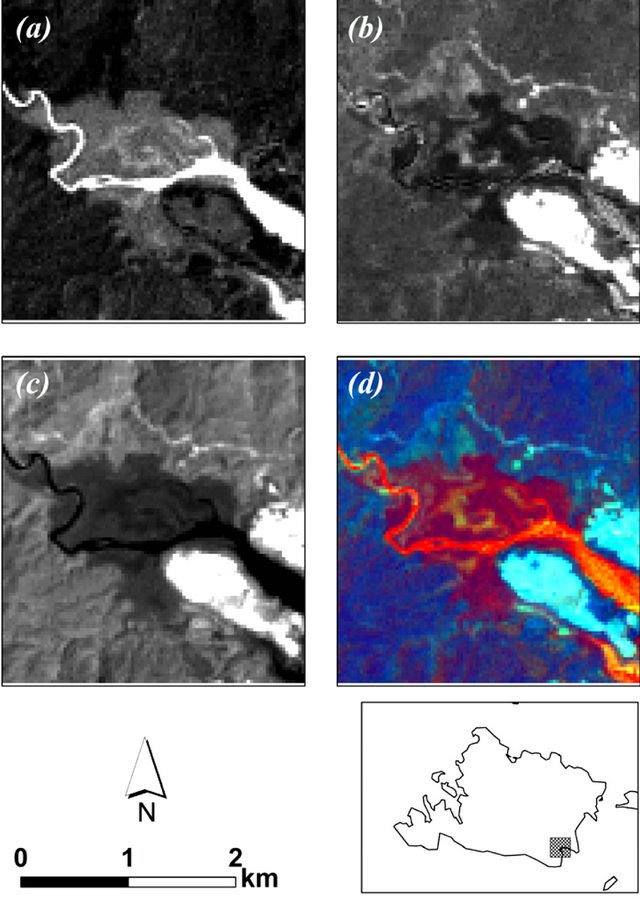
Figure 2. The band analyses used to extract the mangrove forests, an example in Iriomote Island. (a) The difference between NDWI and NDVI image showed the mangrove forest in light grey color; (b) The band ratio 5/4 image showed the mangrove forest in dark grey color; (c) The mangrove forest appeared in dark grey color using band 5 of Landsat ETM+ image; (d) A color composite image of the difference between NDWI and NDVI, band ratio 5/4 image, and band 5 of Landsat ETM+ exposed through RGB color, respectively.
distributed by elevation [25]. It represents the correlation among the cover types such as forest and habitats located in the study area. Thus, the result of classification can be improved when adding the DEM rather than the original classification method, because it can increase the distinction among the forests and other vegetation species, based on elevation values.
A DEM of each island, acquired by SRTM, was employed as an important criterion for classifying mangrove forests based on their DN values that represent the elevation. A DEM was integrated with the spectral data after being resampled from 90 m to 30 m spatial resolution, to improve the visual discrimination between mangroves and other vegetation located in the study area and to exclude non-mangrove pixels that had similar spectral attributes with mangrove pixels, but were located above the elevation limiting line [26].
A DEM clearly separated the mangrove forests that were located within lowland areas (along the shoreline and rivers) from other forests and vegetation located in highland areas.
3.3. Layer Stacking
The four parameters: the difference between NDWI and NDVI, band ratio 5/4, band 5 of Landsat ETM+, and the DEM, were merged and stacked together in one image resulting in the final image containing three spectral variables and one topographic variable. This final image was used to classify and map the real extent of mangrove forests in each image for each island, separately, as shown in Figure 2(d).
3.4. Classification
3.4.1. Selection of Training Sites and Classification
A supervised classification approach was adopted to classify the mangrove forests. The maximum likelihood algorithm was performed using carefully selected training areas. The training areas were delineated very carefully for each image to represent the real extent of mangrove forests located on various elevations, regardless of their species.
The training samples were drawn in order to get the spectral signature of mangrove forests and other different land use/cover classes in each image, separately. Thereby, a supervised classification technique using maximum Likelihood classifier was subsequently applied on each image to map the mangrove forests and other land use/ cover classes. Post-classification editing was done to merge all the different land use/cover classes, except the mangrove forests class, into one class called the nonmangrove forests class. Thus, the final classified images contain two classes: the mangrove forest class and the non-mangrove forest class. A median convolution filter, kernel size 3 ´ 3, was used to smooth the classified images and to remove isolated pixels.
3.4.2. Accuracy Assessment
This study relied on 1:25,000 and 1:50,000 vegetation maps to evaluate the accuracy of the classified mangrove forests obtained from Landsat ETM+ images. However, it was necessary to confirm their reliability first before using them as references. Therefore, other reference data were used in this study such as aerial photographs and detailed topographic maps to validate the vegetation maps. After validating the vegetation maps, they were used as references to check the accuracy of the classified Landsat images.
From the histogram analysis, it was found Mangrove forests in the study area distribute within 1 km from the shoreline and lower than 20 m above sea level; therefore, the random samples were distributed within the selected threshold values mentioned above. For Okinawa, Ishigaki and Iriomote Islands, a total of 250 random sample points were selected (100 points for mangrove forests class and 150 points for non-mangrove forests class), while a total of 150 random sample points were selected for Tanega and Amami-O Islands (50 points for mangrove forests class and 100 points for non-mangrove forests class). The number of sample points was decided based on the area of mangrove forests in each island. Table 2 shows the calculated overall accuracy, user and producer accuracies, and kappa coefficient of the classified mangrove forests class in Tanega, Amami-O, Okinawa, Ishigaki and Iriomote islands, respectively.
4. Results and Discussion
A total of 7.67 km2 of mangrove forests was calculated within the study area. Table 3 presents a comparison between the land area of mangrove forests calculated from both of the classified Landsat images, and vegetation maps for each island.
The results of this study were compared with a number of existing global land cover maps such as GLC2000, GLCNMO and the world mangrove atlas, and regional maps such as the reference vegetation maps, to evaluate the relative performance of this methodology. It is worthy of mention that the GLC2000, which used daily 1-km SPOT/VEGETATION data of 2000, did not show any mangrove forest in the study area. While in GLCNMO of

Table 2. Results of accuracy assessment of the classified maps produced from Landsat ETM+.

Table 3. Comparison of mangrove forests land area in Japan (km2).
2010, the mangrove forests were mapped as a separate class. In GLCNMO data, the mangrove forests were extracted by visual interpretation of Landsat ETM+ images, and by digitizing the mangrove forests available in the world mangrove atlas. In other words, the mangrove forests in both GLCNMO and world mangrove atlas were identical, for the study area. A detailed analysis of each island is discussed, separately.
4.1. Kyushu Island
The vegetation map showed that the land area of mangrove forests in this island was about 0.05 km2. Whereas, the results indicated that there were no mangrove forests in Kyushu Island. The use of a Landsat image to extract this small patch of mangrove was insufficient. Higher spatial resolution data such as, Compact Airborne Spectrographic Imager (CASI), Quickbird, and IKONOS images might be able to extract this small area of mangrove forests located in Kyushu Island. However, the expense of mapping an area equivalent to the coverage of this small patch would be considerable.
4.2. Tanega Island
The mangrove forests covered about 0.33 km2 when calculated from the classified Landsat image, while the land area of mangrove forests calculated from the vegetation map was about 0.28 km2. This implies that there was a consistency between the mangrove forests of the classified Landsat data and the reference vegetation data (Figure 3).
4.3. Amami-O Island
Based on the vegetation map, the land area of mangrove forests in this island was approximately 0.56 km2. While only 0.34 km2 of mangrove forests was calculated from
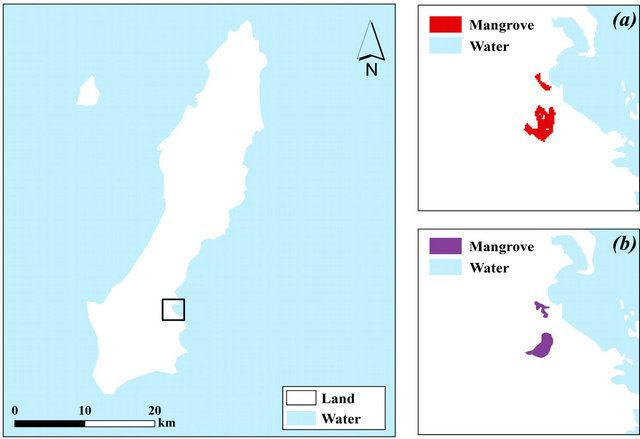
Figure 3. A comparison between (a) mangrove forests obtained from classifying a Landsat image, and (b) mangrove forests obtained from reference vegetation map, in Tanega Island.
the classified Landsat image. The difference of 0.22 km2 of land area might be due to insufficiency of Landsat spatial resolution to extract very small areas of mangrove forests, which required finer spatial resolution data.
Figure 4 illustrates a comparison of mangrove forests resulting from the classified Landsat image and the vegetation map.
4.4. Okinawa Island
Mangrove forests in Okinawa Island covered an area of 0.26 km2 according to the reference vegetation map. Whereas, the calculated area of mangroves forests from the classified Landsat image was 0.20 km2. This means that the results of the classification were quite close to the land area calculated from the reference vegetation map (Figure 5).
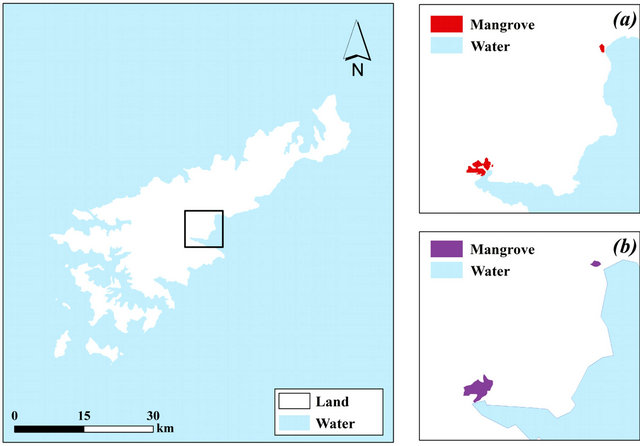
Figure 4. A comparison between (a) mangrove forests obtained from classifying a Landsat image, and (b) mangrove forests obtained from reference vegetation map, in AmamiO Island Island.

Figure 5. A comparison between (a), (b), (c) mangrove forests obtained from classifying a Landsat image, and (a'), (b'), (c') mangrove forests obtained from reference vegetation map, in Okinawa Island.
4.5. Ishigaki Island
The Mangrove forests on Ishigaki Island covered a larger area compared with the above mentioned islands (Figure 6). The calculated land area of mangrove forests from the classified Landsat image was about 0.8 km2, which was very close to the land area of 1.0 km2 calculated from the reference vegetation maps.
4.6. Iriomote Island
The largest area covered by mangrove forests was concentrated in Iriomote Island, as presented in Figure 7. The land area of mangrove forests mapped from the Landsat image was about 6.00 km2, while in the referenced vegetation map, it was about 6.2 km2.
The comparison results between the classified Landsat images, and the reference vegetation maps provided a great support to the methodology used to extract the mangrove forests. Despite the fact that most of the land areas were less than 1 km2 (Table 3) with the exception of Iriomote Island, the spectral analysis of Landsat images together with the DEM data were able to detect the mangrove forests clearly.
The methodology used in this study was developed after several attempts that were applied on Iriomote Island, as an example, since it has the largest area of mangrove forests in the study area, in order to get the most accurate method to illustrate the real extent of mangrove forests in the study area. One of these methods was to use the spectral data only, without using the DEM. Thus, the result was not good when it was compared with the vegetation maps, since this method was not able to separate the mangrove forests from other forests that have similar spectral characteristics located at higher elevations. The results of this method showed an overall accuracy of 74.4% and a Kappa coefficient of 0.41 as

Figure 6. A comparison between (a) mangrove forests obtained from classifying a Landsat image, and (b) mangrove forests obtained from reference vegetation map, in Ishigaki Island.
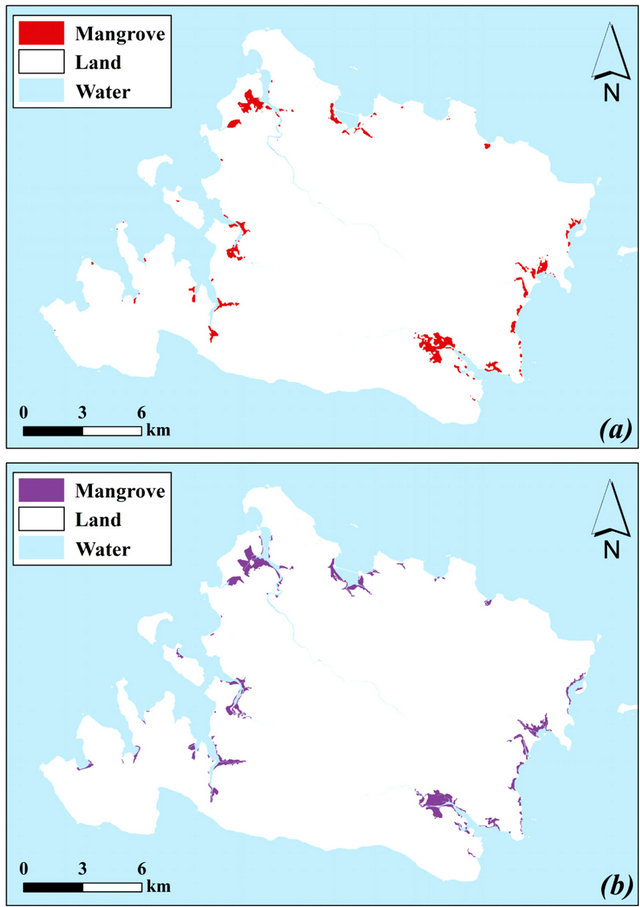
Figure 7. A comparison between (a) mangrove forests obtained from classifying a Landsat image, and (b) mangrove forests obtained from reference vegetation map, in Iriomote Island.
shown in Table 2. Then, a DEM was applied through using an elevation threshold value based on [27]. However, this did not lead to accurate results, which showed a larger area of mangrove forest than the actual situation, due to the interference of other surrounding vegetation that usually grows alongside mangroves. Using this method the overall accuracy was 69.2%, and the kappa coefficient was 0.27 (Table 2). Therefore, it was decided to incorporate the DEM without assigning any threshold value.
Another method was applied by setting a threshold value to the difference between NDWI and NDVI. The results showed that whether a threshold value was set or not, the mangrove mapping results did not change. Therefore, it was determined to use the difference between NDWI and NDVI without setting a threshold value.
Other attempts were used to check which were the best Landsat ETM+ bands to increase the contrast between mangrove and non-mangrove forests. Until it was decided that band 5 was the best among the other bands. The use of band 5 of Landsat ETM+ facilitated the selection of training areas that were used after that for classification.
It is well known that serious confusion occurs when using conventional methods in mangrove classification, because some types of land cover (e.g., agricultural land and forests) have similar spectral behaviors and distribution features to mangroves [27]. Therefore, further processes were applied to test the capability of integrating the difference between NDWI and NDVI to map the mangrove forests. In the first process, NDWI and NDVI images were merged with the band ratio 5/4, band 5 and the DEM, representing an image composed of five parameters. In the second process, only the NDWI image was merged and integrated with the other parameters without using the NDVI image. In the third process, the NDVI image was used alone, and merged with the other parameters without using the NDWI image. These three processes were tested on Iriomote Island, as an example. The classification results of the three processes showed that the area covered by mangrove forests was less than the actual by 4 km2 when compared with the reference vegetation map, due to the interference of the mangrove forest class with the other land cover classes when using just NDWI and NDVI.
Accordingly, the spectral characteristics that were obtained from Landsat data, based on the physical properties of mangrove forests, in combination with topographic information, increased the accuracy of mapping the mangrove forests. In particular, the combination among the difference between NDWI and NDVI, band ratio 5/4, the band 5 of Landsat ETM+ and the DEM, has increased the accuracy of mapping the mangrove forests. Using this method the mangrove forests can be separated clearly from other forests located within the same area.
5. Conclusions
The objective of this study was to develop a method that is capable of mapping mangrove forests at a regional scale as an independent land cover class using remote sensing techniques. In this research, the mangrove forests were accurately mapped by integrating the difference between NDWI and NDVI, band ratio 5/4, and band 5, obtained from Landsat ETM+ with the topographic information. This realistic integration clearly separated the mangrove forests from other vegetation types. High accuracy results have already been achieved, leaving little opportunity for further improvements.
Although the total area of mangrove forests located in Japan is small, this methodology was been able to map this important land cover class successfully with high accuracy. The production of regional mangrove maps in Japan supported the use of ancillary topographic data over the solo use of spectral data. This can increase the possibility of employing this method presented in this research to be applied as a guideline for producing mangrove maps at regional scales. Also, it is hypothesized that this technique can be applied in other countries that are rich in mangrove forests.
This study can be important for monitoring the changes of mangrove forests over time, and for mapping regional mangrove forests accurately and cost-effectively. However, this method can not be used to discriminate between different species of mangroves. Moreover, the frequent existence of clouds in tropical and subtropical areas is considered the main difficulty of using optical remote sensing data, which have to be taken into consideration when producing regional maps of mangrove forests.
REFERENCES
- G. Concheddaa, L. Durieuxb and P. Mayauxa, “An Object-Based Method for Mapping and Change Analysis in Mangrove Ecosystems,” ISPRS Journal of Photogrammetry & Remote Sensing, Vol. 63, No. 5, 2008, pp. 578- 589. doi:10.1016/j.isprsjprs.2008.04.002
- A. Held, C. Ticehurst, L. Lymburner and N. Williams, “High Resolution Mapping of Tropical Mangrove Ecosystems Using Hyperspectral and Radar Remote Sensing,” International Journal of Remote Sensing, Vol. 24, No. 13, 2003, pp. 2739-2759.
- C. Vaiphasa, A. K. Skidmore and W. F. De Boer, “A Post-Classifier for Mangrove Mapping Using Ecological Data,” ISPRS Journal of Photogrammetry & Remote Sensing, Vol. 61, No. 1, 2006, pp. 1-10. doi:10.1016/j.isprsjprs.2006.05.005
- J. Gao, “A Comparative Study on Spatial and Spectral Resolutions of Satellite Data in Mapping Mangrove Forests,” International Journal of Remote Sensing, Vol. 20, No. 14, 1999, pp. 2823-2833. doi:10.1080/014311699211813
- M. Bird, S. Chua, L. K. Fifield, T. S. Teh and J. Lai, “Evolution of the Sungei Buloh-Kranji Mangrove Coast, Singapore,” Applied Geography, Vol. 24, No. 3, 2004, pp. 181-198. doi:10.1016/j.apgeog.2004.04.002
- P. Filho, E. Martins and F. Da Costa, “Using Mangroves as a Geological Indicator of Coastal Changes in the Braganca Macrotidal Flat, Brazilian Amazon: A Remote Sensing Data Approach,” Ocean & Coastal Management, Vol. 49, No. 7-8, 2006, pp. 462-475. doi:10.1016/j.ocecoaman.2006.04.005
- M. R. Murray, S. A. Zisman, P. A. Furley, D. M. Munro, J. Gibson, J. Ratter, S. Bridgewater, C. D. Minty and C. J. Place, “The Mangroves of Belize Part 1. Distribution, Composition and Classification,” Forest Ecology and Management, Vol. 174, No. 1-3, 2003, pp. 265-279. doi:10.1016/S0378-1127(02)00036-1
- V. Pasqualini, J. Iltis, N. Dessay, M. Lontier, O. Guelorget and L. Polidori, “Mangrove Mapping in North-Western Madagascar Using SPOT-XS and SIR-C Radar Data,” Hydrobiologia, Vol. 413, 1999, pp. 127-133. doi:10.1023/A:1003807330375
- J. M. Kovacs, F. F. Santiago, J. Bastien and P. Lafrance, “An Assessment of Mangroves in Guinea, West Africa, Using a Field and Remote Sensing Based Approach,” Wetlands, Vol. 30, No. 4, 2010, pp. 773-782. doi:10.1007/s13157-010-0065-3
- M. Saleh, “Assessment of Mangrove Vegetation on Abu Minqar Island of the Red Sea,” Journal of Arid Environments, Vol. 68, No. 2, 2007, pp. 331-336. doi:10.1016/j.jaridenv.2006.05.016
- E. P. Green, C. D. Clark, P. J. Mumby, A. J. Edwards and A. C. Ellis, “Remote Sensing Techniques for Mangrove Mapping,” International Journal of Remote Sensing, Vol. 19, No. 5, 1998, pp. 935-956. doi:10.1080/014311698215801
- H. Saito, M. F. Bellan, A. Al-Habshi, M. Aizpuru and F. Blasco, “Mangrove Research and Coastal Ecosystem Studies with SPOT-4 HRVIR and TERRA ASTER in the Arabian Gulf,” International Journal of Remote Sensing, Vol. 24, No. 21, 2003, pp. 4073-4092. doi:10.1080/0143116021000035030
- P. H. S. Tong, Y. Auda, J. Populus, M. Aizpuru, A. Al Habshi and F. Blasco, “Assessment from Space of Mangroves Evolution in the Mekong Delta, in Relation to Extensive Shrimp Farming,” International Journal of Remote Sensing, Vol. 25, No. 21, 2004, pp. 4795-4812. doi:10.1080/01431160412331270858
- C. Giri, B. Pengra, Z. Zhu, A. Singh and L. L. Tieszen, “Monitoring Mangrove Forest Dynamics of the Sundarbans in Bangladesh and India Using Multi-Temporal Satellite Data from 1973 to 2000,” Estuarine, Coastal and Shelf Science, Vol. 73, No. 1-2, 2007, pp. 91-100. doi:10.1016/j.ecss.2006.12.019
- F. Blasco, T. Gauquelin, M. Rasolofoharinoro, J. Denis, M. Aizpuru and V. Caldairou, “Recent Advances in Mangrove Studies Using Remote Sensing Data,” Marine and Freshwater Research, Vol. 49, No. 4, 1998, pp. 287-296. doi:10.1071/MF97153
- GLC2000 Website. http://bioval.jrc.ec.europa.eu/products/glc2000/glc2000.php
- R. Tateishi, B. Uriyangqai, H. Al-Bilbisi, M. Aboel Ghar, J. Tsend-Ayush, T. Kobayashi, A. Kasimu, N. Hoan, A. Shalaby, B. Alsaaideh, T. Enkhzaya, Gegentana and H. P. Sato, “Production of Global Land Cover Data-GLCNMO,” International Journal of Digital Earth, Vol. 4, No. 1, 2010, pp. 22-49. doi:10.1080/17538941003777521
- Global Land Cover Facility (GLCF) Website. http://glcf.umd.edu
- US Geological Survey (USGS), “Center for Earth Resources Observation and Science (EROS).” http://glovis.usgs.gov/
- J. M. Kovacs, F. Flores-Verdugo, J. Wang and L. P. Aspden, “Estimating Leaf Area Index of a Degraded Mangrove Forest Using High Spatial Resolution Satellite Data,” Aquatic Botany, Vol. 80, No. 1, 2004, pp. 13-22. doi:10.1016/j.aquabot.2004.06.001
- B. Gao, “NDWI—A Normalized Difference Water Index for Remote Sensing of Vegetation Liquid Water from Space,” Remote Sensing of Environment, Vol. 58, No. 3, 1996, pp. 257-266. doi:10.1016/S0034-4257(96)00067-3
- T. J. Jackson, D. Y. Chen, M. Cosh, F. Q. Li, M. Anderson, C. Walthall, P. Doriaswamy and E. Ray Hunt, “Vegetation Water Content Mapping Using Landsat Data Derived Normalized Difference Water Index for Corn and Soybeans,” Remote Sensing of Environment, Vol. 92, No. 4, 2004, pp. 475-482. doi:10.1016/j.rse.2003.10.021
- J. W. Rouse, R. H. Haas, J. A. Schell and D. W. Deering, “Monitoring Vegetation Systems in the Great Plains with ERTS,” Third Earth Resources Technology Satellite-1 Symposium, National Aeronautics and Space Administration, Washington DC, NASA SP-351, Vol. 1, 1973, pp. 309-317.
- B. Alsaaideh, A. Al-Hanbali, R. Tateishi and N. T. Hoan, “The Integration of Spectral Analyses of Landsat ETM+ with the DEM Data for Mapping Mangrove Forests,” IEEE International Symposium of Proceeding of Geoscience and Remote Sensing, Vancouver, 24-29 July 2011, pp. 1914-1917.
- J. T. Lee, Y. M. Shuai and Q. Zhu, “Using Images Combined with DEM in Classifying Forest Vegetations,” IEEE International Symposium of Proceeding of Geoscience and Remote Sensing, Vol. 4, 2004, pp. 2362-2364.
- K. Liu, X. Li, X. Shi and S. G. Wang, “Monitoring Mangrove Forest Changes Using Remote Sensing and GIS Data with Decision-Tree Learning,” Wetlands, Vol. 28, No. 2, 2008, pp. 336-346. doi:10.1672/06-91.1
- S. R. Phinn, C. Menges, G. J. Hill and M. Stanford, “Optimizing Remotely Sensed Solutions for Monitoring, Modeling, and Managing Coastal Environments,” Remote Sensing of Environment, Vol. 73, No. 2, 2000, pp. 117- 132. doi:10.1016/S0034-4257(00)00087-0
NOTES
*Corresponding author.

